

From Cell to Beak: In-Vitro and In-Vivo Characterization of Chicken Bitter Taste Thresholds
- PMID: 28513558
- PMCID: PMC6154005
- DOI: 10.3390/molecules22050821
From Cell to Beak: In-Vitro and In-Vivo Characterization of Chicken Bitter Taste Thresholds
Abstract
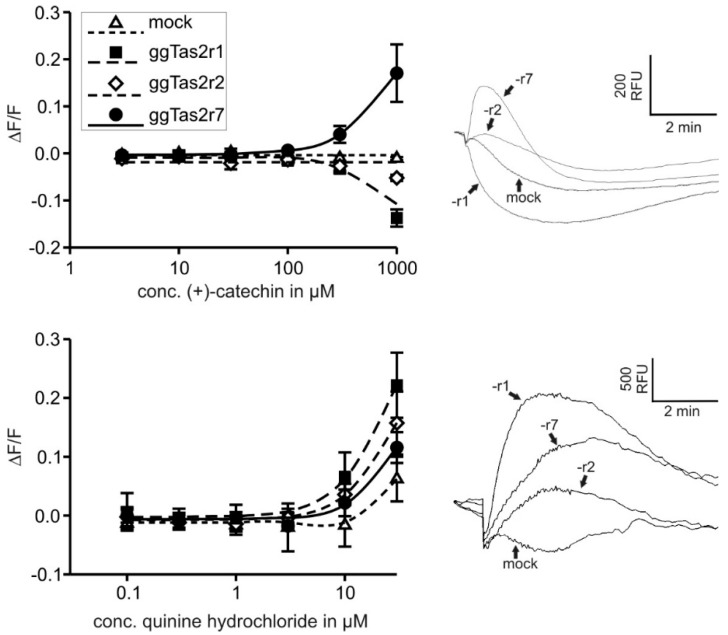
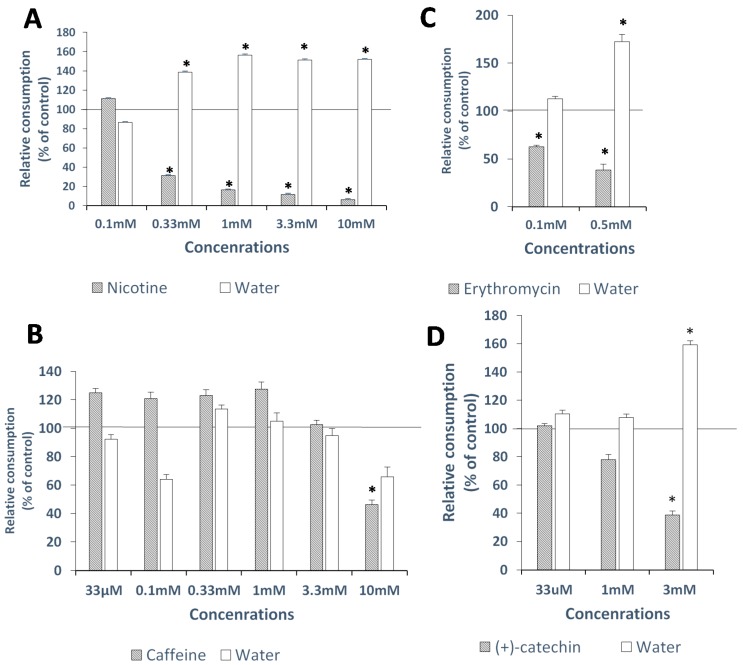
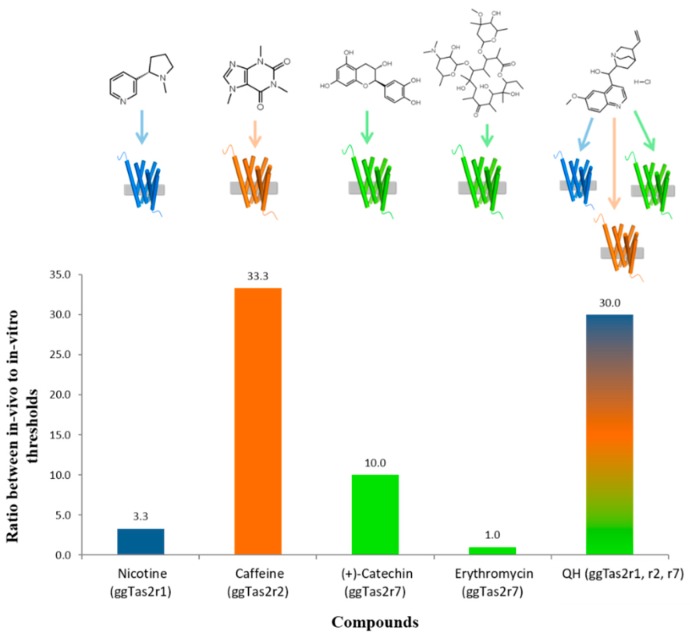
Bitter taste elicits an aversive reaction, and is believed to protect against consuming poisons. Bitter molecules are detected by the Tas2r family of G-protein-coupled receptors, with a species-dependent number of subtypes. Chickens demonstrate bitter taste sensitivity despite having only three bitter taste receptors-ggTas2r1, ggTas2r2 and ggTas2r7. This minimalistic bitter taste system in chickens was used to determine relationships between in-vitro (measured in heterologous systems) and in-vivo (behavioral) detection thresholds. ggTas2r-selective ligands, nicotine (ggTas2r1), caffeine (ggTas2r2), erythromycin and (+)-catechin (ggTas2r7), and the Tas2r-promiscuous ligand quinine (all three ggTas2rs) were studied. Ligands of the same receptor had different in-vivo:in-vitro ratios, and the ggTas2r-promiscuous ligand did not exhibit lower in-vivo:in-vitro ratios than ggTas2r-selective ligands. In-vivo thresholds were similar or up to two orders of magnitude higher than the in-vitro ones.
Keywords: T2R; Tas2r; avian; bitter taste; calcium imaging; chicken; ggTas2r; in-vitro; in-vivo; threshold.
Conflict of interest statement
The authors declare no conflict of interest.
Figures
Similar articles
-
Molecular Features Underlying Selectivity in Chicken Bitter Taste Receptors.Front Mol Biosci. 2018 Jan 31;5:6. doi: 10.3389/fmolb.2018.00006. eCollection 2018. Front Mol Biosci. 2018. PMID: 29445727 Free PMC article.
-
Ligand binding modes from low resolution GPCR models and mutagenesis: chicken bitter taste receptor as a test-case.Sci Rep. 2017 Aug 15;7(1):8223. doi: 10.1038/s41598-017-08344-9. Sci Rep. 2017. PMID: 28811548 Free PMC article.
-
Bitter, sweet and umami taste receptors and downstream signaling effectors: Expression in embryonic and growing chicken gastrointestinal tract.Poult Sci. 2015 Aug;94(8):1928-41. doi: 10.3382/ps/pev152. Epub 2015 Jun 6. Poult Sci. 2015. PMID: 26049797
-
Machine learning approaches to predict TAS2R receptors for bitterants.Biotechnol Bioeng. 2024 Jun;121(6):1755-1758. doi: 10.1002/bit.28709. Epub 2024 Apr 8. Biotechnol Bioeng. 2024. PMID: 38587175 Review.
-
Bitter taste receptor research comes of age: from characterization to modulation of TAS2Rs.Semin Cell Dev Biol. 2013 Mar;24(3):215-21. doi: 10.1016/j.semcdb.2012.08.006. Epub 2012 Aug 27. Semin Cell Dev Biol. 2013. PMID: 22947915 Review.
Cited by
-
Biomimetic Sensors for the Senses: Towards Better Understanding of Taste and Odor Sensation.Sensors (Basel). 2017 Dec 11;17(12):2881. doi: 10.3390/s17122881. Sensors (Basel). 2017. PMID: 29232897 Free PMC article. Review.
-
Functional divergence of bitter taste receptors in a nectar-feeding bird.Biol Lett. 2019 Sep 27;15(9):20190461. doi: 10.1098/rsbl.2019.0461. Epub 2019 Sep 25. Biol Lett. 2019. PMID: 31551065 Free PMC article.
-
Effect of Bitter Compounds on the Expression of Bitter Taste Receptor T2R7 Downstream Signaling Effectors in cT2R7/pDisplay-Gα16/gust44/pcDNA3.1 (+) Cells.Biomed Res Int. 2019 Oct 31;2019:6301915. doi: 10.1155/2019/6301915. eCollection 2019. Biomed Res Int. 2019. PMID: 31781630 Free PMC article.
-
Molecular Features Underlying Selectivity in Chicken Bitter Taste Receptors.Front Mol Biosci. 2018 Jan 31;5:6. doi: 10.3389/fmolb.2018.00006. eCollection 2018. Front Mol Biosci. 2018. PMID: 29445727 Free PMC article.
-
Responsiveness Expressions of Bitter Taste Receptors Against Denatonium Benzoate and Genistein in the Heart, Spleen, Lung, Kidney, and Bursa Fabricius of Chinese Fast Yellow Chicken.Animals (Basel). 2019 Aug 6;9(8):532. doi: 10.3390/ani9080532. Animals (Basel). 2019. PMID: 31390726 Free PMC article.
References
MeSH terms
Substances
LinkOut - more resources
Full Text Sources
Other Literature Sources
