. 2017 May 17:8:15454.
doi: 10.1038/ncomms15454.

An integrated model for detecting significant chromatin interactions from high-resolution Hi-C data

Affiliations

An integrated model for detecting significant chromatin interactions from high-resolution Hi-C data

Mark Carty et al. Nat Commun. .

Abstract

Here we present HiC-DC, a principled method to estimate the statistical significance (P values) of chromatin interactions from Hi-C experiments. HiC-DC uses hurdle negative binomial regression account for systematic sources of variation in Hi-C read counts-for example, distance-dependent random polymer ligation and GC content and mappability bias-and model zero inflation and overdispersion. Applied to high-resolution Hi-C data in a lymphoblastoid cell line, HiC-DC detects significant interactions at the sub-topologically associating domain level, identifying potential structural and regulatory interactions supported by CTCF binding sites, DNase accessibility, and/or active histone marks. CTCF-associated interactions are most strongly enriched in the middle genomic distance range (∼700 kb-1.5 Mb), while interactions involving actively marked DNase accessible elements are enriched both at short (<500 kb) and longer (>1.5 Mb) genomic distances. There is a striking enrichment of longer-range interactions connecting replication-dependent histone genes on chromosome 6, potentially representing the chromatin architecture at the histone locus body.


Conflict of interest statement

The authors declare no competing financial interests.

Figures

Figure 1
Figure 1. HiC-DC reduces inflation in estimates of statistical significance of Hi-C interactions.
(a) Expected interaction bin counts as a function of genomic distance according to the HiC-DC model for chromosome 1, using the Rao et al. GM12878 Hi-C data set. (Green line) Initial model estimate, prior to outlier removal, plotting the mean of the hurdle regression model as a function of genomic distance and setting other covariates to their mean values. (Red points) Bin counts of outliers with mean counts in the top 3% of the zero-truncated negative binomial regression distribution as estimated by the model for the corresponding bins. (Blue line) Refit model, after removal of outliers. (Black points) Empirical mean bin counts for bins in genomic distance intervals. (b) Q–Q plots P values estimated by HiC-DC (zero-truncated negative binomial regression) as well as zero-truncated Poisson, negative binomial, and Poisson models (y axis) versus uniform distribution (x axis). All models were estimated on chromosome 1 of the Rao et al. GM12878 data set. (c) Q–Q plots for HiC-DC and Fit-Hi-C, a method that uses ICE normalization to account for biases and estimates a binomial distribution using a spline fit. (d) Scatterplot of HiC-DC and Fit-Hi-C –log P values on chromosome 1 of the Rao et al. data set for different genomic distance ranges. (e) Precision-recall curves for the detection of chromatin interactions by HiC-DC, defined as the interactions significant at FDR < 1% based on all read data, for different downsamplings of reads on chromosome 1 of the Rao et al. GM12878 data set.
Figure 2
Figure 2. HiC-DC identifies identifies interactions associated with regulatory and structural elements at the sub-TAD level.
(a) Raw Hi-C count matrix from the Rao et al. GM12878 data set for a ∼700 kb region including the BLC2 locus. Sub-TAD regions as called by Rao et al. are shown as blue squares. (b) Significant interactions (–log10 P values) for the same region as estimated by HiC-DC. (c) Epigenomic tracks for GM12878 for the same region, showing DNase I hypersensitive sites, H3K27ac, ChIP-seq for components of the cohesin complex, and Hi-C hotspots as estimated by HiC-DC. (d) Sashimi plot depiction of significant interactions called by HiC-DC, showing chromatin looping between hotspots associated with regulatory and structural elements.
Figure 3
Figure 3. Distinct classes of structural and regulatory interactions occur at different distance ranges.
(a) Relative enrichments of significant HiC-DC interactions (FDR < 1%) for the Rao et al. GM12878 data as annotated by epigenetic signals, as a function of genomic distance. For each 10 kb band, enrichment of interactions with each specific annotation were computed relative to the background prevalence of this annotation (by Fisher's exact test), and then the enrichment P values for each annotation over 100 kb distance subranges were compared to all other annotations (Methods section). (b) Relative enrichments of significant HiC-DC interactions (FDR<1%) for the Rao et al. data as annotated by genomic location (promoter, gene body, or distal intergenic), as a function of genomic distance. Enrichment of interactions for each 10 kb band were computed as in a, then the enrichment P values for each annotation over 50 kb distance subranges were compared as in a.
Figure 4
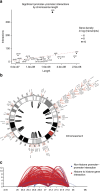
Figure 4. Long-range promoter–promoter interactions are enriched at the histone locus on chromosome 6.
(a) Number of significant long-range (1.5—2 Mb) promoter–promoter interactions per chromosome plotted versus chromosome length, showing striking enrichment of such interactions on chromosome 6. (b) Circos plot of long-range (1.5–2 Mb) promoter–promoter interactions on chromosome 6. Opacity of arcs indicates density of Hi-C contacts, showing a cluster of interactions at the histone locus. (c) Significant promoter–promoter interactions linking histone gene pairs (red arcs) or non-histone gene pairs (blue arcs) at the histone locus on chromosome 6.

References

    1. Lieberman-Aiden E. et al.. Comprehensive mapping of long-range interactions reveals folding principles of the human genome. Science 326, 289–293 (2009). - PMC - PubMed
    1. Tanizawa H. et al.. Mapping of long-range associations throughout the fission yeast genome reveals global genome organization linked to transcriptional regulation. Nucleic Acids Res. 38, 8164–8177 (2010). - PMC - PubMed
    1. Sexton T. et al.. Three-dimensional folding and functional organization principles of the Drosophila genome. Cell 148, 458–472 (2012). - PubMed
    1. Duan Z. et al.. A three-dimensional model of the yeast genome. Nature 465, 363–367 (2010). - PMC - PubMed
    1. Imakaev M. et al.. Iterative correction of Hi-C data reveals hallmarks of chromosome organization. Nat. Methods 9, 999–1003 (2012). - PMC - PubMed

Publication types

LinkOut - more resources