. 2017 Aug;14(4):045001.
doi: 10.1088/1741-2552/aa6806.

An open source, wireless capable miniature microscope system

Affiliations

An open source, wireless capable miniature microscope system

William A Liberti et al. J Neural Eng. 2017 Aug.

Abstract

Objective: Fluorescence imaging through head-mounted microscopes in freely behaving animals is becoming a standard method to study neural circuit function. Flexible, open-source designs are needed to spur evolution of the method.

Approach: We describe a miniature microscope for single-photon fluorescence imaging in freely behaving animals. The device is made from 3D printed parts and off-the-shelf components. These microscopes weigh less than 1.8 g, can be configured to image a variety of fluorophores, and can be used wirelessly or in conjunction with active commutators. Microscope control software, based in Swift for macOS, provides low-latency image processing capabilities for closed-loop, or BMI, experiments.

Main results: Miniature microscopes were deployed in the songbird premotor region HVC (used as a proper name), in singing zebra finches. Individual neurons yield temporally precise patterns of calcium activity that are consistent over repeated renditions of song. Several cells were tracked over timescales of weeks and months, providing an opportunity to study learning related changes in HVC.

Significance: 3D printed miniature microscopes, composed completely of consumer grade components, are a cost-effective, modular option for head-mounting imaging. These easily constructed and customizable tools provide access to cell-type specific neural ensembles over timescales of weeks.


Figures
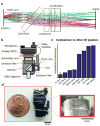
Figure 1
Figure 1. A custom 3D printed head-mounted fluorescence microscope
A. Optical layout of emission pathway for miniature microscope. B. Microscope schematic. Microscope body is lightweight and robust; CAD design is easily modified. C. A wide range of 3D printers and plastics were surveyed to maximize resolution and minimize autofluorescence. The red asterisk indicates our final choice of material: Formlab’s Black resin. Autofluorescence of the current design is 1/2 the autofluorescence of black Delrin, one material used for machined microscope designs. D. Photograph of the microscope produced on a consumer grade 3D printer (Form 2), with inset showing the 3D printed focussing threads with a pitch of 0.34 mm.
Figure 2
Figure 2. Performance of closed loop feedback based on near real-time audio or image processing using custom software and GUI
A. Image of user interface of acquisition software written in Swift for macOS. The software allows for low-latency ROI tracking and microscope control. It also interfaces with a microcontroller with 54 digital I/O pins, 16 8-bit analog inputs and an ADC with two tightly synchronized 16-bit 48 kHz analog inputs (typically for audio). B. Example of feedback contingent on features of the audio input: white noise is triggered at a specific syllable of song. White dotted lines mark a single motif of song, blue indicates the target syllable. Top: a ‘catch’ trial, where no feedback was delivered. Middle: a ‘hit’ trial, where a 50ms white noise pulse was delivered. Bottom: spectral density image of all song aligned trials (including hit and catch trials), demonstrating the reliability of the white noise pulse. C. Example of feedback contingent on ROI tracking. Black: voltage driving an LED light flash that is recorded in the field of the CMOS; blue: the cumulative probability density function (CDF) of a brief TTL pulse triggered by the software in response to the LED flash processed through the entire acquisition system. Event detection was based on ROI analysis on a Mac Mini computer. Latency of the full loop from camera to Arduino based TTL output is approximately 23.9 ms ± 7.9 ms (95% confidence interval), with the jitter comparable to the frame rate of the camera. In this test, the LED was not synchronized to the onset of the frame, as would be the case for spontaneous video recording of neural activity. This represents the experimentally relevant performance of the system, intrinsically limited by the 33 ms frame rate of the camera. D. Of the total latency, image processing to extract fluorescence from ten cell-sized regions of interest contributes an average of only 0.17 ms; much of the ROI feedback latency is a reflection of the frame rate and acquisition time. E. Latency of auditory-based feedback, where a TTL pulse followed detections of a specific syllable structure (shown in B), had a latency of 12 ms ± 6 ms.
Figure 3
Figure 3. Wireless microscope acquisition system and performance
Signals from the camera can be relayed with an off-the-shelf wireless transmitter. A. Diagram of the system, mounted on a songbird. The microscope LED, CMOS and transmitter together draw approximately 100 mAh, at the typical input voltage of 3.5 v and the typical in-vivo imaging LED brightness. B. The wireless acquisition system uses a wireless receiver, frame-grabber and digitizer to acquire synchronized video and two channels of 48 kHz audio. C. Image of wireless transmitter and 50 mAh battery. D. Comparison of pixel noise in the wired and wireless conditions (see methods 2.8.3). E. Histogram of per-frame PSNR values of the wireless condition, as compared to the wired condition (at 3 meters). F. Variance of the mean pixel value, over 100 continuously recorded frames (per distance). High variance indicates signal degradation due to transmission loss or interference. Over distances relevant for typical neuroscience applications in an indoor laboratory setting, these transmitters are subject to minimal signal degradation.
Figure 4
Figure 4. 3D printed active commutator system for chronic neural recording in small animals
A. Schematic of the 3D printed commutator. B. An image of an assembled commutator. C. These devices use the deflection of the magnetic field of a disk magnet located on a flex PCB cable to detect torque via a hall sensor. A feedback circuit mediated by a microcontroller corrects the deflection by rotating a slip ring via a servo-driven gearbox with a 1:1 ratio. D. Example of two different flex cables designs with 7–9 conductors, weighing under 0.25 grams. The additional wires are present for electrical/optical stimulation or other head-mounted accessories. Scale bar indicates 9 mm.
Figure 5
Figure 5. Images and in-vivo video collected from the microscope
A. Image taken by microscope of a High-Frequency NBS 1963A Resolution Test Target, showing 228 lines per mm. B. In-vivo widefield image of blood vessels over premotor area HVC in a zebra finch. C. Maximum intensity projection of ΔF/F 0 video from a bout of singing. Imaging depth is 150–200 μm below the surface of intact dura. D. Time-intensity plot, where each pixel is colored by its center of mass in time. E. Stereotyped single neuron calcium traces recorded in singing birds using GCaMP6, aligned to song. Top: spectrogram of a single song rendition; bottom: calcium traces from 18 ROIs over 50 song-aligned trials from a single bird. Vertical scale bar indicates standard deviation.

References

    1. Andalman AS, Fee MS. A basal ganglia-forebrain circuit in the songbird biases motor output to avoid vocal errors. Proceedings of the National Academy of Sciences of the United States of America. 2009;106(30):12518–12523. - PMC - PubMed
    1. Barbera G, et al. Spatially Compact Neural Clusters in the Dorsal Striatum Encode Locomotion Relevant Information. Neuron. 2016;92(1):202–213. - PMC - PubMed
    1. Pearre Ben, Perkins Nathan, Markowitz Jeff, Gardner Timothy. A Fast and Accurate Zebra Finch Syllable Detector. PloS one 2016 - PMC - PubMed
    1. Betley JN, et al. Neurons for hunger and thirst transmit a negative-valence teaching signal. Nature. 2015;521(7551):180–185. - PMC - PubMed
    1. Cai DJ, et al. A shared neural ensemble links distinct contextual memories encoded close in time. Nature. 2016;534(7605):115–118. - PMC - PubMed

Publication types

MeSH terms

LinkOut - more resources