. 2017 May 25;545(7655):439-445.
doi: 10.1038/nature22326. Epub 2017 May 17.

Conversion of adult endothelium to immunocompetent haematopoietic stem cells

Affiliations

Conversion of adult endothelium to immunocompetent haematopoietic stem cells

Raphael Lis et al. Nature. .

Abstract

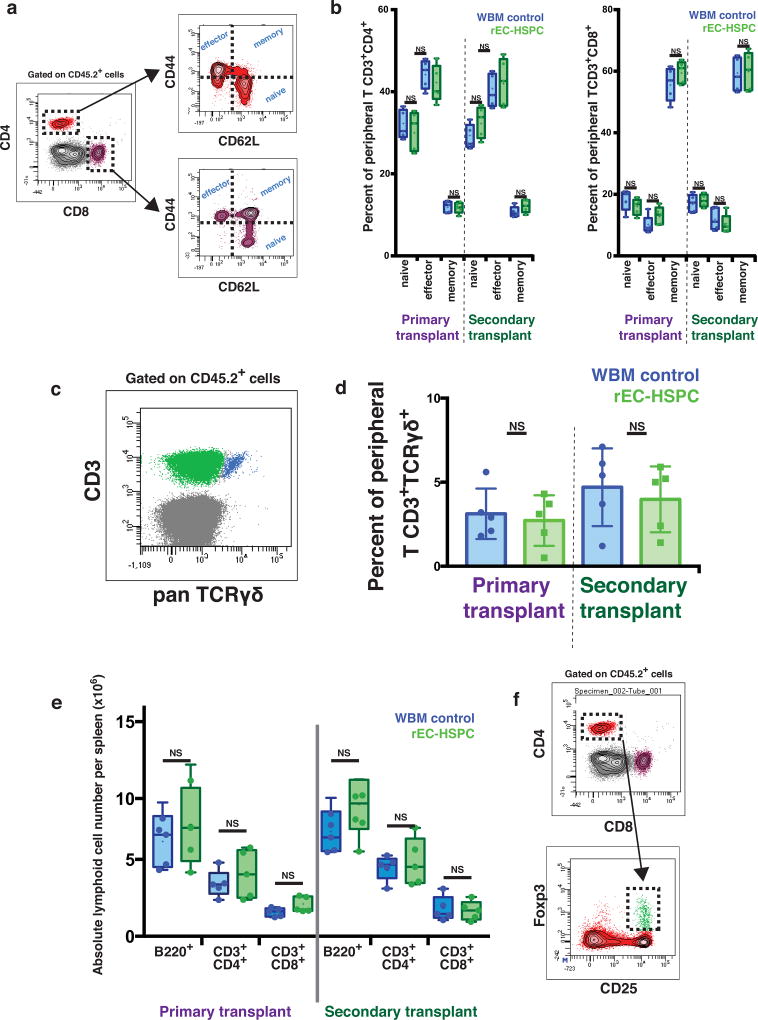
Developmental pathways that orchestrate the fleeting transition of endothelial cells into haematopoietic stem cells remain undefined. Here we demonstrate a tractable approach for fully reprogramming adult mouse endothelial cells to haematopoietic stem cells (rEC-HSCs) through transient expression of the transcription-factor-encoding genes Fosb, Gfi1, Runx1, and Spi1 (collectively denoted hereafter as FGRS) and vascular-niche-derived angiocrine factors. The induction phase (days 0-8) of conversion is initiated by expression of FGRS in mature endothelial cells, which results in endogenous Runx1 expression. During the specification phase (days 8-20), RUNX1+ FGRS-transduced endothelial cells commit to a haematopoietic fate, yielding rEC-HSCs that no longer require FGRS expression. The vascular niche drives a robust self-renewal and expansion phase of rEC-HSCs (days 20-28). rEC-HSCs have a transcriptome and long-term self-renewal capacity similar to those of adult haematopoietic stem cells, and can be used for clonal engraftment and serial primary and secondary multi-lineage reconstitution, including antigen-dependent adaptive immune function. Inhibition of TGFβ and CXCR7 or activation of BMP and CXCR4 signalling enhanced generation of rEC-HSCs. Pluripotency-independent conversion of endothelial cells into autologous authentic engraftable haematopoietic stem cells could aid treatment of haematological disorders.


Figures

Extended Data Figure 1
Extended Data Figure 1. Phenotypic and quality control characterization of the rEC-HSPCs
a, 8.0 × 10⁵ freshly isolated adult mouse lung CD45.2+ endothelial cells, depleted of lymphatic endothelial cells or contaminating haematopoietic cells were purified and injected in lethally irradiated CD45.1+ recipients, graph indicates donor contribution to peripheral blood at indicated time points after transplant. Data represents independent transplantations, n = 5. b, Wild-type normal LT-HSCs (CD45.2+ LKS-SLAM cells) were sorted, transduced with Fgrs transgenes and expanded in endothelial cell growth medium containing FGF-2, serum and TGF-β inhibitor, without haematopoietic growth factors. Expanded Fgrs-transduced LT-HSCs were then plated in co-culture with VN-ECs and Fgrs were turned on (dox-on) for 28 days and then transplanted into lethally irradiated CD45.1+ recipients. Graphs represent peripheral blood contribution 16 weeks after transplantation. Data represents independent transplantations, n = 3. c, qRT–PCR showing expression of Fgrs in mECs upon doxycycline addition. All four factors were absent when adult mECs were not exposed to doxycycline, or exposed to doxycycline without rtTA. Data represents mean ± s.d, n = 3. d, Time-course of CD45+ cell formation during the stage-specific conversion process. e, Time-course analysis of linc-Kit+Sca-1+ (LKS) converted cells. f, Diff-Quik stain of cells from day 28 in vitro cultures (original magnification, ×60, bar = 50µm). g, Absolute quantification of LKS cells present whether in the fraction adherent to VN-ECs or in supernatant. Representative pictures of rEC-HSPC adherent fraction with prototypical ‘cobblestone’ structures is shown on the left-hand side, n = 3 independent reprogramming experiments. Data represents mean ± s.e.m., n = 3, individual data points are represented. h, Fgrs-transduced endothelial cells were grown onto VN-ECs, OP9-DLL11, or in feeder free condition. Graph indicates absolute quantification (cell number) of CD45+ rEC-HSPC. Data represent mean ± s.e.m. (n = 5 for conversion experiments run in technical triplicates for each conditions); two-tailed unpaired t-test. i, Fgrs-transduced OP9 were grown onto VN-ECs, OP9-DLL11, or in feeder-free condition. Graph indicates absolute quantification (cell number) of CD45+ rEC-HSPCs (n = 5). Data represent mean ± s.e.m. (n = 5 conversion experiment run in technical triplicates for each conditions); two-tailed unpaired t-test.
Extended Data Figure 2
Extended Data Figure 2. rEC-HSPCs are composed of rEC-HSCs that have the potential for primary and secondary engraftment and regenerative haematopoiesis self-renewal
a, Kaplan–Meier curve showing percentage survival over 16 weeks of lethally irradiated mice transplanted with either 8.0 × 10⁵ cells (purified CD45+ rEC-HSPCs, green line (n = 20); non-converted lung endothelial cells, blue line (n = 10) or PBS (n = 15) mice). b, Representative plots of rEC-HSPC lineage contribution. c, Donor reconstitution of mice transplanted with CD45+ rEC-HSPCs at indicated time points after primary transplantation. Data represents individual data points (n = 20). d, Representative plots of donor contribution to LKS-SLAM cells. e, Donor reconstitution of mice transplanted with WBM from chimaeric WBM control mice or WBM from chimaeric rEC-HSPC primary transplanted mouse at indicated time points after transplantation. Data represents individual data points, n = 15, 4 independent reprogramming experiments. f, Schematic representation of haematopoietic recovery following sub-lethal irradiation assay. g, Analysis of white blood cell recovery of rEC-HSPC-engrafted versus control mice following sub-lethal irradiation (500 cGy) (n = 5 for duration of analysis). Data represent mean ± s.e.m., no significant differences were found using two-tailed unpaired t-test. h, Multi-lineage analyses during bone marrow recovery. Myeloid and lymphoid regeneration, including T cells, and CD3+CD8+ T cytotoxic cells at baseline and 28 days post sub-lethal irradiation (500 cGy). Data represent individual data points; black bar represents mean (n=5).
Extended Data Figure 3
Extended Data Figure 3. Peripheral and splenic rEC-HSPC-derived T-cell phenotyping
a, Gating strategy to phenotype naïve, effector and memory T-cells from peripheral blood of transplanted mice. b, Boxplot showing the absolute number of B220+, CD3+CD4+, and CD3+CD8+ cells following long-term primary or secondary transplant. WBM control samples are denoted in blue, rEC-HSPC in green Boxplot and whiskers represent median, 25th and 75th percentile, mean is represented by + sign. (n = 5); two-tailed unpaired t-test. c, Gating strategy to phenotype Tγδ cells from peripheral blood of transplanted mice. d, Boxplot showing the averaged frequency of naïve, effector and memory T-cells for both CD3+CD4+ and CD3+CD8+, following long-term primary or secondary transplant. WBM control samples are denoted in blue, rEC-HSPC in green. Data represent mean±s.e.m.(n=5). P values, two-tailed unpaired t-test. e, Boxplot showing the averaged frequency of γδ T cells following long-term primary or secondary transplant. Data represent mean ± s.e.m. (n = 5); two-tailed unpaired t-test. f, Phenotype of regulatory T cells (Treg) by flow cytometry.
Extended Data Figure 4
Extended Data Figure 4. Endothelial to haematopoietic conversion capture by live microscopy
(See also Supplementary Video 1.) a, Schema detailing the experimental setting for live confocal image capture. Adult lung endothelial cells were isolated from Runx1-IRES-GFP. Then, Runx1-IRES-GFP adult lung endothelial cells were transduced with Fgrs and co-cultured with VN-ECs (HUVEC-E4ORF1). VN-ECs were differentiated from Fgrs-transduced Runx1-IRES-GFP adult lung endothelial cells by anti-human CD31 live staining (red). Live confocal images were acquired every 45 min for the duration of the experiment (see also Supplementary Video 1). b, Representative flow cytometry plots of day 10 (d10) showing that a subset of VEcad+CD45 and VEcad+CD45+ cells also co-express Runx1-GFP. c, Single time points from live confocal image capture. Upon doxycycline-dependent conditional expression of Fgrs, flat spindle-shaped adult mouse endothelial cells rapidly transition from RUNX1 to round haematopoietic-like RUNX1+ cells (day 0–8, white arrow). This induction phase is characterized by the transitioning endothelial cells towards haematopoietic fate. From day 8 to 20 of specification phase, RUNX1+ cells further moved towards a haematopoietic identity by assuming a prototypical fully formed round shape (white arrow). Following the emergence of this definite haematopoietic program, a phase of robust expansion on the vascular niche layers (VN-ECs) of these RUNX1+ committed converted cells from day 20 to 28 (expansion phase).
Extended Data Figure 5
Extended Data Figure 5. Quantification of rEC-HSCs arising from single-cell reprogramming
a, Haematopoietic cluster arising from single-cell reprograming. at specified time point. Wells were considered negative if no hematopoietic clusters were visible 36 days after single RUNX1+ endothelial cell inoculation. Representative wells considered as positive or negative are shown. Cloning of RUNX1+ mECs resulted in 22±11 clusters per 1000 RUNX1+ mECs sorted b, Long-term peripheral blood contribution of each reprogrammed day 8 RUNX1+ endothelial cells. Data represent individual data points for each clones (n = 7) c, Limiting-dilution transplantation (LDT) assay showing the frequency of LT-HSCs in expanded clonal conversion experiments. CRU cells were determined using Poisson statistics by ELDA software. d, Viral integration mapping. PCR against LTR-B1 repeated sequence was run in each indicated populations. PCR assays were analysed on 4% TBE gel.
Extended Data Figure 6
Extended Data Figure 6. Molecular profiling of rEC-HSPCs and rEC-HSCs
a, Supervised principal component analysis of global gene expression data of rEC-HSPCs and rEC-HSCs and the indicated control cell types. Data for individual cells of given is indicated. Each shape represents independent replicate for the indicated cell types (embryonic day 11 (E11.0) aorta-gonad-mesonephros endothelium, E11.0 CD201 pre-HSC type 1, E11.0 CD201+ pre-HSC type 1, E11.0 CD201+ pre-HSC type 2, E12.5 fetal liver HSCs (linSca-1+Mac1loCD201+), E14.5 fetal liver HSCs (linCD45+CD150+CD48CD201), adult bone marrow HSC (LKS-SLAM), ‘sc-’ refers to the single-cell RNA-seq data set adapted from ; adult lung endothelial cells, in vitro rEC-LKS, in vivo rEC-LKS-SLAM, control adult in vivo LKS-SLAM cells). b. Supervised clustering of canonical endothelial genes expression profiles of freshly isolated lung endothelial cells (n = 3), embryonic stem cell (ES)-derived endothelial cell (n = 2), embryonic stem cells (n = 1); rEC-LKS-SLAM cells isolated from transplanted mice (n = 3), (n = 3, n = 4 from Kinkel et al , day 28 in vitro rEC-LKS (n = 3), data points obtained from clonal reprogramming are denoted by an asterisk. c, Supervised clustering of prototypical haematopoietic genes expression, demonstrates that haematopoietic genes are induced during Fgrs-mediated reprograming of endothelial cells into rEC-HSPCs and rEC-HSCs. d, Supervised clustering of prototypical pluripotency genes expression, demonstrates that pluripotency genes are not induced during Fgrs-mediated reprograming of endothelial cells into rEC-HSPCs and rEC-HSCs. e, Dendrogram showing unsupervised hierarchical clustering of global gene expression data of representative control cells (Ctl), and all rEC-HSCs, rEC-HSPCs, and their progenies. Dendrogram branches are colour-coded per cell types indicated in the legend.
Extended Data Figure 7
Extended Data Figure 7. Immune function assessment and molecular profiling of TCR diversity of rEC-HSC-derived T cells
a, CFSE dilution and intracellular interferon-γ (IFN-γ) production upon CD45.2+ CD3/CD28 polyclonal activation and/or Treg addition. Representative flow cytometry plots. b, Quantification of intracellular IFN-γ production upon CD3/CD28 polyclonal activation and/or Treg addition. Data represents mean ± s.e.m. (n = 5 independent experiment, 3 technical replicates); two-tailed unpaired t-test. c, Normalized counts for CD3+CD4+ cells. WBM control samples are denoted in blue, rEC-HSPC in green. d, Normalized counts for CD3+CD8+. WBM control samples are denoted in blue, rEC-HSPC in green. e, Normalized counts for Jurkat cell samples. f, Analysis of TCR repertoire in Rag1−/− rEC-HSPC reconstituted mice upon chicken ovalbumin vaccination.
Extended Data Figure 8
Extended Data Figure 8. Molecular deconvolution of vascular-niche-derived angiocrine factors during stepwise differentiation of endothelial cells into rEC-HSPCs and rEC-HSCs
a, Adult lung mECs (VEcad+CD31+CD45) were isolated from Runx1-IRES-GFP mice. Human-derived VN-ECs were discriminated from Fgrs-transduced Runx1-IRES-GFP adult lung endothelial cells by anti-human CD31 (hCD31). Fgrs-transduced Runx1-IRES-GFP endothelial cells and their progeny were gated as hCD31. Flow cytometry plots showing the expression of VEcad and CD45 in mouse hCD31 Fgrs-transduced endothelial cells and derivatives over the course of endothelial to haematopoietic cell reprogramming. b, Quantification of mouse hCD31 Fgrs-transduced endothelial cells and their derivatives over the course of reprogramming. Data represents mean ± s.e.m. (n = 5). c, Colony number arising in methylcellulose from Fgrs-transduced endothelial cells and derivatives (gated on human hCD31 to exclude VN-EC feeder). n = 4 independent experiments are shown and each condition performed in triplicate. Data represents mean ± s.e.m. (n = 5); two-tailed unpaired t-test. d, Adult mouse endothelial cells were treated with different small molecules at their known IC50 (CXCR4 antagonist, AMD3100, 44 µmol l−1; CXCR7 agonist, TC14012, 350 nmol l−1; BMP antagonist, Noggin, 0.5 µg ml−1; TGF-β antagonist, SB431542, 10 µmol l−1). Representative flow cytometry plots of apoptosis assays are presented. e, Quantification of apoptotic cells following treatment with each small molecule tested. Data represents mean ± s.e.m. (n = 3); two-tailed unpaired t-test. f, Quantification of hCD31 Fgrs-transduced endothelial cells and their derivatives over the course of reprogramming in presence of CXCR4 inhibitors (AMD3100, AMD3100, 44 µmol l−1), CXCR7 agonists (TC14012, 350 nmol l−1), BMP inhibitor (Noggin, 0.5 µg ml−1), TGF-β/ALK5 inhibitor (SB431542, 10 µmol l−1). Data represents mean ± s.e.m. (n = 5); two-tailed unpaired t-test. g, Quantification of hCD31 Fgrs-transduced endothelial cells and their derivatives over the course of reprogramming in presence of VN-ECs (HUVEC-E4ORF1) overexpressing mouse CXCL12 (n = 5 independent experiments, 3 technical triplicates each). Data represents mean ± s.e.m.; two-tailed unpaired t-test.
Extended Data Figure 9
Extended Data Figure 9. Organ-specific adult endothelial cells are amenable to hierarchical Fgrs-mediated reprogramming to rEC-HSPCs
a, Left, Fgrs-transduced liver endothelial cells were directly co-cultured with VN-ECs. Graph indicates absolute quantification (cell number) of CD45+ rEC-HSPC (n = 3 independent biological replicates, 3 technical replicates each). Right, Quantification of phenotypically marked CD45+ LKS cells at day 28 of reprogramming absolute cell number is reported. Data represents mean ± s.e.m. b, Left, Fgrs-transduced lung endothelial cells were directly co-cultured with VN-ECs. Graph indicates absolute quantification (cell number) of CD45+ rEC-HSPC Right, Quantification of phenotypically marked CD45+ LKS cells at day 28 of reprogramming absolute cell number is reported. Data represents mean ± s.e.m. (n = 3 independent biological replicates, 3 technical replicates each). c, Left, Fgrs-transduced brain endothelial cells were directly co-cultured with VN-ECs. Graph indicates absolute quantification (cell number) of CD45+ rEC-HSPC (n = 3 independent biological replicates, 3 technical replicates each). Right, Quantification of phenotypically marked CD45+ LKS cells at day 28 of reprogramming absolute cell number is reported. Data represents mean ± s.e.m. d, Left, Fgrs-transduced kidney endothelial cells were directly co-cultured with monolayers of confluent VN-ECs. Graph indicates absolute quantification (cell number) of CD45+ rEC-HSPCs. Right, Quantification of phenotypically marked CD45+ LKS cells at day 28 of reprogramming absolute cell number is reported. Data represents mean ± s.e.m. (n = 3 independent biological replicates, 3 technical replicates each). e, rEC-HSPC-derived cells were purified and co-culture on VN-ECs in presence of doxycycline for 28 days. Cells were transplanted into lethally CD45.1+ irradiated recipients in absence of doxycycline. Data represents individual data points for donor contribution to peripheral blood at indicated time point after transplant (n = 3 biological replicates). f, Experimental model for hierarchical differentiation of endothelial cells into rEC-HSPCs. D8 VEcad+RUNX1+CD45 cells were purified by flow cytometry and replated on inductive vascular niche in presence or absence of doxycycline. Subsequently, at day 15 VEcad+RUNX1+CD45 cells haemogenic-like cells were purified by flow cytometry and replated on the inductive vascular niche in presence (Dox-on) or absence (Dox-off) of dox. g, Flow cytometry quantification of cell subsets during stepwise conversion in f. Data represents individual data points (n = 3 independent biological replicates, 3 technical replicates each).
Extended Data Figure 10
Extended Data Figure 10. Analyses of the rEC-HSPC- and rEC-HSC-engrafted organs for malignant transformation
Although none of the recipient mice engrafted with rEC-HSPCs manifested any anatomical or symptomatic evidence of leukaemia, lymphoma or myeloproliferative neoplasm (MPN) (that is, lymphadenopathy, organomegaly, illness or haemorrhage), we analysed recipient organ architecture and histological profile after 20 weeks of primary, or secondary transplantation for any evidence of malignant alterations. For each organ, including bone marrow, lung, kidney, spleen, liver, intestine and brain, Wright-Giemsa (left), Masson (middle) and PicroSirius Red (right) staining is shown at 2 different magnifications (10×, upper panel; 40× lower panel; scale bars, 10 µm, 40 µm). We did not observe any evidence of aberrant infiltration of haematopoietic cells, aberrant inflammatory response, chloromas, or alteration of the geometry of any organs of the primary or secondary transplanted mice. Furthermore, microscopic architecture of bone marrow, spleen and liver was normal and without fibrotic remodelling or abnormal deposition of collagen or desmin. All images were acquired using a colour CCD camera. n = 3 independent primary or secondary transplant experiments. Representative experiments are shown.
Figure 1
Figure 1. Conditional expression of Fgrs in adult mECs generates haematopoietic cells
a, Schema showing conversion of 2.5×10⁵ adult mECs into HSPCs. b, Emergence of CD45+ cells in the vicinity of VN-ECs (HUVEC-E4ORF1). Representative pictures (10×). c, Left, Fgrs-ECs grown on VN-ECs, OP9-DLL11, or in feeder-free condition. Right, Fgrs-transduced OP9 cells were grown on VN-ECs, OP9-DLL11 (transduced with E4ORF1), or feeder-free. Data represent mean ± s.e.m. (n = 5 conversion experiments run in technical triplicates for each condition); two-tailed unpaired t-test. d, Quantification of CD45+ LKS cells during conversion (left) and absolute cell number (right). VN-ECs were excluded by gating on human CD31 negative (hCD31) population. Data represent mean ± s.e.m. (n = 5 conversion experiments run in technical triplicates for each condition); two-tailed unpaired t-test. e, CD45+ cells were sorted at day 23 and seeded in methylcellulose (no-dox); colonies were analysed 7 days later. Graphs show the quantification of the number of colonies per 2,500 cells plated (n = 5 conversion experiments run in technical triplicates for each condition); two-tailed unpaired t-test.
Figure 2
Figure 2. Conditional Fgrs expression supports long-term primary and secondary HSPC engraftment
a, Transplantation schema. b, Lineage contribution to Gr1+CD11b+ and Gr1CD11b+ myeloid cells, B220+ B cells, CD3+CD4+ T cells, and CD3+CD8+ T cells at week 20 after primary transplant in the peripheral blood of WBM control transplant recipients (blue circles) or rEC-HSPC recipients (green circles), Boxplot and whiskers represent median, 25th and 75th percentile, mean is represented by + sign (n = 4 independent conversion experiments run in technical triplicates for each condition); two-tailed unpaired t-test. c, Lineage contribution to Gr1+CD11b+ and Gr1CD11b+ myeloid cells, B220+ B cells, CD3+CD4+ T cells, and CD3+CD8+ T cells at week 20 after secondary transplant in the peripheral blood of WBM control transplant (blue circles) or rEC-HSPC (green circles), Boxplot and whiskers represent median, 25th and 75th percentile, mean is represented by + sign (n = 4 independent conversion experiment run in technical triplicates for each conditions); two-tailed unpaired t-test. d, Relative representation of LKS and LKS-SLAM cells at week 20 after primary transplant for WBM transplant recipients (blue circles) or rEC-HSPC recipients (green circles). e, Relative representation of LKS and LKS-SLAM cells at week 20 after secondary transplant for WBM transplant recipients (blue circles) or rEC-HSPC recipients (green circles). Boxplot and whiskers represent median, 25th and 75th percentile, mean is represented by + sign (n = 4 independent conversion experiment run in technical triplicates for each conditions); two-tailed unpaired t-test
Figure 3
Figure 3. Clonal and limiting-dilution quantification of rEC-HSPCs and rEC-HSCs
a, Schema showing rEC-HSC quantification strategy. Fgrs-ECs isolated from CD45.2+ Runx1-IRES-GFP mice were subjected to isochronic haematopoietic conversion. By day 8, one half of the Fgrs-ECs underwent single-cell cloning on the basis of Runx1-GFP+ expression (VEcad+RUNX1+CD45) and co-cultured with VN-ECs. Haematopoietic clusters arising from single RUNX1+ endothelial cells were transplanted into lethally irradiated CD45.1+ recipients. The other isochronic half of the cell fraction was expanded on VN-ECs until day 28 and transplanted in a limiting-dilution translation (LDT) into lethally irradiated CD45.1+ recipients. b, Reconstitution of the indicated peripheral blood cell lineages of individual recipients showing >1% donor chimaerism are presented as the percentage of donor clones, data represent mean ± s.e.m (n = 7 independent transplants). c, LDT assay to determine the frequency of LT-HSCs in each expanded rEC-HPSC clone. Averaged CRU per cells were determined using Poisson statistics (ELDA software). Boxplot and whiskers represent median, 25th and 75th percentile, mean is represented by + sign (n = 4 independent conversion experiment run in technical triplicates for each conditions); two-tailed unpaired t-test (n = 7 independent LDT analysis). d, LDT showing LT-HSC frequency by day 28 rEC-HSCs. CRU of 1 in 557 was determined using Poisson statistics (ELDA software) (n = 3 independent LDT experiments).
Figure 4
Figure 4. Gene expression profiling of rEC-HSPCs and rEC-HSCs
Principal Component Analysis (PCA) of the transcriptome-wide RNA-Seq expression profiles was performed. A 3D-PCA plot, representing ~85.0% of the total variation within the expression dataset, was generated to visualize the clustering of the reprogrammed hematopoietic sample groups in relation to their native counterparts. Three dimensional MDS plots (3D-MDS) were generated based on all pairwise distances between the global transcriptome-wide RNA-seq profiles of the samples shown here. Distances were defined as one minus the Pearson correlation between two profiles. Multidimensional scaling (MDS) was used to identify the set of points in 3D space, such that the distances between the points are equal to the true distances between samples.
Figure 5
Figure 5. Reconstitution of T-cell immunity in mice engrafted with Rag1−/− rECs
a, Transplantation schema of chimaeric rEC-HSPC or WBM control into CD45.1+Rag1−/− mice. b, Schema and time-lapse of redirected lysis assay. c, Viable target percentage at different ratios of effector (CD8+) to target (allogeneic Balb/C, CD45+) cells. Data represent mean ± s.e.m. (n = 5 independent experiments in 3 technical replicates); two-tailed unpaired t-test. d, Heat map of normalized counts (log counts per million reads) for each TCR β variable gene for CD4+ T cell, CD8+ T cell, and Jurkat cell samples. e, Boxplot of Shannon index clonality of normalized TCR β variable gene counts (per million reads) across WBM and rEC-HSPC samples as CD4+ T cells, CD8+ T cells or Jurkat cells (control sample). Data represents mean ± s.d. (n = 3); Wilcoxon rank t-test. f, Quantification OVA-MHC multimers (n = 4). Boxplot and whiskers represent median, 25th and 75th percentile, mean is represented by + sign (n = 5); two-tailed unpaired t-test.
Figure 6
Figure 6. Deconvolution of vascular niche angiocrine signals in rEC-HSPC generation
a, Quantification of Runx1-IRES-GFP Fgrs-ECs Cxcr4fl/fl or Cxcr4−/− and their derivatives during reprogramming. Data represent mean ± s.e.m. (n = 4); two-tailed unpaired t-test. b, Schematic representation of angiocrine pathways involved in conversion of adult endothelial cells into HSPCs.

Comment in

  • Blood: Education for stem cells.
    Guibentif C, Göttgens B. Guibentif C, et al. Nature. 2017 May 25;545(7655):415-417. doi: 10.1038/nature22496. Epub 2017 May 17. Nature. 2017. PMID: 28514445 No abstract available.

References

    1. Wahlster L, Daley GQ. Progress towards generation of human haematopoietic stem cells. Nat. Cell Biol. 2016;18:1111–1117. - PubMed
    1. Sturgeon CM, Ditadi A, Clarke RL, Keller G. Defining the path to hematopoietic stem cells. Nat. Biotechnol. 2013;31:416–418. - PubMed
    1. Tashiro K, et al. Promotion of hematopoietic differentiation from mouse induced pluripotent stem cells by transient HoxB4 transduction. Stem Cell Res. 2012;8:300–311. - PubMed
    1. Rafii S, et al. Human ESC-derived hemogenic endothelial cells undergo distinct waves of endothelial to hematopoietic transition. Blood. 2013;121:770–780. - PubMed
    1. Batta K, Florkowska M, Kouskoff V, Lacaud G. Direct reprogramming of murine fibroblasts to hematopoietic progenitor cells. Cell Reports. 2014;9:1871–1884. - PMC - PubMed

Publication types

MeSH terms