. 2017 May 25;545(7655):495-499.
doi: 10.1038/nature22396. Epub 2017 May 17.

PD-1 expression by tumour-associated macrophages inhibits phagocytosis and tumour immunity

Affiliations

PD-1 expression by tumour-associated macrophages inhibits phagocytosis and tumour immunity

Sydney R Gordon et al. Nature. .

Abstract

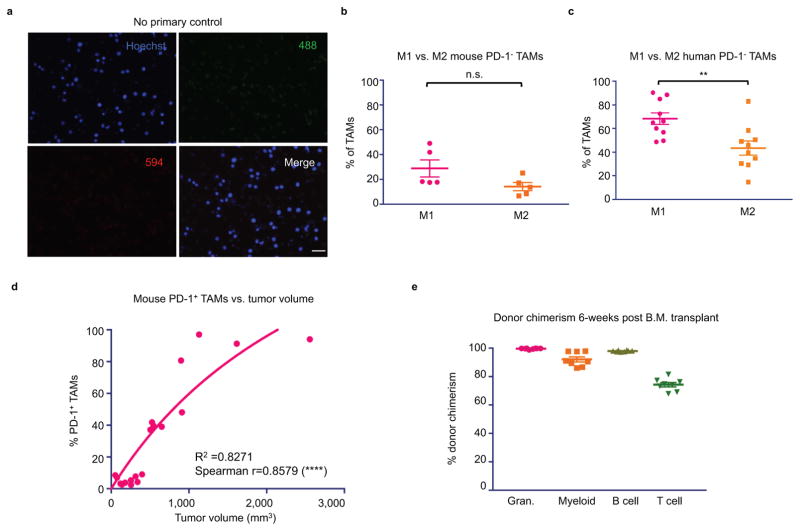
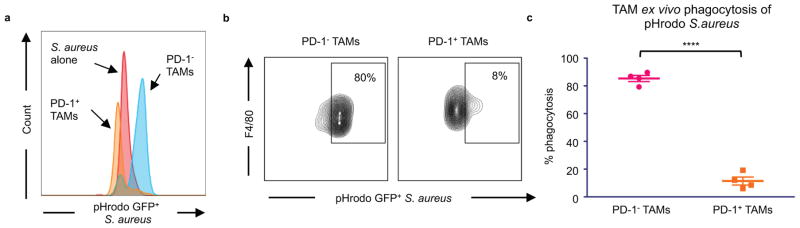
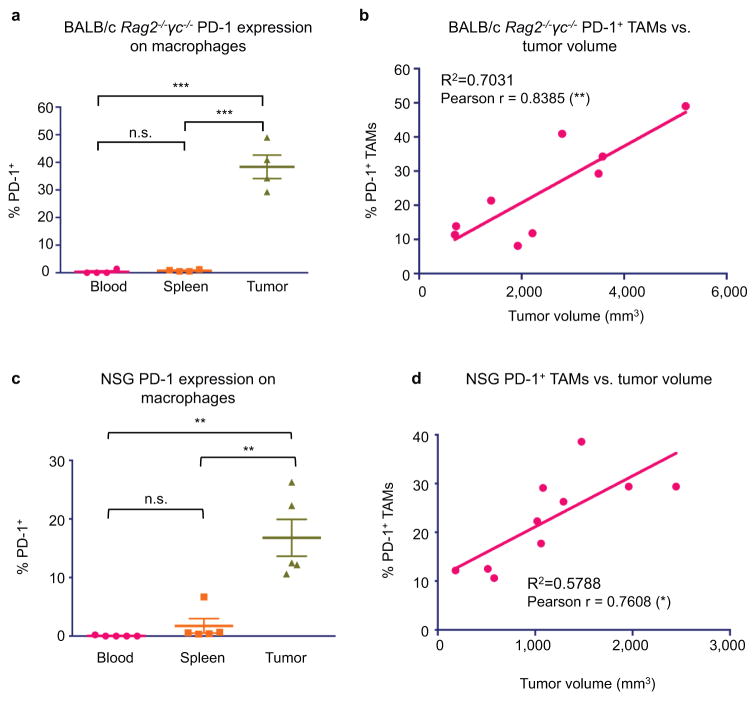
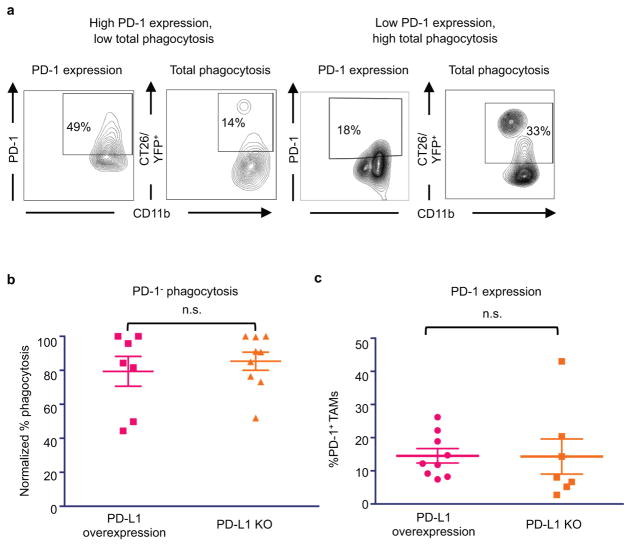
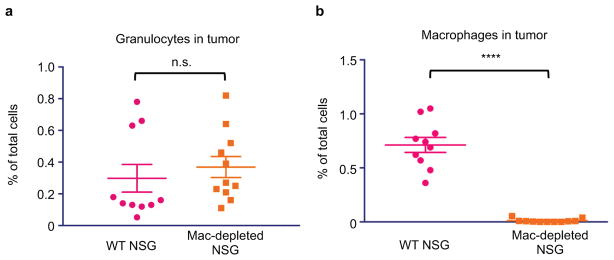
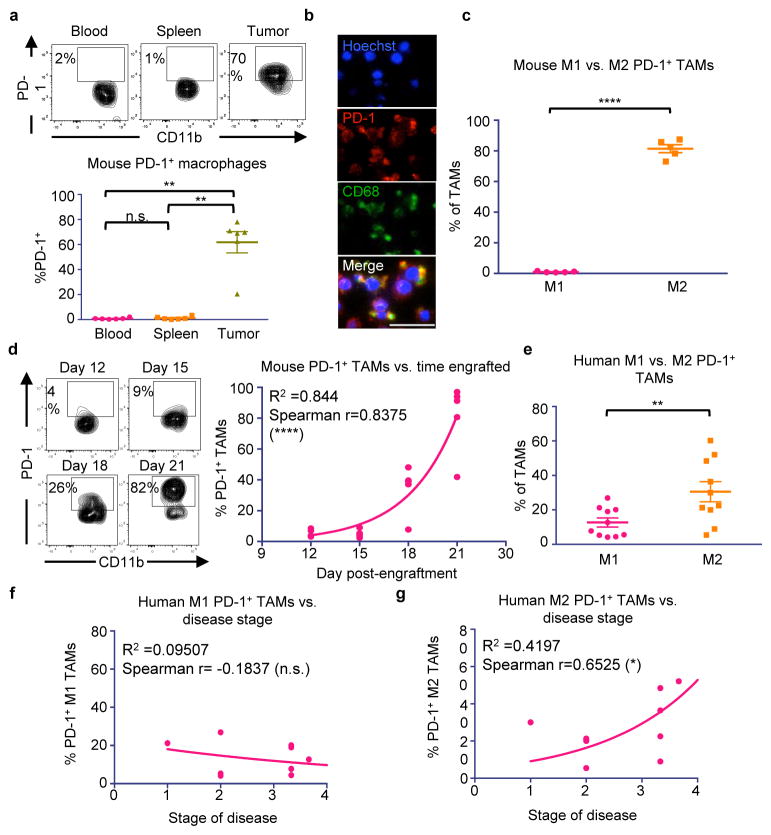
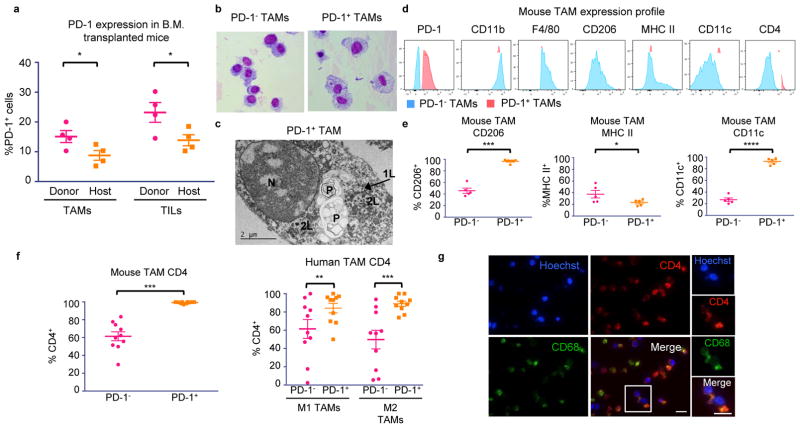
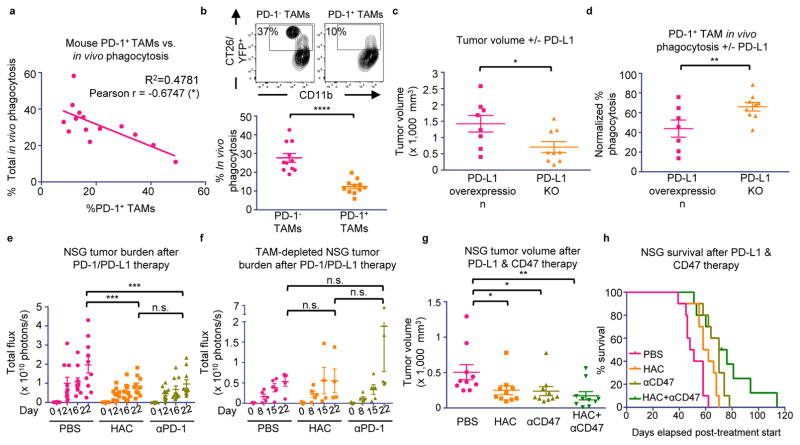
Programmed cell death protein 1 (PD-1) is an immune checkpoint receptor that is upregulated on activated T cells for the induction of immune tolerance. Tumour cells frequently overexpress the ligand for PD-1, programmed cell death ligand 1 (PD-L1), facilitating their escape from the immune system. Monoclonal antibodies that block the interaction between PD-1 and PD-L1, by binding to either the ligand or receptor, have shown notable clinical efficacy in patients with a variety of cancers, including melanoma, colorectal cancer, non-small-cell lung cancer and Hodgkin's lymphoma. Although it is well established that PD-1-PD-L1 blockade activates T cells, little is known about the role that this pathway may have in tumour-associated macrophages (TAMs). Here we show that both mouse and human TAMs express PD-1. TAM PD-1 expression increases over time in mouse models of cancer and with increasing disease stage in primary human cancers. TAM PD-1 expression correlates negatively with phagocytic potency against tumour cells, and blockade of PD-1-PD-L1 in vivo increases macrophage phagocytosis, reduces tumour growth and lengthens the survival of mice in mouse models of cancer in a macrophage-dependent fashion. This suggests that PD-1-PD-L1 therapies may also function through a direct effect on macrophages, with substantial implications for the treatment of cancer with these agents.


Figures

Extended Data Figure 1
Extended Data Figure 1. FACS gating strategy for TAMs
Debris and doublets were removed, then TAMs were assessed as DAPICD45+CD8aCD19Ter119TCRβCD11b+F4/80+. TAM PD-1 gating is shown as well, based on PD-1 isotype control. All other gates were determined from fluorescence minus one controls (FMOs). T cells, gated as DAPICD45+TCRβ+CD8a+, are shown as PD-1+ positive control.
Extended Data Figure 2
Extended Data Figure 2. TAM characterization
a. No primary control for IF images is shown. Cytospinned TAMs were stained with fluorescently-conjugated secondary only (20× magnification, Scale bar=20 μm. Red=594, Green=488, Blue=Hoechst). b. Mouse PD-1 TAMs trend towards an M1 (CD206MHCIIhigh) expression profile, rather than M2 (CD206+MHC IIlow/neg). TAMs that did not adhere to either of these expression profiles were not classified as M1 vs M2 (n=5. Paired one-tailed t-test). c. Human PD-- TAMs are predominantly M1 (CD206CD64+) rather than M2 (CD206+CD64) (n=10. Paired one-tailed t-test). d. In mice, comparing tumor volume vs. % PD-1+ TAMs shows a highly significant correlation between tumor size and PD-1 expression (n=20. Exponential growth equation is shown). e. Donor chimerism 6-weeks post B.M. transplant. [Granulocytes (Gr1high), 99%; myeloid (CD11b+), 92%; B cell (CD19+), 97%; T cell (TCRβ+), 74%.] *p<0.05; **p<0.01; ***p<0.001; ****p<0.0001; n.s., not significant. Data are mean ± s.e.m.
Extended Data Figure 3
Extended Data Figure 3. Ex vivo phagocytosis assay with FACS-sorted TAMs
Sorted PD-1 and PD-1+ TAMs from CT26 tumors were assayed with pHrodo green Staphylococcus aureus bioparticles. These particles are GFPlow at neutral pH, and GFPhigh in the acidic phagosome. a. Representative histogram showing difference in GFP fluorescence of PD-1 vs PD-1+ TAMs in phagocytosis assay, and in comparison to S. aureus bioparticles alone. Bioparticles alone are clearly GFPlow, but have an obvious upshift in fluorescence when they are phagocytosed. b. Representative histograms showing flow cytometry gating strategy for phagocytosis by PD-1 and PD-1+ TAMs. GFPhigh TAMs were considered to be phagocytosing. c. Analysis of phagocytosis shows that PD-1+ TAMs phagocytosed significantly less than PD-1 TAMS (n=4. Paired one-tailed t test). *p<0.05; **p<0.01; ***p<0.001; ****p<0.0001; n.s., not significant. Data are mean ± s.e.m.
Extended Data Figure 4
Extended Data Figure 4. Immunocompromised mice also exhibit tumor-specific expression of PD-1 on macrophages
a. Analysis of PD-L1 overexpressing CT26/YFP+ tumors in BALB/c Rag2−/−γc−/− mice shows that TAMs specifically express PD-1 (n=4. Paired one-way ANOVA with multiple comparisons correction). b. Comparing BALB/c Rag2−/−γc−/− tumor volume vs. % PD-1+ TAMs shows a highly significant correlation between tumor volume and PD-1 expression (n=9. Best fit line is shown). c. Analysis of DLD-tg(hPD-L1)-GFPluc+ tumors shows that TAMs specifically express PD-1 (n=5. Paired one-way ANOVA with multiple comparisons correction). d. Comparing NSG tumor volume vs. % PD-1+ TAMs shows a highly significant correlation between tumor volume and PD-1 expression (n=10. Best fit line is shown). *p<0.05; **p<0.01; ***p<0.001; ****p<0.0001; n.s., not significant. Data are mean ± s.e.m.
Extended Data Figure 5
Extended Data Figure 5. In vivo phagocytosis analysis
a. Representative FACS plots showing gating strategy for in vivo phagocytosis. Here, total phagocytosis was analyzed by first gating on TAMs, and then gating on YFP+ cells. Total TAM PD-1 expression from the same tumor sample is shown side by side to demonstrate that high PD-1 expression inversely correlates with phagocytosis. b. Analysis of PD-1 TAM phagocytosis shows that presence or absence of PD-L1 does not affect PD-1 TAM phagocytosis (PD-L1 overexpressing, n=7; PD-L1 KO, n=9. Paired one-tailed t test). c. TAM PD-1 expression is not affected by presence or absence of PD-L1 (PD-L1 overexpressing, n=7; PD-L1 KO, n=9. Paired one-tailed t test). *p<0.05; **p<0.01; ***p<0.001; ****p<0.0001; n.s., not significant. Data are mean ± s.e.m.
Extended Data Figure 6
Extended Data Figure 6. In vivo TAM depletion
TAMs were depleted with anti-CSF1-R treatment in NSG-Ccr2−/− mice. a. TAM depletion protocol does not affect number of granulocytes (Gr1high) in DLD-tg(PD-L1)-GFPluc+ tumors (n=10. Unpaired one-tailed t test). b. TAM depletion protocol eliminates virtually all TAMs in tumors (n=10. Unpaired one-tailed t test). *p<0.05; **p<0.01; ***p<0.001 ****p<0.0001; n.s., not significant. Data are mean ± s.e.m.
Figure 1
Figure 1. Mouse and human TAMs express high levels of PD-1
a. Representative flow cytometry plots (top) and analysis (bottom) of CT26 tumors 3 weeks post-engraftment shows tissue-specific expression of PD-1 by TAMs (n=5. Paired one-way ANOVA with multiple comparisons correction). b. IF on FACS sorted CT26 TAMs shows PD-1 and CD68 double-positive cells (n=2. Representative images shown. 20× magnification, scale bar=20 μm. Red=PD-1, Green=CD68, Blue=Hoechst). c. Mouse PD-1+ TAMs from CT26 tumors are predominantly M2 (CD206+MHC IIlow/neg) rather than M1 (CD206MHCIIhigh) (n=5. Paired one-tailed t-test). d. Representative flow cytometry plots (left) of the TAM population in CT26 tumors over time. Analysis (right) comparing day post-engraftment vs. % PD-1+ TAMs shows a correlation between time and PD-1 expression (n=20. Exponential growth equation is shown). e. Human TAMs from patient colorectal cancer samples express PD-1, and PD-1+ TAMs are predominantly M2 (CD206+CD64) and not M1 (CD206CD64+) (n=10. Paired one-tailed t-test). f. Patient disease stage vs. % PD-1+ M1 TAMs (n=10. Exponential growth equation is shown). g. Patient disease stage vs. % PD-1+ M2 TAMs (n=10. Exponential growth equation is shown). *p<0.05; **p<0.01; ***p<0.001; ****p<0.0001; n.s., not significant. Data are mean ± s.e.m.
Figure 2
Figure 2. PD-1+ TAM characterization
a. Transplant of RFP+ donor B.M. into GFP+ hosts shows that immune cells in the blood home to MC38 tumors and become PD-1+ (n=4. Paired one-tailed t-test). b. Giemsa staining of FACS sorted CT26 TAMs (n=3. Representative images shown). c. Electron microscopy on FACS sorted PD-1+ TAMs from CT26 tumors shows that these macrophages have rounded nuclei (N) with abundant heterochromatin. The cytoplasm contains primary (1L) and secondary lysosomes (2L) and two large phagosomes (P) (n=2. Representative image shown). d. Representative flow cytometry histograms showing expression of typical TAM markers in PD-1 vs. PD-1+ TAMs in CT26 tumors (n=5. Representative histograms shown). e. Analysis of TAM markers in PD-1 vs. PD-1+ subsets from CT26 tumors shows that PD-1+ TAMs express more CD206 (n=5. Paired one-tailed t-test), less MHC II, (n=5. Paired one-tailed t-test. p<0.05), and more CD11c (n=5. Paired two-tailed t-test). f. Mouse (left) and human (right) PD-1+ TAMs express higher CD4 than PD-1 TAMs (n=10. Paired two-tailed t-test). g. IF on FACS sorted TAMs from CT26 tumors confirms coexpression of CD4 and CD68 (n=2. Representative images shown. 20× magnification, scale bar=20 μm. Red=CD4, Green=CD68, Blue=Hoechst). *p<0.05; **p<0.01; ***p<0.001; ****p<0.0001; n.s., not significant. Data are mean ± s.e.m.
Figure 3
Figure 3. PD-1/PD-L1 blockade promotes anti-tumor efficacy by TAMs
a. % PD-1+ TAMs vs. total phagocytosis in PD-L1 overexpressing CT26/YFP+ tumors in BALB/c Rag2−/−γc−/− mice (n=14. Best fit line is shown). b. Representative flow cytometry plots (top) showing PD-1 vs. PD-1+ TAM phagocytosis gating. Analysis (bottom) shows a highly significant decrease in phagocytosis by PD-1+ TAMs compared to PD-1 TAMs (n=11. Paired one-tailed t-test). c. Comparison of tumor volume, CT26 PD-L1 KO tumors vs. CT26 PD-L1 overexpressing tumors in BALB/c Rag2−/−γc−/− mice (PD-L1 overexpressing, n=8; PD-L1 KO, n=9. Paired one-tailed t-test). d. PD-1+ TAMs phagocytose more in CT26 PD-L1 KO tumors than in CT26 PD-L1 overexpressing tumors (PD-L1 overexpressing, n=7; PD-L1 KO, n=9. Paired one-tailed t-test). e. Treatment of DLD-tg(PD-L1)-GFPluc+ tumors in NSG mice with either PD-1 blockade (anti-PD-1) or PD-L1 blockade (HAC protein) (n=10. Paired two-way ANOVA with multiple comparisons correction). f. TAM depletion ablates anti-tumor efficacy seen in (e) (n=5. Paired two-way ANOVA with multiple comparison correction). g. Treatment of DLD-tg(PD-L1)-GFPluc+ tumors in NSG mice with both PD-L1 blockade (HAC protein), CD47 blockade (anti-CD47), and combination therapy (n=10. Unpaired one-way ANOVA without multiple comparison correction). h. Survival analysis of mice in (g) (n=10. One-tailed log-rank Mantel-Cox test. PBS vs. HAC, p<0.01; PBS vs. anti-CD47, p<0.001; PBS vs. combo, p<0.0001; HAC vs. anti-CD47, p<0.05; HAC vs. combo; p<0.05; anti-CD47 vs. combo, p=0.0761). *p<0.05; **p<0.01; ***p<0.001; ****p<0.0001; n.s., not significant. Data are mean ± s.e.m.

Comment in

References

    1. Nishimura H, Nose M, Hiai H, Minato N, Honjo T. Development of lupus-like autoimmune diseases by disruption of the PD-1 gene encoding an ITIM motif-carrying immunoreceptor. Immunity. 1999;11:141–151. - PubMed
    1. Freeman GJ, et al. Engagement of the PD-1 immunoinhibitory receptor by a novel B7 family member leads to negative regulation of lymphocyte activation. J Exp Med. 2000;192:1027–1034. - PMC - PubMed
    1. Okazaki T, Honjo T. The PD-1-PD-L pathway in immunological tolerance. Trends Immunol. 2006;27:195–201. doi: 10.1016/j.it.2006.02.001. - DOI - PubMed
    1. Keir ME, Butte MJ, Freeman GJ, Sharpe AH. PD-1 and its ligands in tolerance and immunity. Annu Rev Immunol. 2008;26:677–704. doi: 10.1146/annurev.immunol.26.021607.090331. - DOI - PMC - PubMed
    1. Zou W, Wolchok JD, Chen L. PD-L1 (B7-H1) and PD-1 pathway blockade for cancer therapy: Mechanisms, response biomarkers, and combinations. Sci Transl Med. 2016;8:328rv324. doi: 10.1126/scitranslmed.aad7118. - DOI - PMC - PubMed

Publication types

MeSH terms