. 2017 May 25;545(7655):505-509.
doi: 10.1038/nature22366. Epub 2017 May 17.

Architecture of the human interactome defines protein communities and disease networks

Affiliations

Architecture of the human interactome defines protein communities and disease networks

Edward L Huttlin et al. Nature. .

Abstract

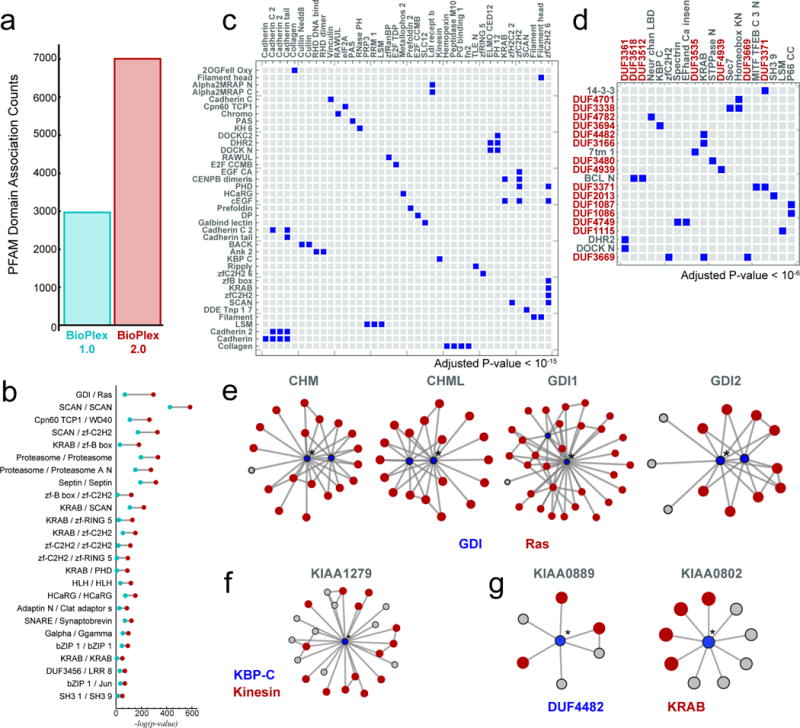
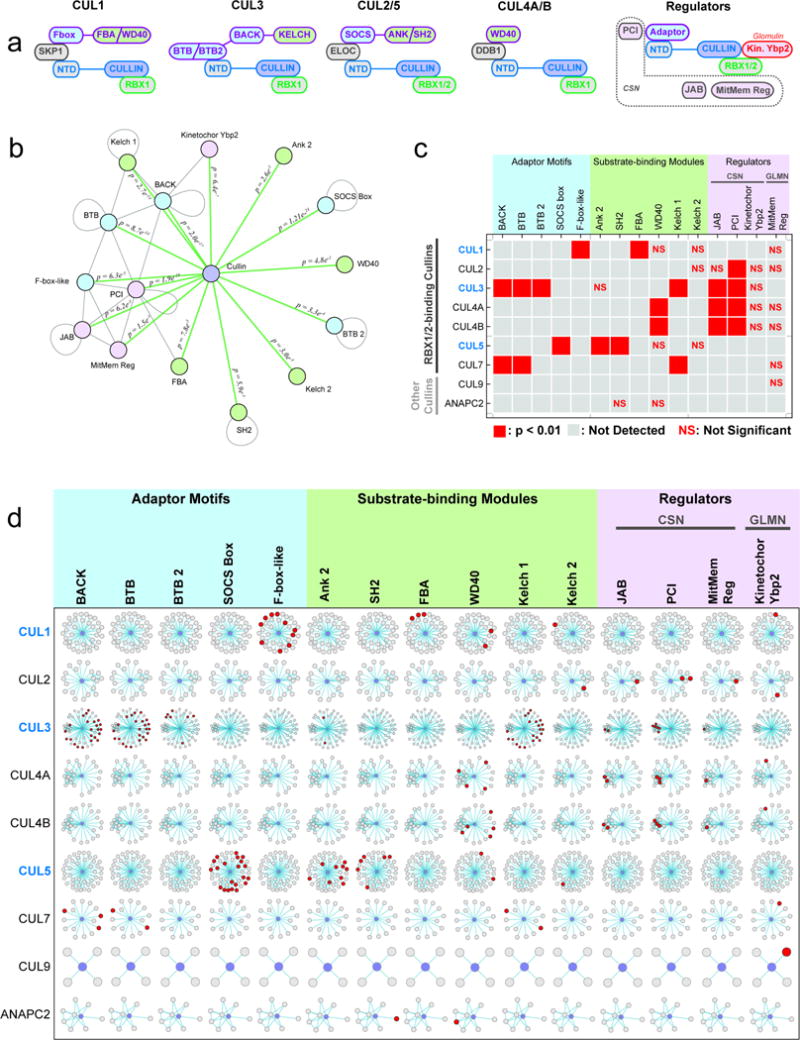
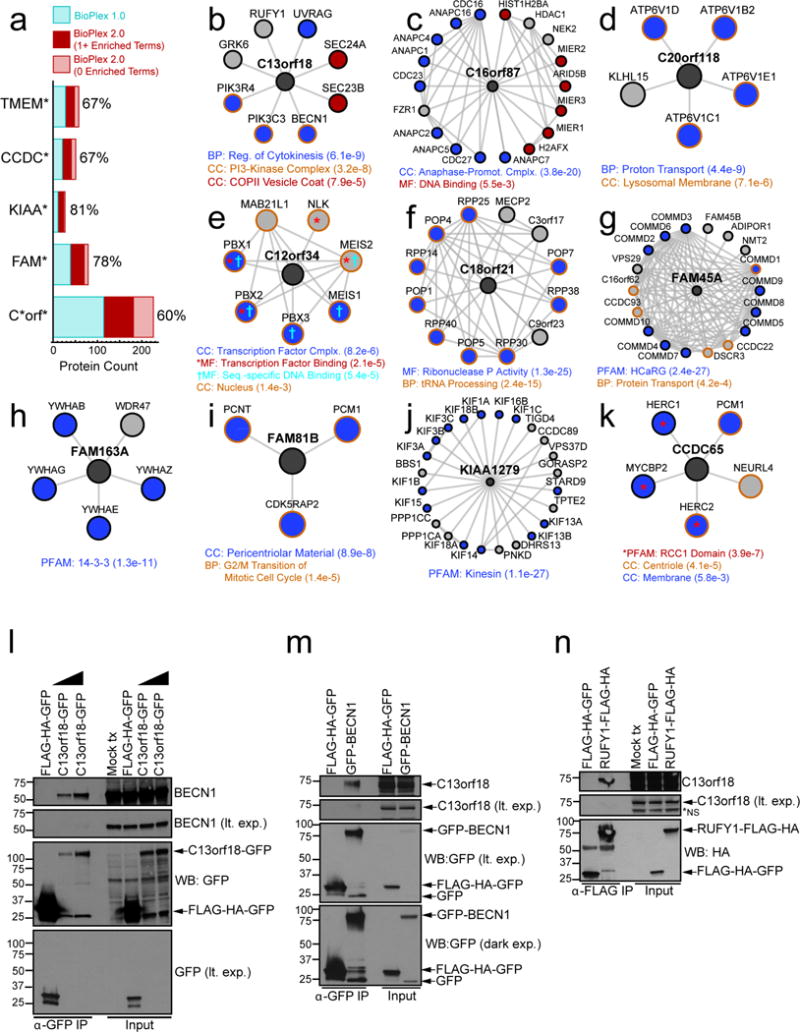
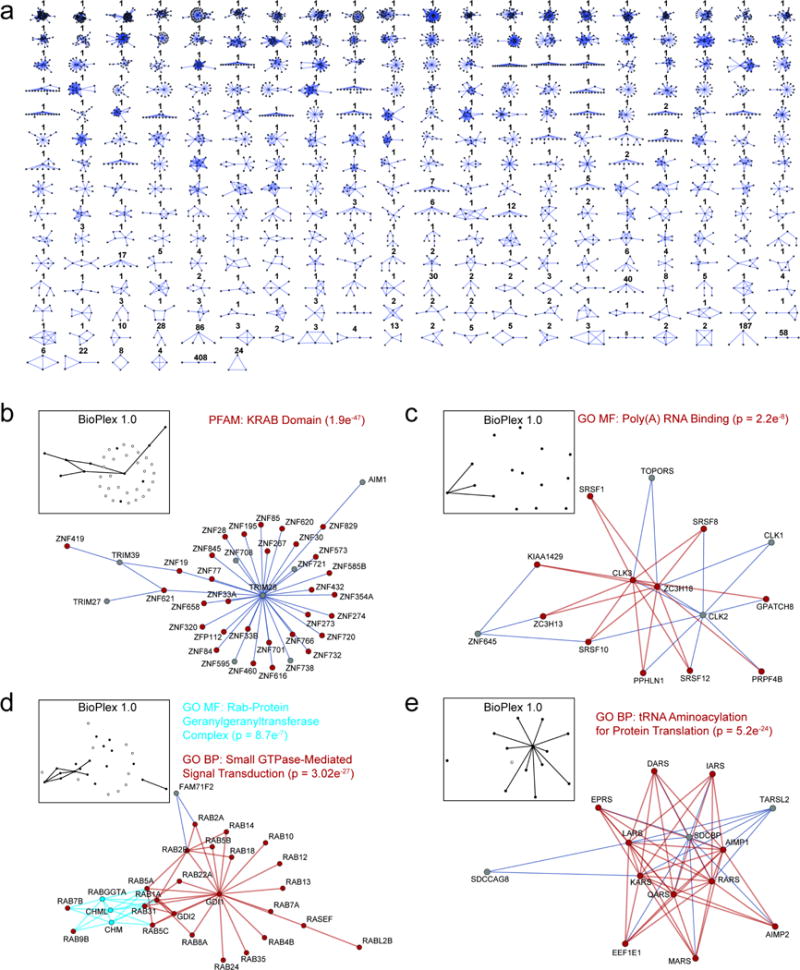
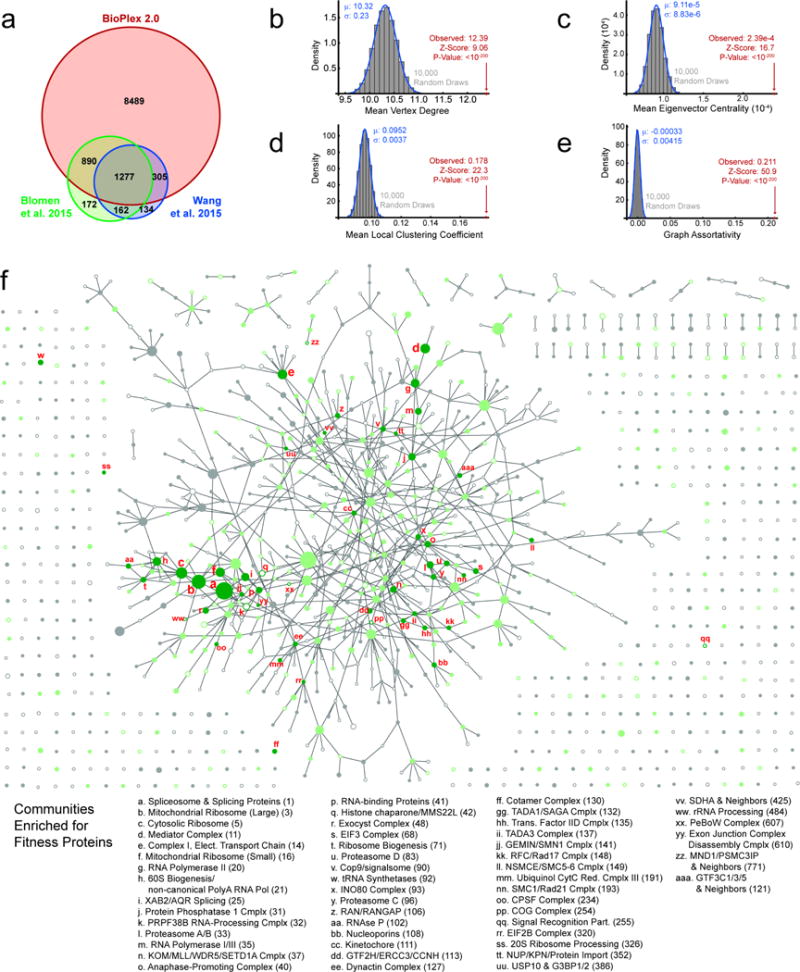
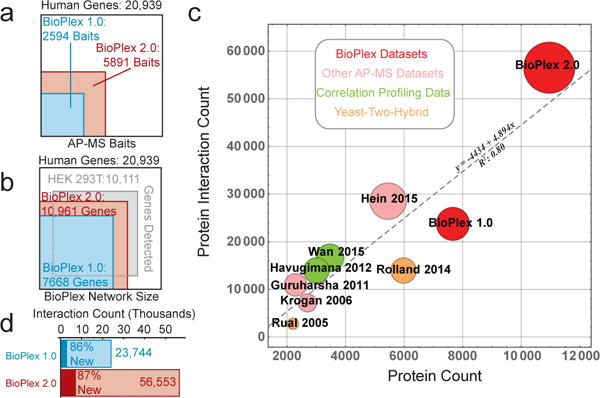
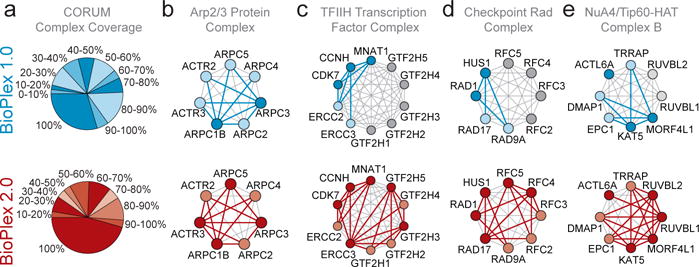
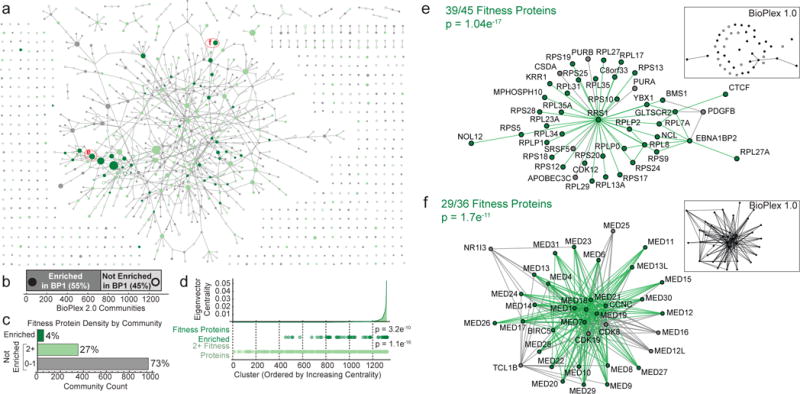
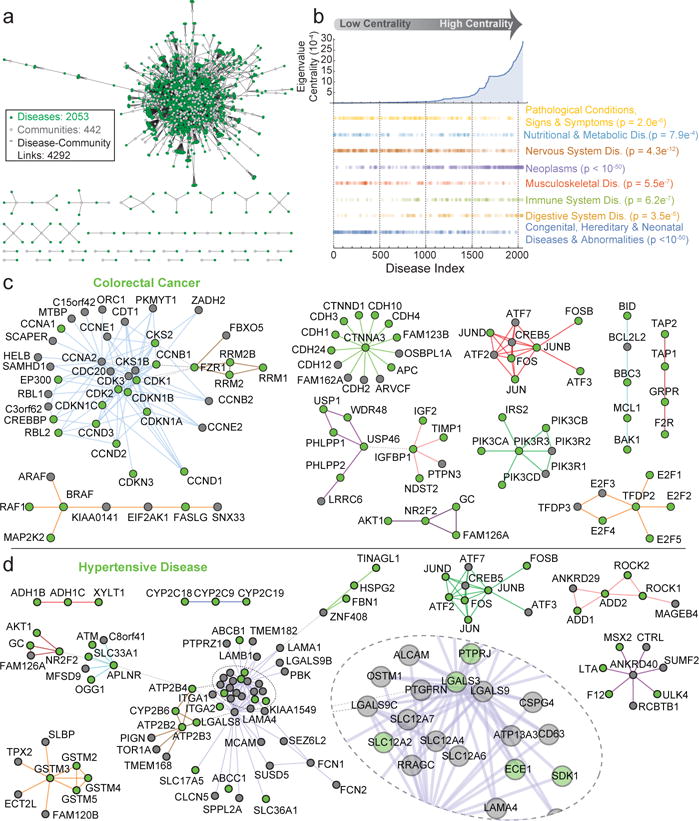
The physiology of a cell can be viewed as the product of thousands of proteins acting in concert to shape the cellular response. Coordination is achieved in part through networks of protein-protein interactions that assemble functionally related proteins into complexes, organelles, and signal transduction pathways. Understanding the architecture of the human proteome has the potential to inform cellular, structural, and evolutionary mechanisms and is critical to elucidating how genome variation contributes to disease. Here we present BioPlex 2.0 (Biophysical Interactions of ORFeome-derived complexes), which uses robust affinity purification-mass spectrometry methodology to elucidate protein interaction networks and co-complexes nucleated by more than 25% of protein-coding genes from the human genome, and constitutes, to our knowledge, the largest such network so far. With more than 56,000 candidate interactions, BioPlex 2.0 contains more than 29,000 previously unknown co-associations and provides functional insights into hundreds of poorly characterized proteins while enhancing network-based analyses of domain associations, subcellular localization, and co-complex formation. Unsupervised Markov clustering of interacting proteins identified more than 1,300 protein communities representing diverse cellular activities. Genes essential for cell fitness are enriched within 53 communities representing central cellular functions. Moreover, we identified 442 communities associated with more than 2,000 disease annotations, placing numerous candidate disease genes into a cellular framework. BioPlex 2.0 exceeds previous experimentally derived interaction networks in depth and breadth, and will be a valuable resource for exploring the biology of incompletely characterized proteins and for elucidating larger-scale patterns of proteome organization.


Conflict of interest statement

Competing Financial Interest

Yes there is potential Competing Interest.

Steven Gygi is a consultant for Biogen, Inc.

Figures

Extended Data Figure 1
Extended Data Figure 1. BioPlex network coverage and validation of interactions for a set of poorly studied proteins in BioPlex 2.0 using HCT116 cells
a, BioPlex network coverage of selected protein classes. Light shades represent total proteins, while dark shades represent baits targeted for AP-MS. BioPlex 1.0 is depicted in blue shades while BioPlex 2.0 is highlighted in red. b – m, The indicated bait proteins (teal) were expressed in HCT116 cells and α-HA immune complexes analyzed by mass spectrometry. HCIPs were determined using CompPASS-Plus. Interactions observed in both HCT116 and HEK293T cells are indicated with blue edges and nodes. Interactions seen in HEK293T but not HCT116 are shown in grey edges and nodes. b, TMEM111; c, ZNHIT3; d, RMND5A; e, SMTNL2; f, FBXO28; g, C3orf75; h, c9orf41; i, MPP2; j, ZNF219; k, ZNF483; l, WDR37; m, LRCH3.
Extended Data Figure 2
Extended Data Figure 2. Validation of interactions in BioPlex 2.0
a–c, Systematic analysis of 14-3-3 interactions by reciprocal AP-MS. a, the matrix relates 39 BioPlex 2.0 baits (horizontal) with six 14-3-3 proteins (left) which were detected as preys one or more times. Colored (i.e. non-white) boxes indicate interactions that were observed in BioPlex 2.0; the specific color indicates the outcome of a reciprocal AP-MS experiment targeting the 14-3-3 protein instead. Boxes shaded red could not be detected in the reciprocal direction because the 14-3-3 protein YWHAE failed sequence validation and could not be subjected to AP-MS analysis; boxes shaded light gray were also not observed in reciprocal orientation, likely because those particular proteins (shaded in gray across the top) were not detectable in HEK293T cells and are not expected to appear as preys in the 14-3-3 pull-downs. Blue boxes indicate interactions that were observed in reciprocal orientation, while dark gray boxes were not observed in reciprocal orientation. Note that SFN is listed in both horizontal and vertical directions because it was a prey in the BioPlex 2.0 network. b, reciprocal interactions among 14-3-3 proteins. Shading is the same as above, with black indicating that self-interactions are not considered for reciprocal analysis. c, summary of interaction results across panels a and b. Overall, more than 40% of 14-3-3 interactions were confirmed via reciprocal IP; after accounting for YWHAE and those BioPlex baits that are not detected in HEK293T cells in the absence of over-expression, the reciprocal rate rises to 63% of eligible interactions. d–i, validation of a PDLIM7-PTPN14 BioPlex 2.0 network in MCF10A cells. This network is regulated by the Hippo kinase system, which is activated upon contact inhibition of cell proliferation. In order to validate this network, including previously unreported interactions, a series of AP-MS experiments were performed in proliferating or contact inhibited MCF10A cells and HCIPs identified using CompPASS. d, summary of interactions identified in BioPlex 2.0 or MCF10A AP-MS experiments. Edges detected in BioPlex 2.0 only are red, while edges detected in both cell lines are purple and edges unique to the MCF10A IP’s are shaded blue. MCF10A-specific edges that could not appear in BioPlex 2.0 because neither of their constituent proteins has been targeted as a bait are shown as dashed lines. Nodes are colored to represent their status in the BioPlex network: black nodes have been targeted as baits in BioPlex 2.0 and gray nodes appear as preys, while white nodes do not appear in BioPlex at all. Edges observed in MCF10A experiments are assumed to have been detected in both confluent and sub-confluent cells, unless they have been labeled with an “S” or a “C”, implying that they were detected only under sub-confluent or confluent conditions, respectively. Interactions further confirmed via IP-Western are labeled with “W” (see panels h and i). e, duplicate network highlighting previously un-reported edges within the combined BioPlex 2.0/MCF10A Hippo interaction network. Edges highlighted in gray have been reported previously, while new edges are highlighted in blue. f, summary of overlap between BioPlex 2.0 and the MCF10A interaction networks. 65% of eligible interactions were confirmed. g, summary of novel and previously reported interaction counts in the combined Hippo network: 63% of interactions have not been previously reported. H–I, IP-Western confirmation of interactions among PDLIM7-PTPN14 (h) and PTPN14-MAGI1 (i).
Extended Data Figure 3
Extended Data Figure 3. BioPlex 2.0 Enables Subcellular Localization Prediction for Additional Uncharacterized Proteins
a, increased interaction density expands subcellular localization predictions from BioPlex 2.0. b, subcellular localization predictions for a selection of uncharacterized human proteins for which no confident prediction could be made in BioPlex 1.0. Where possible, the figure indicates whether predicted localization is consistent with the Human Protein Atlas (Uhlen et al. 2015). c – j, subnetworks highlighting primary and secondary neighbors for selected uncharacterized human proteins whose subcellular localization can be predicted using the BioPlex network. Nodes are colored according to subcellular localization data provided by UniProt. P-values were calculated by Fisher’s Exact Test as described in Online Methods with multiple testing correction. Localizations depicted in panels c, e, g, and i are consistent with recent characterization as listed in UniProt; The localization given in panel d is consistent with MitoCarta 2.0 (Calvo et al. 2015 Nuc. Acids Res.).
Extended Data Figure 4
Extended Data Figure 4. Validation of subcellular localization predictions using α-HA immunofluorescence
The indicated bait proteins fused at their C-terminus with an HA tag were expressed after transient infection of lentiviruses at low multiplicity of infection and after 2 days, cells were fixed and subjected to α-HA-based immunofluorescence (red). Nuclei were stained with Hoechst. For baits with predicted mitochondrial localization, cells were co-stained with α-TOMM20 antibodies (green). Z-series optical sections were acquired via spinning disk confocal microscopy; maximum intensity projections are shown. Scale bar=20 μm.
Extended Data Figure 5
Extended Data Figure 5. Increased Scope of BioPlex 2.0 Network Reveals Additional Domain-Domain Associations
a, numbers of PFAM domain associations detected within BioPlex 1.0 and 2.0 interaction networks. b, a selection of domain interactions detected in both networks highlighting increased significance owing to greater coverage of the BioPlex 2.0 network (red) versus its earlier form (blue). c, a subset of domain-domain associations detected within BioPlex 2.0, but not BioPlex 1.0. Although over 4000 new domain-domain associations were detected overall (panel a; Benjamini-Hochberg adjusted p-value < 0.01), for purposes of display only domain associations with p-values < 10−15 are shown. d, selected domain-domain associations involving domains of unknown function (DUF*); an adjusted p-value smaller than 10−6 was required. e – g, subnetworks highlighting interactions that underlie associations among selected domain pairs. Blue and red shading highlights proteins bearing the indicated domains. Asterisks denote central proteins whose names are denoted above each subnetwork. e, GDI/Ras association; f, KBP-C/Kinesin association; g, DUF4482/KRAB association.
Extended Data Figure 6
Extended Data Figure 6. Cullin Domain Associations Reflect Regulatory Proteins and Substrate Adaptors
a, modular structure of cullin-RING E3 ubiquitin ligases (CRL). Edge colors unite domain(s) within the same protein molecules. Shading highlights individual domains as cullins (purple), adaptor proteins (light blue), substrate-binding modules (green), or other (gray). CSN: Cop9/signalsome. b, Cullin domain associations. Edges connect domains that were found to associate with each other more frequently than expected (see Online Methods). P-values were calculated by Fisher’s Exact Test with multiple testing correction. Self-loops indicate domains that were found to preferentially associate with other domains containing the same domain. Nodes are colored to reflect protein function as described in part a. c–d, pairwise enrichment of the indicated PFAM domains among neighbors of each indicated cullin-domain-containing protein. Proteins that have been specifically targeted for AP-MS as baits are highlighted in blue; those that appear as preys only are black. Domains are grouped by function with color coding as described above. CSN: Cop9/signalsome; GLMN: Glomulin. c, Red boxes indicate significant enrichment (p < 0.01) after multiple testing correction; NS indicates the specified domain was found, but significance thresholds were not met. d, networks depict the immediate neighbors of each cullin-domain-containing protein (center, blue). Neighbors that contain the indicated domains are highlighted in red.
Extended Data Figure 7
Extended Data Figure 7. BioPlex 2.0 Expands Functional Insights into Uncharacterized Proteins
a, stacked bar graph depicting the number of baits targeted in BioPlex 1.0 and BioPlex 2.0 with Gene Symbols matching each pattern; BioPlex 2.0 matches have been subdivided to indicate the fraction that are associated with one or more enriched functional classes (hypergeometric test; Benjamini-Hochberg adjusted p-value < 0.01). This fraction is also expressed as a percentage for each bar. b – k, nearest neighbor sub-networks centered on selected human proteins with limited prior characterization. Color coding is used to highlight proteins that match any enriched functional categories. l–n, Validation of C13orf18 association with components of the BECN1 complex (panel h). Extracts prepared from 293T cells expressing the indicated constructs were subjected to affinity purification using α-GFP resin (l,m) or α-FLAG magnetic beads (n), followed by immunoblotting with α-BECN1 or α-C13orf18 antibodies.
Extended Data Figure 8
Extended Data Figure 8. MCL Clustering Subdivides the BioPlex 2.0 Network into Clusters of Functionally Associated Proteins
a, summary of subnetwork topologies for all 1320 complexes. Numbers indicate the counts of complexes matching each topology. b–e, selected protein complexes that associate proteins with related functions. Colored nodes and edges associate individual proteins with enriched classifications. Inset diagrams indicate complex coverage in BioPlex 1.0. Black nodes and edges indicate proteins and interactions that were present in the BioPlex 1.0; empty nodes depict proteins from the BioPlex 2.0 community that were not detected in BioPlex 1.0.
Extended Data Figure 9
Extended Data Figure 9. Network Properties and Community Distribution of Fitness Genes
a. Overlap among BioPlex 2.0 and two published lists of cellular fitness genes. b–e, simulations reveal distinctive network properties of cellular fitness genes (see Online Methods for details). b, mean vertex degree; c, mean eigenvector centrality; d, mean local clustering coefficient; e, graph assortativity. f, expanded view of the BioPlex community network from Figure 3a, including descriptions of 53 communities that are enriched for cellular fitness proteins. Numbers after each community description correspond to cluster indices as found in Supplementary Tables 6 – 8.
Extended Data Figure 10
Extended Data Figure 10. The BioPlex interaction network and hereditary disease: Patient mutations in the Hereditary Spastic Paraglegia protein KIAA0196/SPG8 affect formation of the WASH complex
a–c, BioPlex 2.0 communities associated with congenital or hereditary disease states. Green nodes are associated with the indicated disease (DisGeNET), while other community members are gray. Edge colors indicate connectivity of individual communities revealed through MCL clustering. a, Bardet-Biedl Syndrome; b, Mitochondrial Complex I deficiency; c, Hereditary Spastic Paraplegia (the WASH complex). d, Quantitative analysis of association of KIAA0196/SPG8 and its mutant forms found in Hereditary Spastic Paraplegia was performed using TMT proteomics and the relative abundance of individual WASH complex subunits displayed as a heat map. e, HEK293T cells were gene-edited to delete endogenous KIAA0196. Wild-Type (WT) or disease variants (N471D/L619F/V626F) of KIAA0196 (N-terminally FLAG tagged) were expressed in these cells and assayed by immunoblotting. f, Work-flow for Tandem Mass Tagging (TMT) approach to quantify KIAA0196-associated proteins. g, Quantitative interaction proteomics of WT and variants of KIAA0196. Average relative intensities of biological replicates of interacting proteins are shown. Error bars represent mean +/− standard deviation. Number of peptides quantified for each protein is indicated in the parenthesis. h–i, Immunoprecipitation (IP)/immunoblotting (IB) was performed on three biological replicates to examine association of WASH complex members by immunoblotting. Average relative intensities of immunoblot signals for biological triplicates are shown, with error bars representing the mean +/− standard deviation.
Figure 1
Figure 1. BioPlex 2.0 Significantly Increases Depth and Breadth of Interactome Coverage
a, bait proteins targeted for AP-MS analysis. b, protein-coding genes included in BioPlex 2.0 as baits or preys. c, The BioPlex 2.0 network significantly exceeds previous experimentally derived interaction networks with respect to protein and interaction counts. Circle area is proportional to interaction counts, while shading denotes the experimental strategy used for interaction mapping. d, BioPlex 2.0 doubles the numbers of interactions revealed in BioPlex 1.0.
Figure 2
Figure 2. BioPlex 2.0 Maps Protein Complexes with Increased Resolution
a, agreement among BioPlex networks and CORUM complexes. Pie charts indicate the fraction of CORUM complexes that attained the indicated protein coverage. When compared with BioPlex 1.0 (blue), BioPlex 2.0 (red) provides significantly improved coverage. b – e, network coverage achieved by BioPlex 1.0 (blue) and BioPlex 2.0 (red) for selected CORUM complexes. Dark and light shades depict bait and prey proteins, respectively, while gray proteins were not observed in the network. Red and blue edges represent detected protein interactions.
Figure 3
Figure 3. BioPlex Communities Subdivide the Interaction Network according to Functional Properties and Fitness Effects
a, network of communities revealed through MCL clustering of the BioPlex 2.0 network. Nodes represent distinct communities and are scaled to reflect the numbers of proteins in each (3–76 proteins). Nodes are connected by edges when proteins within the respective communities interact with unusually high frequency (see Online Methods). Filled nodes depict communities that were also found to be interconnected by unusual numbers of interactions in BioPlex 1.0; open circles represent communities of proteins that exhibited only background numbers of interactions in BioPlex 1.0. Communities containing 2 or more proteins associated with increased cellular fitness are highlighted in light green; communities that are enriched with cellular fitness proteins (1% FDR) are highlighted in dark green. b, Mapping BioPlex 2.0 communities onto BioPlex 1.0 reveals lower connectivity, with 45% of complexes showing no significant enrichment of interactions above background levels (binomial test; Benjamini-Hochberg-adjusted p-values < 0.05). c, Relative fractions of 1320 communities that contain specified numbers of fitness proteins. d, When BioPlex 2.0 clusters are ranked according to their eigenvector centrality within the BioPlex 2.0 community network (panel a), clusters that contain multiple fitness proteins (light green) or are enriched for fitness proteins (dark green) tend to have higher centralities (Kolmogorov-Smirnov test). e–f, selected BioPlex 2.0 communities highlighting proteins associated with cellular fitness (green). Inset maps depict the same communities as observed in BioPlex 1.0. Filled nodes indicate proteins that were in BioPlex 1.0, while black edges indicate interactions that were visible. In contrast, open circles indicate proteins that were not found in BioPlex 1.0.
Figure 4
Figure 4. Integration of BioPlex 2.0 and the DisGeNET Network Associates Protein Complexes with Disease Processes
a, network of associations among protein interaction communities and disease conditions (see Online Methods). The network depicts 4292 associations between 442 protein complexes (gray) and 2053 disease states (green). b, Ranking of 2053 disease states based on eigenvalue centrality in the disease-complex network (panel a). Scatter plots below highlight disease classes that are non-randomly distributed (Kolmogorov-Smirnov Test; Benjamini-Hochberg p-value < 0.01). c – d, subnetworks associated with selected disease states: colorectal cancer (BRAF complex: p < 0.05) and hypertensive disease. Nodes associated with the indicated disease are highlighted in green, while other complex members are gray; thick, multi-colored edges connect proteins belonging to individual communities revealed through MCL clustering; thin, dashed, grey edges connect proteins among adjacent communities.

References

    1. Havugimana PC, et al. A census of human soluble protein complexes. Cell. 2012;150:1068–1081. doi: 10.1016/j.cell.2012.08.011. - DOI - PMC - PubMed
    1. Wan C, et al. Panorama of ancient metazoan macromolecular complexes. Nature. 2015;525:339–344. doi: 10.1038/nature14877. - DOI - PMC - PubMed
    1. Menche J, et al. Disease networks. Uncovering disease-disease relationships through the incomplete interactome. Science. 2015;347:1257601. doi: 10.1126/science.1257601. - DOI - PMC - PubMed
    1. Huttlin EL, et al. The BioPlex Network: A Systematic Exploration of the Human Interactome. Cell. 2015;162:425–440. doi: 10.1016/j.cell.2015.06.043. - DOI - PMC - PubMed
    1. Enright AJ, Van Dongen S, Ouzounis CA. An efficient algorithm for large-scale detection of protein families. Nucleic Acids Res. 2002;30:1575–1584. - PMC - PubMed

Publication types