. 2017 May 25;545(7655):500-504.
doi: 10.1038/nature22314. Epub 2017 May 17.

Cancer progression by reprogrammed BCAA metabolism in myeloid leukaemia

Affiliations

Cancer progression by reprogrammed BCAA metabolism in myeloid leukaemia

Ayuna Hattori et al. Nature. .

Abstract

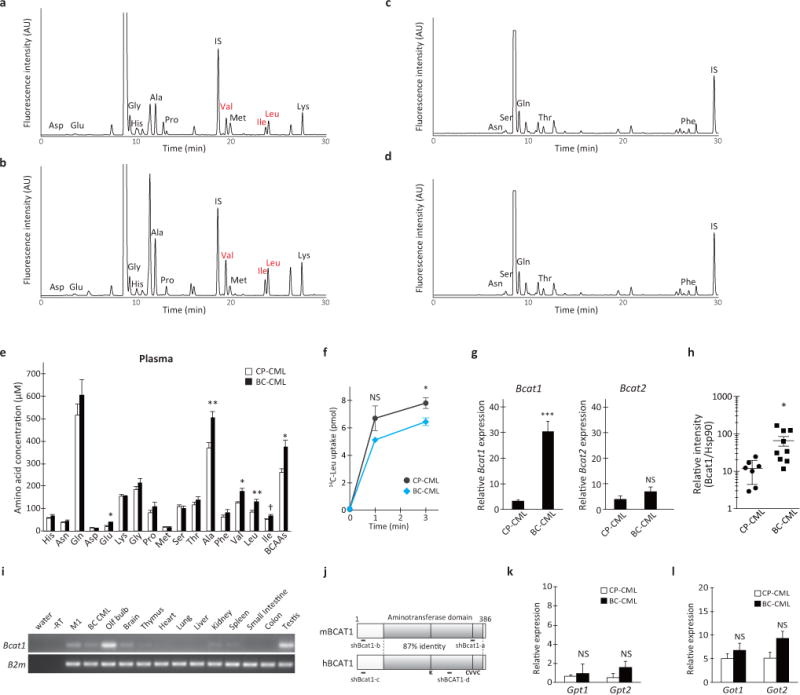
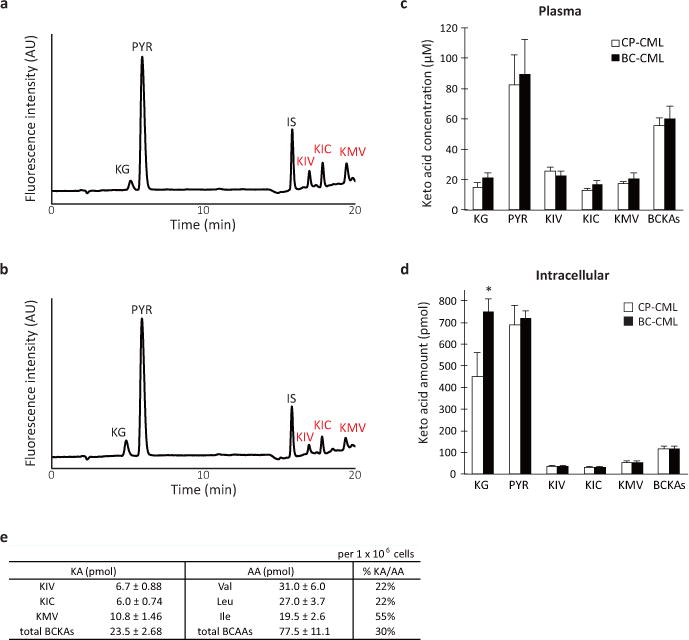
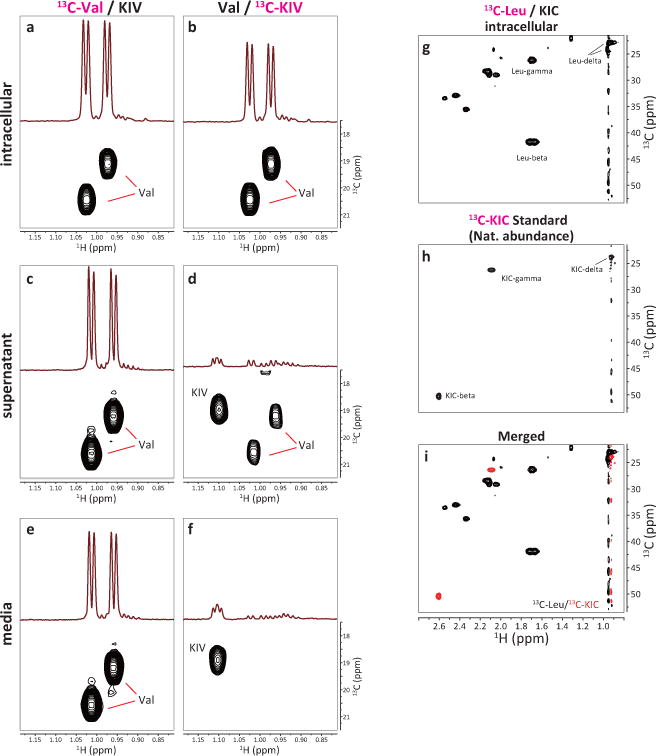
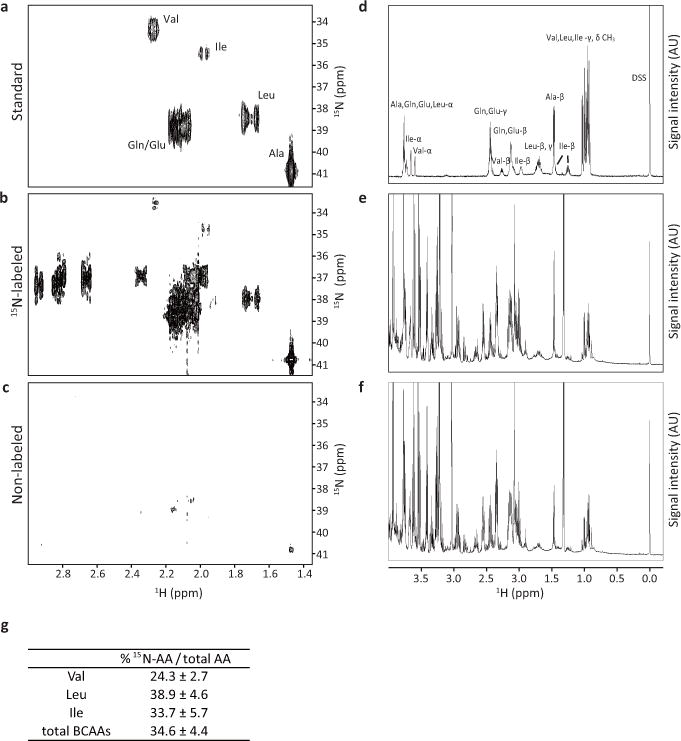
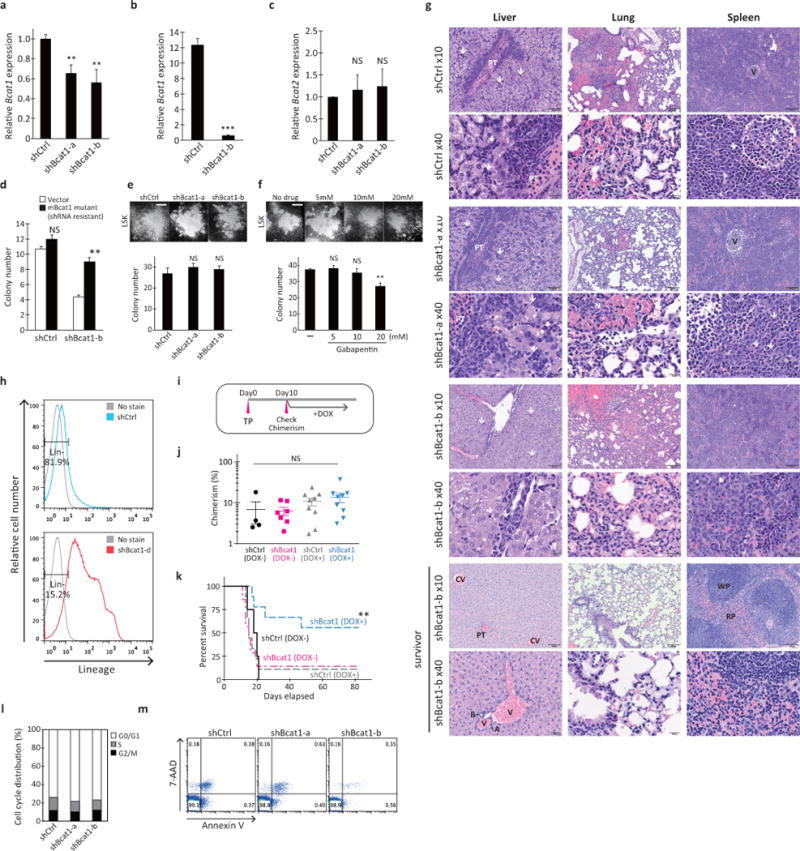
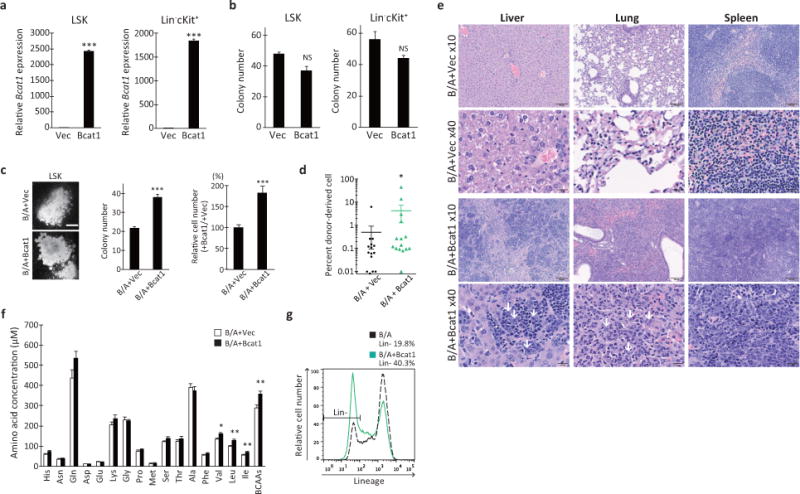
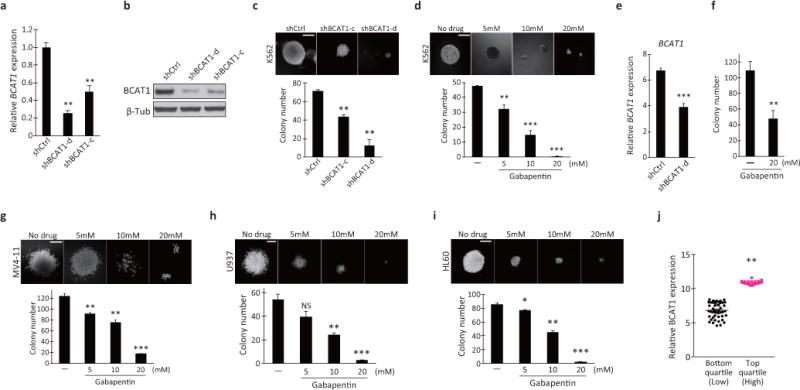
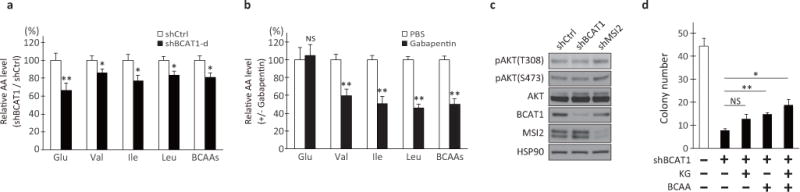
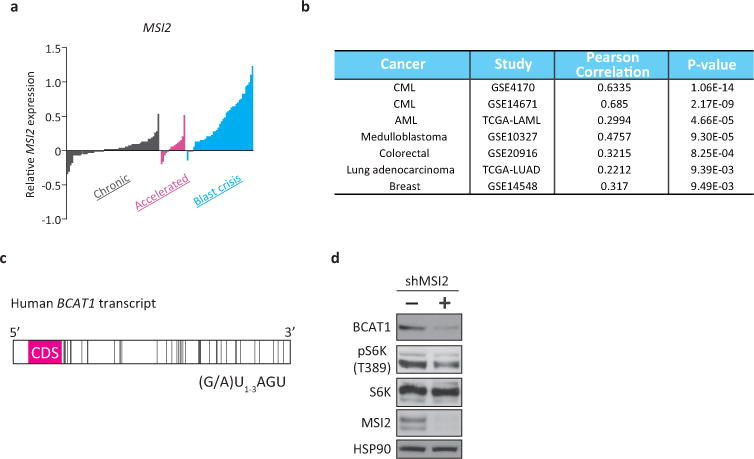
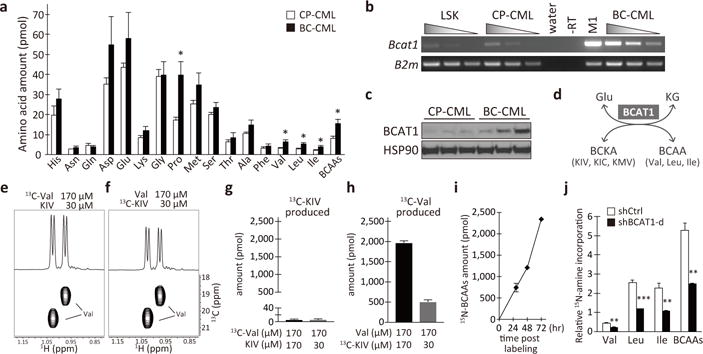
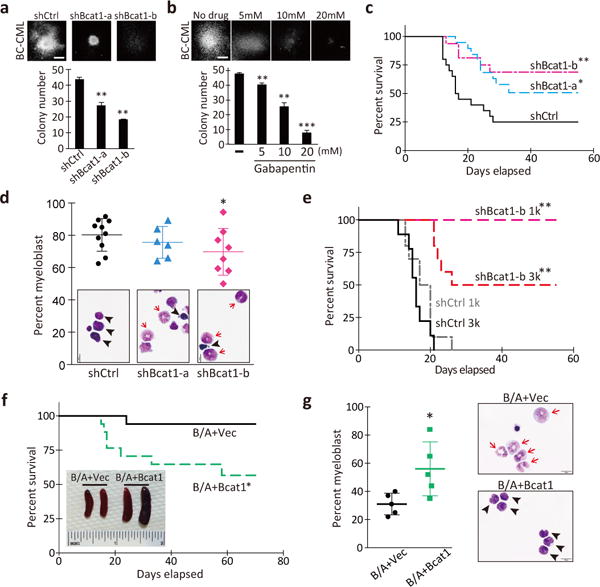
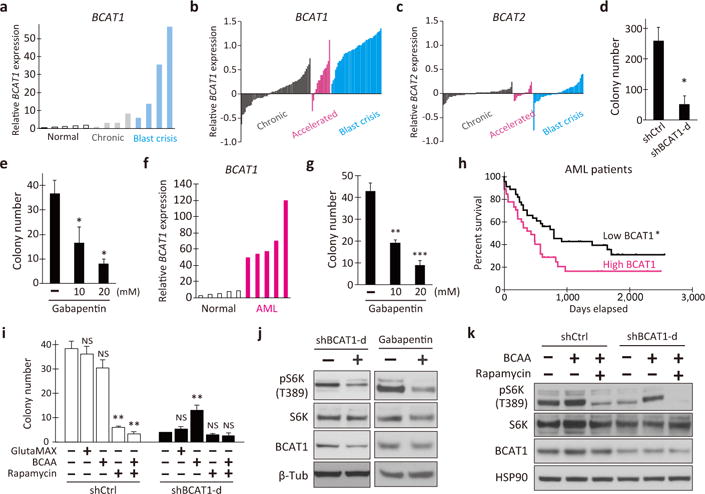
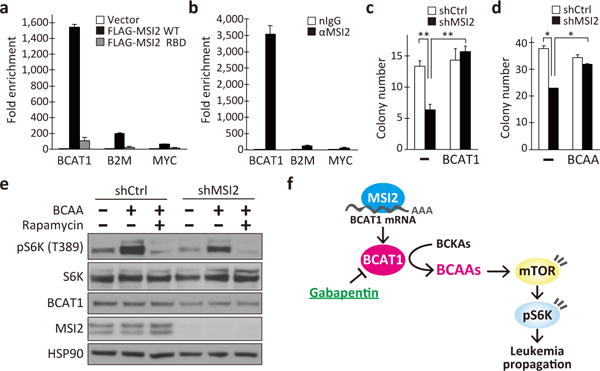
Reprogrammed cellular metabolism is a common characteristic observed in various cancers. However, whether metabolic changes directly regulate cancer development and progression remains poorly understood. Here we show that BCAT1, a cytosolic aminotransferase for branched-chain amino acids (BCAAs), is aberrantly activated and functionally required for chronic myeloid leukaemia (CML) in humans and in mouse models of CML. BCAT1 is upregulated during progression of CML and promotes BCAA production in leukaemia cells by aminating the branched-chain keto acids. Blocking BCAT1 gene expression or enzymatic activity induces cellular differentiation and impairs the propagation of blast crisis CML both in vitro and in vivo. Stable-isotope tracer experiments combined with nuclear magnetic resonance-based metabolic analysis demonstrate the intracellular production of BCAAs by BCAT1. Direct supplementation with BCAAs ameliorates the defects caused by BCAT1 knockdown, indicating that BCAT1 exerts its oncogenic function through BCAA production in blast crisis CML cells. Importantly, BCAT1 expression not only is activated in human blast crisis CML and de novo acute myeloid leukaemia, but also predicts disease outcome in patients. As an upstream regulator of BCAT1 expression, we identified Musashi2 (MSI2), an oncogenic RNA binding protein that is required for blast crisis CML. MSI2 is physically associated with the BCAT1 transcript and positively regulates its protein expression in leukaemia. Taken together, this work reveals that altered BCAA metabolism activated through the MSI2-BCAT1 axis drives cancer progression in myeloid leukaemia.


Conflict of interest statement

Author Information

Competing financial interests. T.I. and A.H. are named inventors of a provisional patent application number 62/413,028. Correspondence and requests for materials should be addressed to T.I. (ito@bmb.uga.edu).

Figures

Extended Data Figure 1
Extended Data Figure 1. Change in the amino acid metabolism in leukemic mice
a–d, Representative chromatograms of (a, c) CP-CML and (b, d) BC-CML plasma samples derivatized with the amine-specific fluorescent labeling agent NBD-F and analyzed in mobile phases at (a, b) pH 6.2 or (c, d) pH 4.4. Each NBD-amino acid peak is assigned as indicated. IS, internal standard (NBD-6-aminocaproic acid). e, Plasma amino acid levels in mice with CP- and BC-CML. Blood plasma samples were prepared from mice with CP- and BC-CML, methanol-extracted and dried under a vacuum. The dried extracts were analyzed for quantification. Open and closed bars indicate CP-CML (n=5) and BC-CML (n=7) specimens, respectively. Two-tailed t-test. †p<0.06, *p<0.05, **p<0.01. f, Leucine transport in primary CP- and BC-CML cells. BCR-ABL1-YFP+PI live leukemia cells (5 × 10⁵) were sorted from premorbid animals and placed in a pre-warmed uptake media containing 10 μM [(U)-14C]-labeled L-leucine. After incubation at 37°C for the indicated times, the cells were washed with cold HBSS and lysed with 0.1 M sodium hydroxide, and the radioactivity was measured using a scintillation counter. The gray and blue lines indicate the average leucine uptake in CP- and BC-CML samples, (n= 5 and 3, respectively). Error bars indicate s.e.m. *p<0.05. NS, not statistically significant (p>0.05). g, RT-qPCR analysis of Bcat1 and Bcat2 expression in CP- and BC-CML cells (n=4 each). The expression levels are normalized and displayed relative to the control beta-2-microglobulin gene expression. Error bars indicate s.e.m.; ***p<0.001, NS, not statistically significant (p>0.05). h, BCAT1 protein expression in mouse primary CP- and BC-CML cells. This graph shows BCAT1 protein expression levels normalized relative to the HSP90 loading control (CP-CML, n=7; BC-CML, n=9). Error bars indicate s.e.m. *p<0.05. i, Tissue-specific expression of mouse Bcat1. The expression was detectable in the myeloid cell line M1, primary mouse BC-CML cells, olfactory bulb (Olf bulb), whole brain and testis. B2m, beta-2-microglobulin. j, Schematics of the structures of human and mouse BCAT1 proteins. The shaded boxes represent aminotransferase domains. K, a Lys residue for the binding of the pyridoxal phosphate cofactor. CVVC, a conserved redox-sensitive CXXC motif. Regions targeted with shRNAs in this study are shown as thick bars (shBcat1-a and -b, and shBCAT1-c and -d). k, l, Alanine and aspartate transaminase gene expression in CP- and BC-CML. RT-qPCR analysis of (k) Gpt1 and Gpt2, and (l) Got1 and Got2 expression in CP- and BC-CML samples (n=4 each). The expression levels are normalized and displayed relative to the expression of the B2m control. Error bars indicate s.e.m.; NS, not statistically significant (p>0.05).
Extended Data Figure 2
Extended Data Figure 2. Keto acid metabolism in leukemic mice
a, b, Representative chromatograms of (a) CP- and (b) BC-CML plasma samples derivatized with the keto acid-reactive o-phenylenediamine (OPD). Each OPD-keto acid peak is assigned as indicated. KG, alpha-ketoglutarate; PYR, pyruvate; KIV, keto-isovalerate; KIC, keto-isocaproate; KMV, keto-methylvalerate. IS, internal standard for keto acid analysis (OPD-alpha-ketovalerate). c, d, Plasma and intracellular branched-chain keto acid levels in CP- and BC-CML. (c) Blood plasma fractions from leukemic mice or (d) FACS-purified live leukemia cells (5 × 10⁶) were methanol-extracted and dried under a vacuum. The dried extracts were labeled with OPD, extracted with ethyl acetate and analyzed using an HPLC system equipped with a fluorescence detector. Open and closed bars indicate CP-CML (plasma, n=9; intracellular, n=5) and BC-CML (plasma, n=10; intracellular, n=6) specimens, respectively. BCKAs, total branched-chain keto acids. *p<0.05. Error bars indicate s.e.m. e, Molar amount of intracellular BCAAs and BCKAs in primary mouse BC-CML cells. The amount of each organic acid per one million cells is estimated using calibration curves obtained with reference standards for each compound. “%KA/AA” shows the amount of a BCKA relative to the corresponding BCAA species.
Extended Data Figure 3
Extended Data Figure 3. Intracellular BCAA production from BCKA in human K562 BC-CML cells
a–f, Regions of HSQC spectra of 13C-labeled metabolites. K562 cells were cultured in media supplemented with (a, c) 170 μM 13C-Val and 30 μM non-labeled KIV, or (b, d) 170 μM non-labeled Val and 30 μM 13C-KIV. After labeling for 15 min, the cells were collected, washed with PBS and methanol-extracted for HSQC analysis by high-field NMR spectroscopy. Each panel shows the regions of 1D and 2D HSQC spectra for the (a, b) intracellular fraction, (c, d) culture supernatant, and (e, f) labeling media alone, respectively. Panels a and b are the same as shown in Fig. 1e and f, respectively. g–i, Absence of detectable intracellular KIC generation by Leu breakdown. K562 cells were cultured in the labeling medium supplemented with 170 μM 13C-Leu and 30 μM non-labeled KIC for 15 min, and the intracellular 13C-labeled metabolites were analyzed by HSQC analysis. Each panel shows region of the 2D spectrum showing 1H-13C HSQC signals for beta, gamma and delta carbons of Leu and KIC. (g) intracellular fraction, (h) KIC reference standard (HSQC signals derived from natural abundance 13C-KIC), (i) overlay of the spectra g (black) and h (red). Note the absence of KIC signals in (g).
Extended Data Figure 4
Extended Data Figure 4. Intracellular BCAA production via transamination
a–c, Regions of 600 MHz 2D HMBC spectra showing crosspeaks between the amine nitrogen and the beta carbon protons. Only those amino acids that have incorporated a significant amount of 15N-amine show crosspeak signals. d–f, Regions of 600 MHz 1D 1H spectra. Each proton peak is assigned as indicated. DSS, 2,2-dimethyl-2-silapentane-5-sulfonate. (a, d) Mixture of reference standards of the indicated amino acids, (b, e) K562 cell sample cultured in the medium containing (amine-15N)-glutamine and (c, f) K562 cell sample cultured in the non-labeled standard medium. g, Percentage of newly synthesized 15N-labeled BCAAs within total intracellular pool at 72 h after post-labeling for each amino acid indicated. “Total BCAAs” shows the percentage including all three BCAA species.
Extended Data Figure 5
Extended Data Figure 5. Roles of Bcat1 in differentiation, proliferation and leukemia development in vivo
a, RT-qPCR analysis of Bcat1 expression. Lin cells from NUP98-HOXA9/BCR-ABL-induced BC-CML were infected with shCtrl or Bcat1 shRNA (shBcat1-a and shBcat1-b) for 3 days and resorted for analysis of Bcat1 expression. The expression levels are normalized to the level of B2m expression and displayed relative to the control, which was arbitrarily set at 1. Error bars represent s.e.m. of triplicate PCRs. **p<0.01. b, RT-qPCR analysis of Bcat1 expression in leukemia cells isolated from diseased mice transplanted with shCtrl- or shBcat1-expressing BC-CML cells. The expression levels are normalized and displayed relative to the B2m control. ***p<0.001. c, Bcat2 expression in shBcat1-expressing cells. Lin cells from NUP98-HOXA9/BCR-ABL-induced BC-CML were infected with shCtrl or Bcat1 shRNA (shBcat1-a and shBcat1-b) for 3 days and resorted for analysis of Bcat2 expression. The expression levels are normalized to the level of B2m and are displayed relative to the control arbitrarily set at 1. Error bars represent the s.e.m. of triplicate PCRs. NS, not statistically significant (p>0.05). d, Functional rescue of the shBcat1-induced reduction in colony-forming ability with the expression of shRNA-resistant mutant Bcat1 cDNA. Primary Lin BC-CML cells transduced with the vector or shRNA-resistant Bcat1 gene together with the indicated shRNA constructs. **p<0.01 compared with the vector and shBcat1-b. e, f, Colony-forming ability of primary HSPCs. (e) Normal HSPCs purified from bone marrow based on their LSK phenotype were transduced with the Bcat1 shRNAs (shBcat1-a and shBcat1-b) and plated for colony formation. NS, not statistically significant (p>0.05). (f) Normal HSPCs were plated for colony formation with the indicated concentrations of gabapentin or PBS (-). NS, not statistically significant (p>0.05). **p<0.01 compared with the PBS control. Photomicrographs showing representative colonies formed under each condition. Scale bar, 500 μm. 300 LSK cells were plated per well in triplicate for the evaluation of colony-forming activity. Error bars indicate s.e.m. g, Hematoxylin and eosin staining of sections of the liver, lung and spleen at the time of onset of clinical signs (top 6 rows) and of tissue sections from a disease-free survivor (bottom 2 rows). White arrows indicate immature myeloid cells. Portal triad (PT), hemorrhagic necrosis (N), central veins (CV), arteriolar profiles (A), bile ducts (B), veins (V), white pulp (WP) and red pulp (RP) are indicated. Scale bars, 100 μm for images at 10x and 20 μm for images at 40x magnification. h, Representative flow cytometry plots showing lineage marker expression in leukemia cells from mice transplanted with the shRNA-infected BC-CML cells. Leukemia cells were analyzed for their frequency of the Lin population. i–k, Effect of conditional Bcat1 knockdown on BC-CML maintenance in vivo. (i) Lin BC-CML cells were infected with doxycycline-inducible shRNAs against shBcat1-b or a control (shCtrl) and transplanted into recipients (1,500 cells per recipient). After ten days of the transplantation with leukemia cells expressing the indicated constructs, (j) donor-derived chimerisms were analyzed. Mice were then fed with chow containing doxycycline to induce shRNA expression, and (k) survival was monitored. The data shown are from two independent experiments. n=4 for shCtrl with no Dox (DOX-); n=7 for shBcat1-b, DOX-; and n=9 each for shCtrl with Dox (DOX+) and shBcat1-b, DOX+. **p<0.01 (shCtrl vs shBcat1-b, DOX+). NS, not statistically significant (p>0.05). l, Cell cycle distribution of the shRNA-infected leukemia cells. Live leukemia cells were isolated from mice transplanted with shRNA-infected BC-CML cells, fixed and stained with propidium iodide for analysis of cell cycle distribution via flow cytometry. m, Apoptotic cells from leukemic mice transplanted with shRNA-infected BC-CML cells were analyzed via flow cytometry using Annexin V and 7-aminoactinomycin D (7-AAD) staining.
Extended Data Figure 6
Extended Data Figure 6. BCAT1 cooperates with BCR-ABL1 in blastic transformation in vivo
a, RT-qPCR analysis of Bcat1 expression in normal LSK or Lin c-Kit+ HSPCs transduced with either the vector or Bcat1 retroviruses. The expression levels are normalized and displayed relative to the control B2m expression. ***p<0.001. b, Normal LSK or Lin c-Kit+ HSPCs were purified from healthy bone marrow and transduced with the indicated retroviruses, and the infected cells were plated in triplicate to assess colony formation after 10 days. Error bars indicate s.e.m. NS, not statistically significant (p>0.05). c, Colony-forming ability of normal HSPCs expressing BCR-ABL1 and Bcat1. LSK cells were purified from healthy bone marrow and transduced with either the control vector or Bcat1 together with BCR-ABL1 (B/A) retroviruses, and double-positive cells were plated in triplicate to assess colony formation after 10 days (plated at a density of 150 cells/well). Photomicrographs showing representative colonies formed in each group. Scale bar, 500 μm. Error bars indicate s.e.m. ***p<0.001. d, Chimerism of donor–derived cells after transplantation with LSK cells expressing the indicated constructs. n=15 for each group. *p<0.05. e, Hematoxylin and eosin staining of liver, lung and spleen sections from mice transplanted with LSK cells expressing BCR-ABL1 and vector or Bcat1. White arrows indicate immature myeloid cells. Scale bars, 100 μm for 10x images and 20 μm for 40x images. f, Plasma α-amino acid levels in mice transplanted with LSK cells infected with BCR-ABL1 and the vector or Bcat1. Blood plasma fractions were prepared from peripheral blood samples, methanol-extracted and dried under a vacuum. The dried extracts were labeled with NBD-F and analyzed using an HPLC equipped with a fluorescence detector. Open and closed bars indicate vector-control (n=17) and Bcat1 (n=18) specimens, respectively. *p<0.05, **p<0.01. g, Representative flow cytometry plots showing lineage marker expression in leukemia cells from mice transplanted with LSK cells infected with either the control vector or Bcat1 together with BCR-ABL1. Leukemia cells were analyzed for their frequency of the Lin population.
Extended Data Figure 7
Extended Data Figure 7. BCAT1 is required for human myeloid leukemia
a, RT-qPCR analysis of BCAT1 expression in the human K562 BC-CML cell line transduced with lentiviral shCtrl or BCAT1 shRNA (shBCAT1-c and shBCAT1-d). The expression levels are normalized and displayed relative to the expression of the B2M control. **p<0.01. b, Western blot analysis of BCAT1 protein levels in K562 cells infected with the indicated lentiviral shRNA constructs. Human β-tubulin protein (β-Tub) was used as the loading control. β-Tub image is the same as shown in Fig. 3j. c, d, Colony-forming ability of (c) K562 cells transduced with control (shCtrl) or BCAT1 shRNAs (shBCAT1-c and shBCAT1-d) and (d) K562 cells cultured with the indicated concentrations of Gbp. One hundred cells were plated per well in triplicate. Photomicrographs show representative colonies formed. Scale bar, 200 μm. Error bars indicate s.e.m. **p<0.01, ***p<0.001. e, RT-qPCR analysis of BCAT1 expression in the samples from the BC-CML patient used in the data presented in Fig. 3d that were transduced with control (shCtrl) or BCAT1 shRNA (shBCAT1-d). ***p<0.001. f, Colony-forming ability of primary human CD34+ BC-CML cells from another patient specimen treated with Gbp. Error bars indicate s.e.m. **p<0.01. g–i, Colony-forming ability of (g) MV4-11, (h) U937 and (i) HL60 human AML cells treated with the indicated concentrations of Gbp. MV4-11, HL60 cells (300/well) or U937 (100/well) were plated in triplicate. Photomicrographs show representative colonies formed. Scale bars, 200 μm. Error bars indicate s.e.m. *p<0.05, **p<0.01, ***p<0.001. j, BCAT1 expression in human de novo AML patients. Data for BCAT1 expression levels from the TCGA AML dataset were divided into quartiles and were compared. On average, top quartile cohort showed 1.6-fold higher expression level than the bottom quartile. **p<0.01.
Extended Data Figure 8
Extended Data Figure 8. Impact of BCAT1 knockdown in K562 cells
a, b, Effect of (a) BCAT1 knockdown or (b) Gbp treatment on the intracellular concentrations of glutamate and BCAAs in K562 cells. The shCtrl or PBS control values were set as 100%. Error bars indicate s.e.m. n=10 each for (a) and n=3 each for (b). **p<0.01. c, AKT activation status in BCAT1- or MSI2-knockdown K562 cells. K562 cells treated with shCtrl, shBCAT1 or shMSI2 were analyzed by Western blotting for phospho-AKT (at Thr308 or Ser473), total AKT, hBCAT1, hMSI2 and HSP90 levels. d, Effect of alpha-ketoglutarate supplementation on the colony-forming ability of BCAT1-knockdown cells. K562 cells transduced with shCtrl (-) or shBCAT1-d (+) were plated in triplicate with or without 1 mM dimethyl-alpha-ketoglutarate (KG) and/or 4 mM BCAAs as indicated. n=3 technical replicates. Error bars indicate s.e.m. *p<0.05, **p<0.01. NS, not statistically significant (p>0.05).
Extended Data Figure 9
Extended Data Figure 9. MSI2 and BCAT1 expression in human cancer
a, Microarray data analysis of MSI2 expression in human CML. Gene expression data of chronic (gray, n=57), accelerated (pink, n=15) and blast crisis (blue, n=41) phase patients were retrieved from the NCBI GEO database (GSE4170). The bar represents the normalized expression value in each specimen. b, Co-expression analysis of the BCAT1 and MSI2 genes in human cancer. Pearson correlation coefficients were used to evaluate the extent of co-expression patterns. c, Schematic of the human BCAT1 transcript. The bars represent the putative MSI binding elements (MBEs; r(G/A)U1-3AGU). Forty MBEs were identified within the 3′-UTR of BCAT1. CDS, coding sequence for hBCAT1 protein. d, K562 cells infected with lentiviral shRNA against MSI2 (shMSI2) or shCtrl (-) were analyzed by Western blotting for phospho-S6 kinase (at Thr389; pS6K), total S6K, hMSI2 and HSP90 levels. Note that MSI2 knockdown reduced the levels of BCAT1 protein and phospho-S6K.
Figure 1
Figure 1. Activated BCAA production by BCAT1 in BC-CML
a, Intracellular amino acid levels in CP-CML (n=7, open bars) and BC-CML (n=9, closed bars). Amounts per 2 × 10⁵ cells. b, Bcat1 expression in normal and leukemic hematopoietic cells. Serial cDNA dilutions were used for RT-PCR analysis. Normal LSK cells, CP- and BC-CML cells, M1 myeloid cells and no reverse transcriptase (-RT) and water controls are shown. B2m, beta-2-microglobulin. c, BCAT1 protein expression in primary mouse leukemia (n=3 each). d, Schematics of the reaction catalyzed by BCAT1. KG, alpha-ketoglutarate. e–h, Intracellular Val production from KIV captured by 1H-13C HSQC analysis. (e, f) 1D (top) and 2D (bottom) HSQC spectra. The amounts of (g) 13C-KIV and (h) 13C-Val produced per one million cells are shown (n=3 each). i, 15N-amine incorporation into BCAAs. The amounts per one million cells. n=3 per time point. j, BCAT1-dependent production of BCAAs. The amounts of 15N-BCAAs produced are normalized with that of 15N-Glu/Gln. n=3 each. *p<0.05, **p<0.01, ***p<0.001 by two-tailed t-test. All data are mean ± s.e.m.
Figure 2
Figure 2. Bcat1 is essential for BC-CML propagation and differentiation arrest
a, b, Colony-forming ability of primary Lin BC-CML cells (a) transduced with the indicated shRNAs, or (b) plated with the indicated concentrations of gabapentin or vehicle (-). 1,000 cells/well (n=3). Photomicrographs show representative colonies formed under each condition. Scale bar, 500 μm. c, Bcat1 knockdown impaired BC-CML development in vivo. BC-CML cells expressing the indicated constructs were transplanted, and the survival of the recipients was monitored. shCtrl, n=20; shBcat1-a, n=19; shBcat1-b, n=16. d, g, Percentage of immature myeloblasts in leukemic mice. Photomicrographs of Wright’s stained leukemia cells. Arrowheads, immature myeloblasts; arrows, differentiating myelocytes and mature band cells. Scale bar, 10 μm. e, Survival curve of mice serially transplanted with Lin cells from primary shRNA-expressing leukemias. 1,000 cells/mouse (1k), n=10 for shCtrl, n=8 for shBcat1-a; and 3,000 cells/mouse (3k), n=9 for shCtrl, n=10 for shBcat1-a. f, Survival curve of mice transplanted with LSK cells infected with BCR-ABL1 and the vector-control or Bcat1. n=17 each. Inset, spleens from the indicated groups. Error bars indicate s.e.m. *p<0.05, **p<0.01, ***p<0.001 by two-tailed t-test (d, g) or log-rank test (c, e, f).
Figure 3
Figure 3. BCAT1 activation and requirement in human myeloid leukemia
a, BCAT1 expression in healthy subjects (n=5) and in patients with chronic and blast crisis CML (n=4 each) at IMSUT Hospital, the University of Tokyo. b–c, Microarray data analysis of (b) BCAT1 and (c) BCAT2 expression in 57 chronic (gray), 15 accelerated (pink) and 41 blast crisis (blue) phase patients. The bars represent the normalized expression in each specimen. d, e, Colony-forming ability of primary human BC-CML cells treated with (d) shBCAT1 or (e) Gbp. n=3 each. Two independent patient specimens were tested. f, BCAT1 expression in healthy subjects and de novo AML patients at IMSUT Hospital (n=5). g, Colony-forming ability of Gbp-treated primary human AML cells. h, Kaplan-Meier analysis of overall survival in the AML patient cohorts with low (bottom quartile) or high (top quartile) BCAT1 expression. n=93 in each cohort. i, BCAA supplementation augmented the colony-forming ability of BCAT1-knockdown K562 cells (n=3). j, Western blotting for the indicated proteins. K562 cells treated with shBCAT1-d or 20 mM Gbp for 24 h. (-), shCtrl or vehicle controls. k, Effect of BCAA on mTORC1 pathway activation in BCAT1-knockdown K562 cells. Cells were treated with or without BCAA or rapamycin, and analyzed at 24 h post-treatment. Error bars indicate s.e.m. NS, not statistically significant (p>0.05). *p<0.05, **p<0.01, ***p<0.001 by two-tailed t-test (d, e, g, i) or log-rank test (h).
Figure 4
Figure 4. RNA binding protein MSI2 mediates BCAT1 activation in BC-CML
a, b, RNA immunoprecipitation (RIP) with (a) anti-FLAG antibody from K562 cells expressing empty vector, FLAG-tagged MSI2 (WT) or FLAG-MSI2 with defective RNA binding domains (RBD), or (b) RIP with anti-MSI2 (αMSI2) or a control IgG (nIgG) from K562 cells. Co-immunoprecipitated RNAs were analyzed for the enrichment of BCAT1, beta-2-microglobulin (B2M) and c-MYC transcripts. n=3 each. c, d, Effect of (c) BCAT1 overexpression and (d) BCAA supplementation on the colony-forming ability of MSI2-knockdown K562 cells (n=3). (-), shCtrl or vehicle controls. e, Effect of nutrient supplementation on mTORC1 pathway activation in MSI2-knockdown K562 cells. f, Schematic model of the MSI2-BCAT1-BCAA axis in BC-CML. Error bars indicate s.e.m. *p<0.05, **p<0.01, by two-tailed t-test.

References

    1. Vander Heiden MG. Targeting cancer metabolism: a therapeutic window opens. Nat Rev Drug Discov. 2011;10:671–684. - PubMed
    1. DeBerardinis RJ, Thompson CB. Cellular metabolism and disease: what do metabolic outliers teach us? Cell. 2012;148:1132–1144. - PMC - PubMed
    1. Daley G, Van Etten R, Baltimore D. Induction of chronic myelogenous leukemia in mice by the P210bcr/abl gene of the Philadelphia chromosome. Science. 1990;247:824–830. - PubMed
    1. Dash AB, et al. A murine model of CML blast crisis induced by cooperation between BCR/ABL and NUP98/HOXA9. Proc Natl Acad Sci USA. 2002;99:7622–7627. - PMC - PubMed
    1. Brosnan JT, Brosnan ME. Branched-chain amino acids: enzyme and substrate regulation. J Nutr. 2006;136:207S–11S. - PubMed

References - Methods

    1. Domen J, Cheshier SH, Weissman IL. The role of apoptosis in the regulation of hematopoietic stem cells: Overexpression of Bcl-2 increases both their number and repopulation potential. J Exp Med. 2000;191:253–264. - PMC - PubMed
    1. Qin XF, An DS, Chen IS, Baltimore D. Inhibiting HIV-1 infection in human T cells by lentiviral-mediated delivery of small interfering RNA against CCR5. Proc Natl Acad Sci USA. 2003;100:183–188. - PMC - PubMed
    1. Mayotte N, Roy DC, Yao J, Kroon E, Sauvageau G. Oncogenic interaction between BCR-ABL and NUP98-HOXA9 demonstrated by the use of an in vitro purging culture system. Blood. 2002;100:4177–4184. - PubMed
    1. Neering SJ, et al. Leukemia stem cells in a genetically defined murine model of blast-crisis CML. Blood. 2007;110:2578–2585. - PMC - PubMed
    1. Ashton JM, et al. Gene Sets Identified with Oncogene Cooperativity Analysis Regulate In Vivo Growth and Survival of Leukemia Stem Cells. Cell Stem Cell. 2012;11:359–372. - PMC - PubMed

Publication types

LinkOut - more resources