. 2017 May 25;545(7655):477-481.
doi: 10.1038/nature22350. Epub 2017 May 17.

Identification of preoptic sleep neurons using retrograde labelling and gene profiling

Affiliations

Identification of preoptic sleep neurons using retrograde labelling and gene profiling

Shinjae Chung et al. Nature. .

Abstract

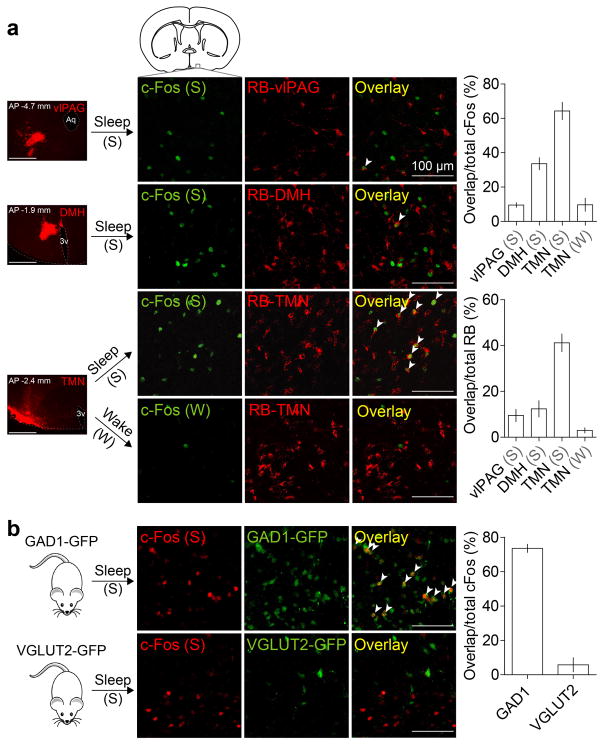
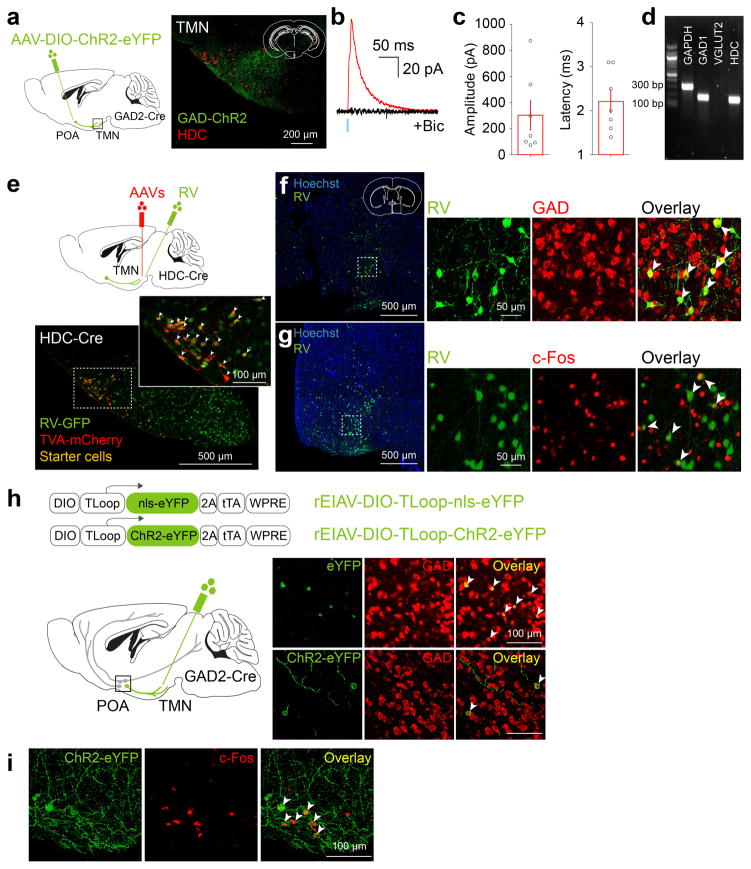
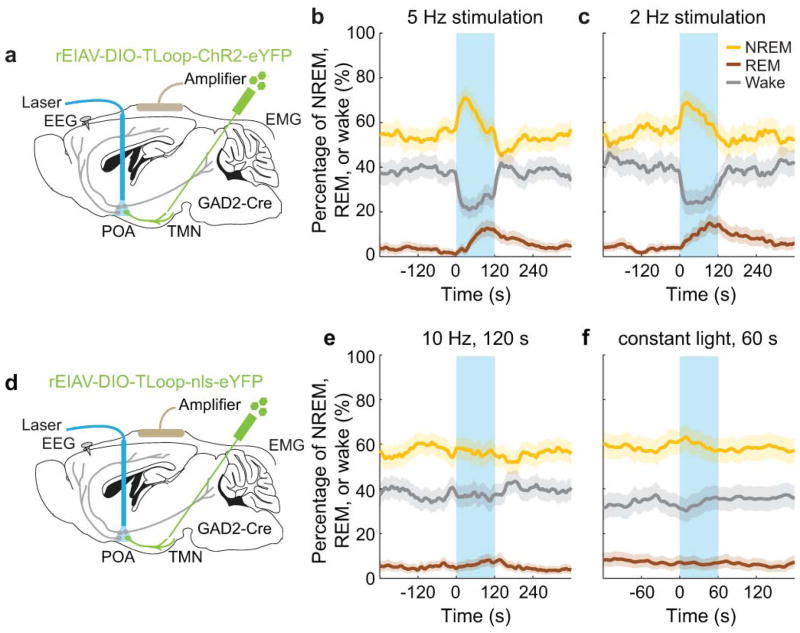
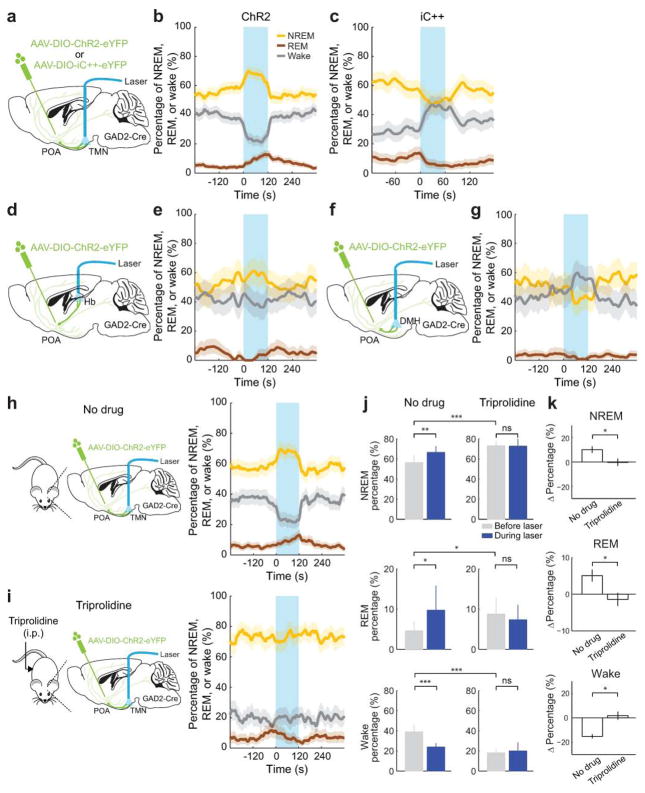
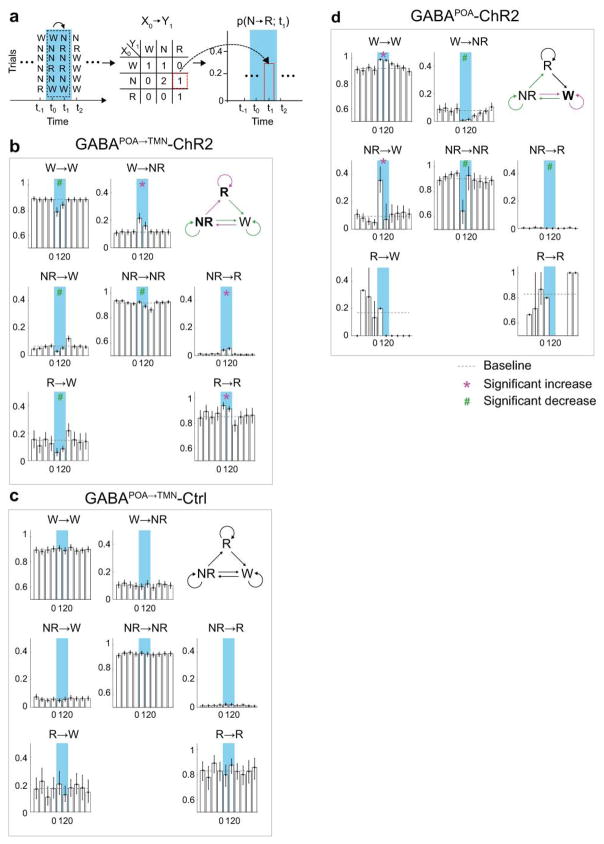
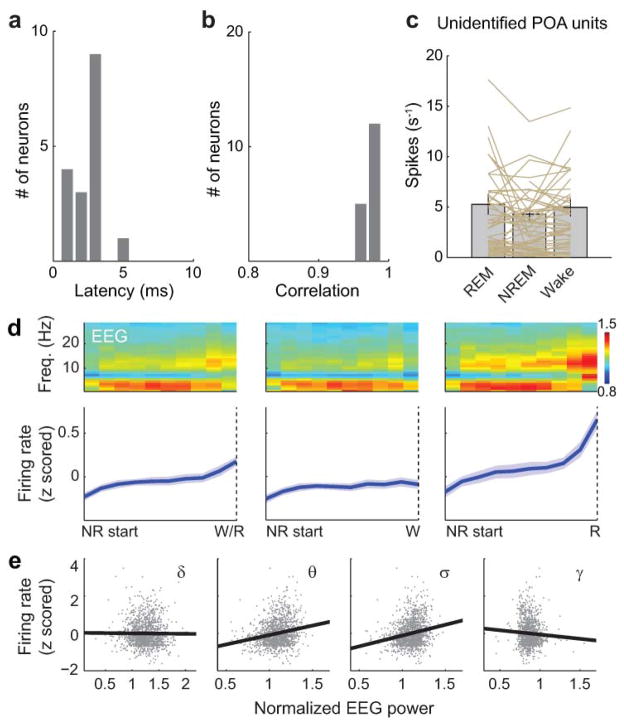
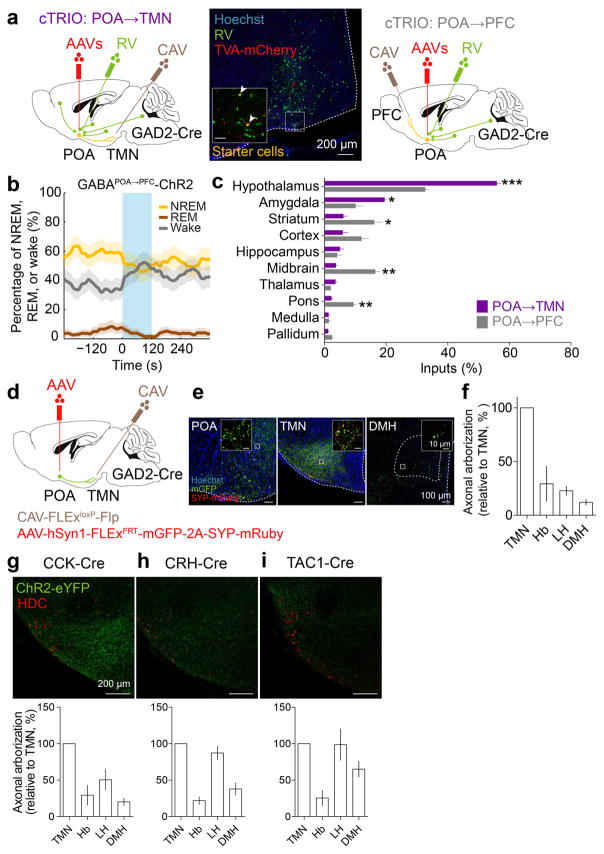
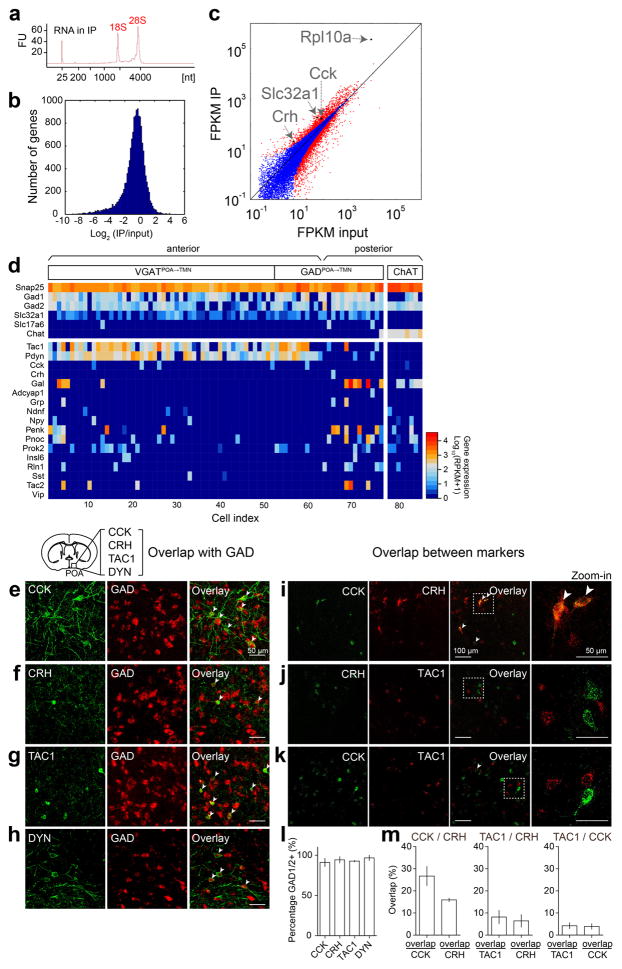
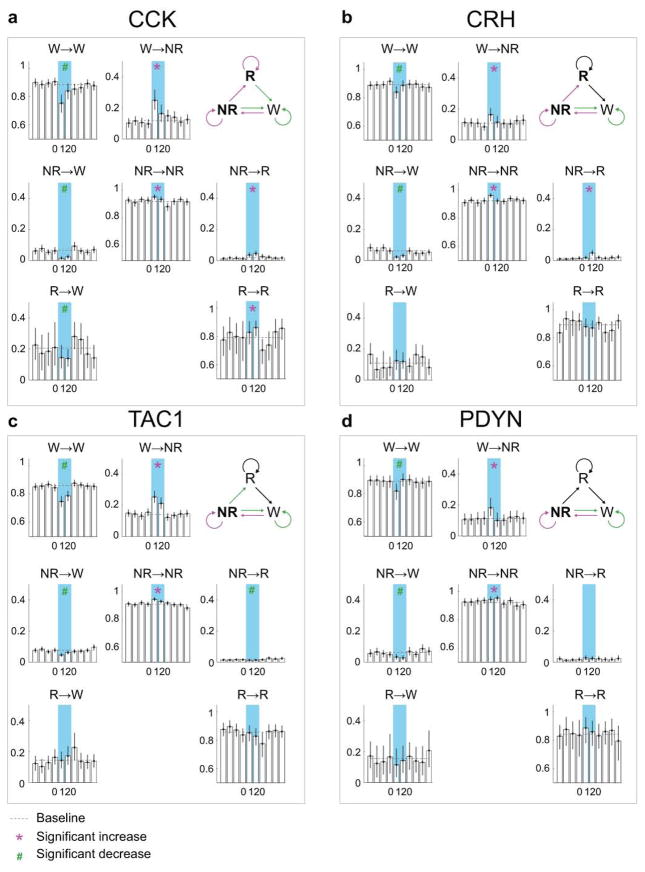
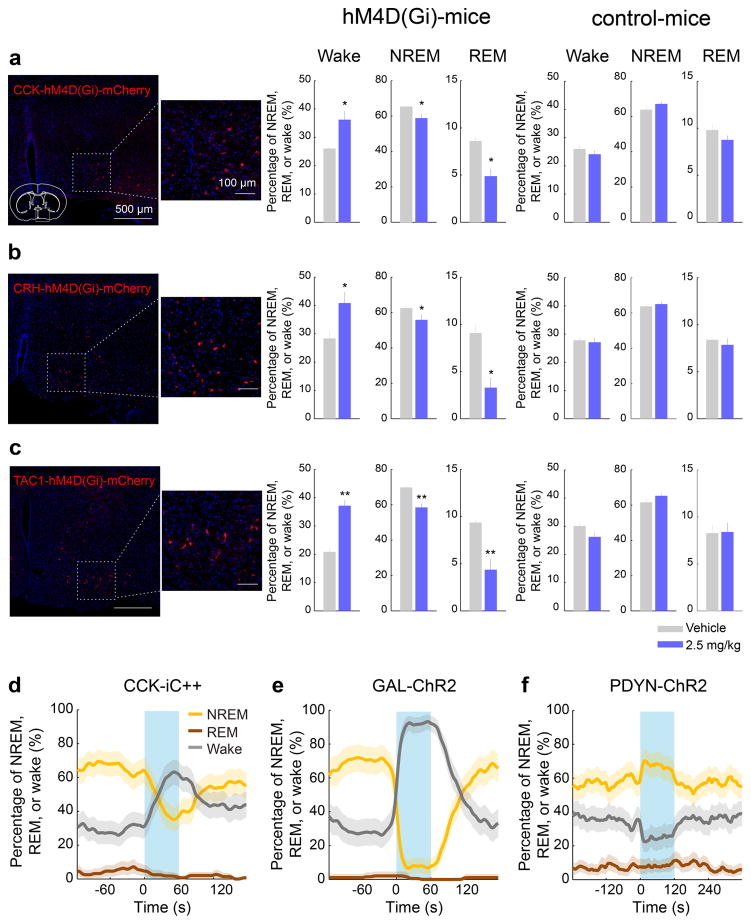
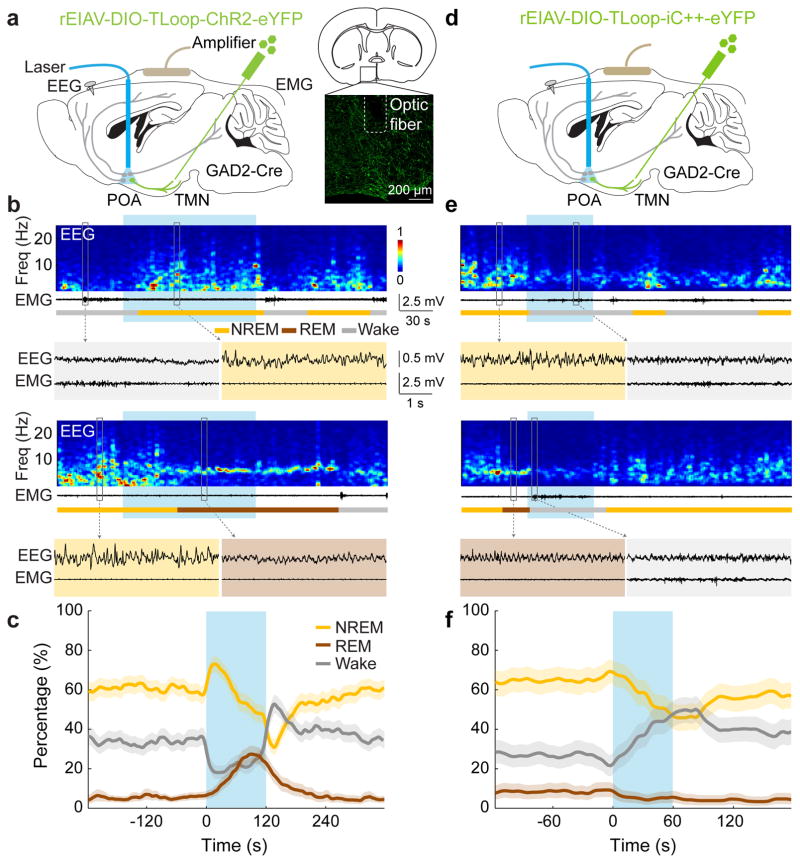
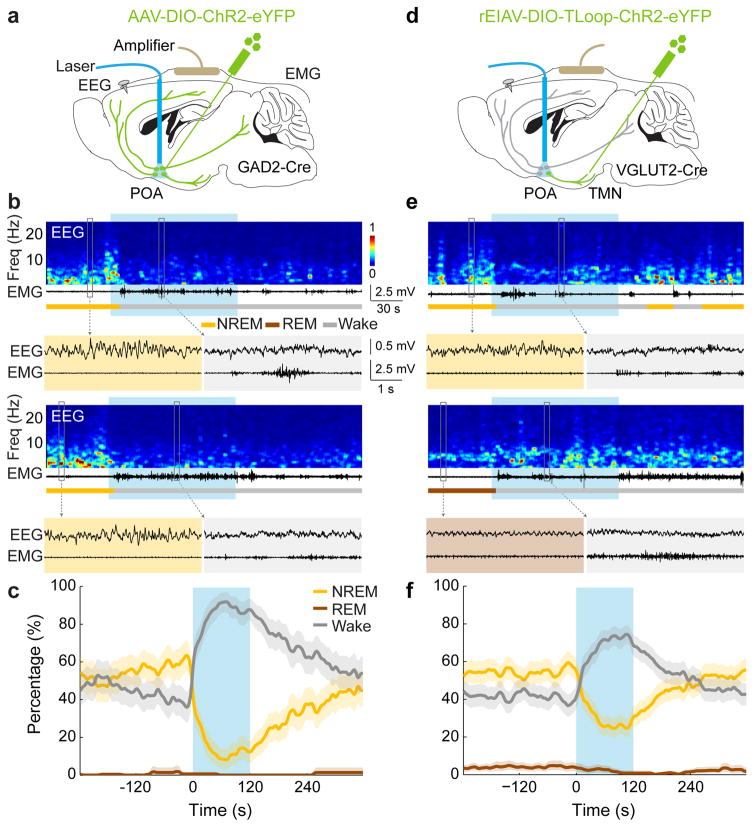
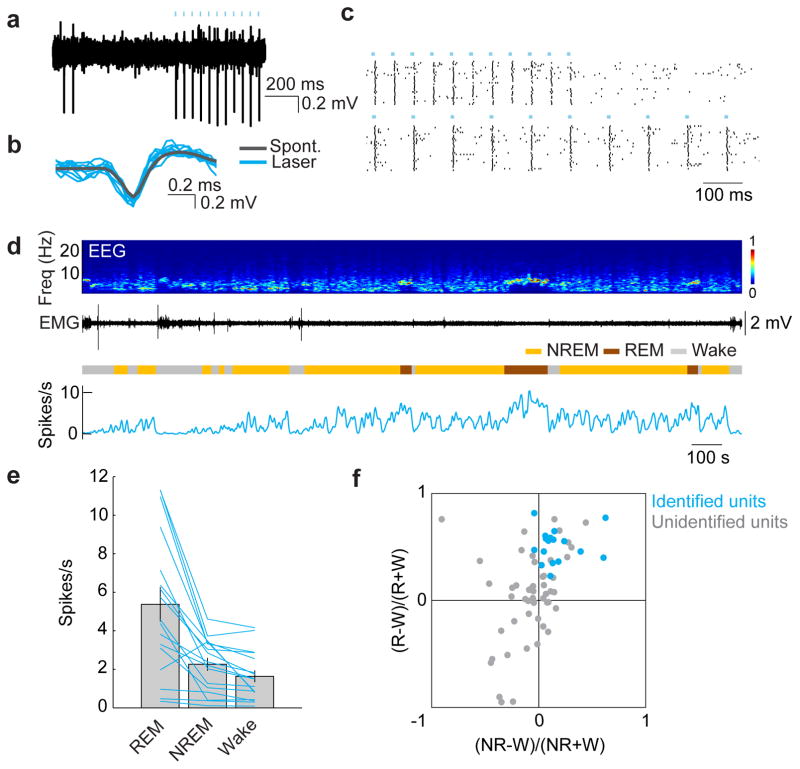
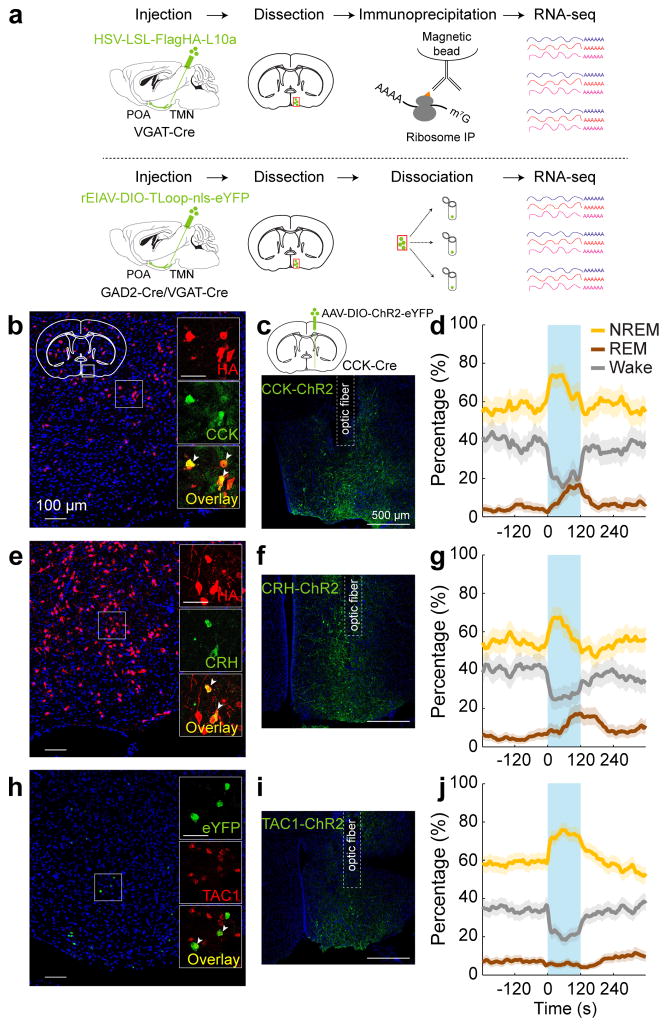
In humans and other mammalian species, lesions in the preoptic area of the hypothalamus cause profound sleep impairment, indicating a crucial role of the preoptic area in sleep generation. However, the underlying circuit mechanism remains poorly understood. Electrophysiological recordings and c-Fos immunohistochemistry have shown the existence of sleep-active neurons in the preoptic area, especially in the ventrolateral preoptic area and median preoptic nucleus. Pharmacogenetic activation of c-Fos-labelled sleep-active neurons has been shown to induce sleep. However, the sleep-active neurons are spatially intermingled with wake-active neurons, making it difficult to target the sleep neurons specifically for circuit analysis. Here we identify a population of preoptic area sleep neurons on the basis of their projection target and discover their molecular markers. Using a lentivirus expressing channelrhodopsin-2 or a light-activated chloride channel for retrograde labelling, bidirectional optogenetic manipulation, and optrode recording, we show that the preoptic area GABAergic neurons projecting to the tuberomammillary nucleus are both sleep active and sleep promoting. Furthermore, translating ribosome affinity purification and single-cell RNA sequencing identify candidate markers for these neurons, and optogenetic and pharmacogenetic manipulations demonstrate that several peptide markers (cholecystokinin, corticotropin-releasing hormone, and tachykinin 1) label sleep-promoting neurons. Together, these findings provide easy genetic access to sleep-promoting preoptic area neurons and a valuable entry point for dissecting the sleep control circuit.


Conflict of interest statement

The authors declare no competing financial interests.

Figures

Extended Data Figure 1
Extended Data Figure 1. Overlap of c-Fos staining of sleep-active POA neurons with retrograde labeling from several brain regions and with GAD1-GFP or VGLUT2-GFP
a, Overlap between c-Fos expression induced by sleep rebound (Sleep, n=5 mice) or sleep deprivation (Wake, n=3) and retrobead (RB) labeling from tuberomammillary nucleus (TMN), dorsomedial hypothalamus (DMH, n=3) or ventrolateral periaqueductal grey (vlPAG, n=3). Mouse brain figure adapted with permission from ref. . Left column, representative images showing RB injection sites (scale bars, 500 μm). Percentage of c-Fos+ neurons containing RB and percentage of RB-containing cells that were c-Fos+ were both significantly different among target regions (P<0.0001 and P=0.0004, one-way ANOVA followed by Dunnett’s post-hoc test). Many RB-labeled neurons from TMN expressed c-Fos following sleep but not following wake. b, Overlap between c-Fos expression induced by sleep rebound and GAD1-GFP (top panel, 5 mice) or VGLUT2-GFP (bottom panel, 3 mice). Many c-Fos+ cells were GAD1+ (arrowheads). Error bar, ±s.e.m.
Extended Data Figure 2
Extended Data Figure 2. Innervation of histamine neurons in the TMN by GABAergic neurons in the POA and overlap of lentivirus labeling of GABAPOA→TMN neurons with GAD expression and with c-Fos labeling after sleep rebound
a, In GAD2-Cre mice injected with AAV-DIO-ChR2-eYFP in the POA (left), ChR2-eYFP expressing axons (green) are observed in the TMN area (red, histidine decarboxylase (HDC)). Mouse brain figure adapted with permission from ref. . b, Inhibitory postsynaptic current (IPSC, red) recorded in an example TMN histamine neuron, evoked by optogenetic activation of POA GABAergic axons. Light-evoked responses (red) were blocked by bicuculline (black). Blue tick, laser stimulus. c, Amplitudes and latencies of IPSCs recorded from TMN histamine neurons (n=7, from 2 mice). Each symbol represents data from one cell. Error bar, ±s.e.m. d, Single cell reverse-transcription PCR (RT-PCR) identification of HDC-expressing histamine neurons. e, Schematic of RV-mediated transsynaptic retrograde tracing from TMN histamine neurons. Fluorescence image of the TMN shows starter cells (yellow, expressing both GFP and mCherry). Inset, enlarged view of the region in white box. f, Left, fluorescence image showing input neurons in the POA. Right, enlarged view of the region in white box, showing RV-GFP labeling (green) and GAD1/2 expression (red, FISH for mRNA encoding GAD1/2). Arrowheads, RV labeled cells that are GAD1/2+. 79.0±1.4 % of RV-GFP labeled neurons contained mRNA encoding GAD1/2 (n=2 mice). g, Overlap between c-Fos expression induced by sleep rebound and RV-GFP labeling. Left, fluorescence image showing input neurons in the POA. Right, enlarged view of the region in white box, showing RV-GFP labeling and c-Fos expression. 46.9±1.9% of RV-GFP labeled neurons expressed c-Fos (n=6 mice). h, Expression of eYFP or ChR2-eYFP in the POA induced by injecting rEIAV-DIO-TLoop-nls-eYFP or rEIAV-DIO-TLoop-ChR2-eYFP into the TMN of GAD2-Cre mice and their overlap with GAD1/2 expression (FISH for mRNA encoding GAD1/2). Arrowheads indicate cells co-labeled with GAD-FISH probe and eYFP or ChR2-eYFP. 96.2±1.4% of eYFP labeled neurons and 95.4±3.7% of ChR2-eYFP labeled neurons contained mRNA encoding GAD1/2 (n=4,5). i, Expression of ChR2-eYFP in the POA induced by injecting rEIAV-DIO-TLoop-ChR2-eYFP into the TMN of a GAD2-Cre mouse and its overlap with c-Fos expression following sleep rebound (arrowheads).
Extended Data Figure 3
Extended Data Figure 3. Effect of optogenetic activation of GABAPOA→TMN neurons at low frequencies and effect of laser stimulation in GABAPOA→TMN-eYFP control mice
a, Similar to Figure 1, rEIAV-DIO-TLoop-ChR2-eYFP was injected into the TMN of GAD2-Cre mice and an optic fiber was implanted into the POA for optogenetic stimulation. Mouse brain figure adapted with permission from ref. . b, Percentage of time the mice spent in wake, NREM, or REM state before, during, and after laser stimulation (blue shading, 5 Hz, 120 s), averaged from 5 mice (P<0.0001 for wake, REM and NREM, bootstrap). c, Similar to b, but with 2 Hz stimulation (P<0.0001 for wake and REM, P=0.002 for NREM, bootstrap, n=5 mice). d, Similar to a, after rEIAV-DIO-TLoop-nls-eYFP injection. e, Effect of 10 Hz stimulation in eYFP control mice. Shown is the percentage of time in wake, NREM, or REM state before, during, and after laser stimulation (blue shading, 10 Hz, 120 s), averaged from 8 mice (P=0.18, 0.84, and 0.35 for REM, NREM, and wake respectively, bootstrap). f, Effect of constant light stimulation (blue shading, constant light, 60 s), averaged from 5 mice (P=0.57, 0.27, and 0.73 for REM, NREM, and wake, bootstrap). Shading for each trace, 95% confidence interval (CI).
Extended Data Figure 4
Extended Data Figure 4. Optogenetic manipulation of axon projections of POA GABAergic neurons to TMN, DMH, and Hb and effect of anti-histamine on optogenetic activation of the TMN axon projections
a, AAV-DIO-ChR2-eYFP or AAV-DIO-iC++-eYFP was injected into the POA of GAD2-Cre mice and an optic fiber was implanted into the TMN for optogenetic activation/inhibition. Mouse brain figure adapted with permission from ref. . b, Percentage of time in wake, NREM, or REM state before, during, and after laser stimulation (blue shading, 10 Hz, 120 s) in mice expressing ChR2, averaged from 9 mice (P<0.0001 for wake, REM and NREM, bootstrap). Shading for each trace, 95% confidence interval (CI). c, Similar to b, but in mice expressing iC++ (blue shading: constant light, 60 s), averaged from 4 mice (P<0.0001 for wake and NREM, P=0.004 for REM, bootstrap). d, Schematic for optogenetic activation of POA GABAergic projection to the habenula (Hb). e, Similar to b, for activating POA→Hb projection (P=0.28, 0.35 and 0.72 for REM, wake and NREM, bootstrap, n=3 mice). f, Schematic for optogenetic activation of POA GABAergic projection to the dorsomedial hypothalamus (DMH). g, Similar to b, for POA→DMH activation (P=0.02, 0.12, and 0.09 for wake, REM, and NREM, n=3 mice). h, Left, schematic for optogenetic activation of POA GABAergic projection to the TMN without drug treatment. Right, percentage of time in wake, NREM, or REM state before, during, and after laser stimulation (blue shading, 10 Hz, 120 s) in mice with no drug (effect of laser: P<0.001 for wake, REM and NREM, bootstrap; n=14 mice). i, Similar to h, but after injection of triprolidine (20 mg/kg, i.p.; effect of laser: P=0.21, 0.84, 0.57 for wake, REM and NREM, n=5 mice). j, Percentage of time in NREM, REM or wake state before and during laser stimulation in no drug and triprolidine groups (120 s periods before and during laser stimulation, *P<0.05, **P<0.01, ***P<0.001; ns, P>0.05, signed rank test between before and during laser, rank sum test between no drug and triprolidine for the period before laser stimulation). k, Laser-induced change in the percentage of each state (difference between the 120s periods before and during laser stimulation, *P<0.05, rank sum test). Error bar, ±s.e.m.
Extended Data Figure 5
Extended Data Figure 5. Effect of laser stimulation on transition probability between each pair of brain states in GABAPOA→TMN-ChR2, GABAPOA→TMN-Ctrl and GABAPOA-ChR2 mice
a, Schematic showing transition probability calculation. To calculate the transition probability at a given time bin (i), we first identified all the trials (n) in which the animal was in state X (X could be wake, NREM, or REM) in the preceding time bin (i−1). Among these n trials, we identified the subset of trials (m) in which the animal transitioned into state Y in the current time bin (i). The XY transition probability for time bin (i) was computed as m/n. b, Transition probability within each 10 s period in GABAPOA→TMN-ChR2 mice (n=9). Shown in each bar is the transition probability averaged across 6 consecutive 10 s bins within each 60 s. Error bar, 95% confidence interval (CI) (bootstrap). The baseline transition probability (grey dashed line) was averaged across all time bins after excluding the laser stimulation period. Direct wake →REM and REM→NREM transitions were not observed and the corresponding plots were omitted. Magenta*/green# indicates significant increase/decrease in transition probability during laser stimulation compared to the baseline (P<0.05, bootstrap). Top right diagram indicates transition probabilities that are significantly increased (magenta), decreased (green) or unaffected (black) by laser stimulation. c, Transition probability in control mice (n=8). The probability during laser stimulation was not significantly different from baseline for any transition. d, Transition probability in GABAPOA-ChR2 mice (n=5).
Extended Data Figure 6
Extended Data Figure 6. Optogenetic identification of GABAPOA→TMN neurons, firing rates of unidentified POA neurons and firing rate dynamics of identified GABAPOA→TMN neurons during NREM sleep
a, Distribution of delays in laser-evoked spiking for all identified neurons. Delay is defined as timing of the first spike after each laser pulse. b, Distribution of correlation coefficient between laser-evoked and spontaneous spike waveforms for all identified neurons. c, Firing rates of unidentified units in the three brain states. Each line represents data from one neuron. Grey bar represents average over units (n=51, from 11 mice). Error bar, ±s.e.m. d, Firing rate change of identified GABAPOA→TMN neurons during each NREM episode. Upper panel, mean EEG power spectrogram from start to end of each NREM episode. Lower panel, mean firing rate of the recorded neurons. Left, average across all NREM episodes. Each NREM period was divided into 10 time bins (temporally normalized). The firing rate of each neuron was z-scored and averaged across all recorded NREM episodes. Solid line, mean of 17 neurons, shading, ±s.e.m. To test significance of the firing rate increase during NREM episodes, for each unit we measured the slope of its mean firing rate vs. time after NREM onset, as quantified by a linear fit. Across the 17 units recorded, the increase (slope>0) was significant (P=1.0 × 10⁻⁵, t-test). Middle and Right, similar to left, for the subset of NREM episodes preceding wakefulness (P=0.0089) and that preceding REM sleep (P<10−5). The increase in firing rate was stronger for NREM episodes preceding REM sleep than those preceding wakefulness (P=0.0003, paired t-test). e, Correlation between firing rate and EEG power in different frequency bands (delta, 0.5–4 Hz; theta, 4–12 Hz; sigma, 9–25 Hz and gamma, 40–120 Hz) during NREM sleep. The firing rate of each neuron was z-scored, and the power within each frequency band was normalized by its mean across each recording session. Firing rates and EEG power in each frequency band were discretized in 2.5 s bins. For each bin assigned to NREM sleep, we plotted the power in each frequency bands vs. the corresponding firing rate. Linear regression was used to determine whether the power in each frequency band and the firing rate are positively or negatively correlated. The correlation was positive for theta (P<10−5) and sigma (P<10−5), negative for gamma (P<10−5), and not significant for delta (P=0.58).
Extended Data Figure 7
Extended Data Figure 7. Mapping of monosynaptic inputs and axon projections of GABAPOA→TMN neurons and axon projections of POA CCK, CRH, TAC1 neurons
a, Schematic of cTRIO to map monosynaptic inputs to GABAPOA→TMN (left) or GABAPOA→PFC (right) neurons. Mouse brain figure adapted with permission from ref. . Middle, coronal section of a mouse brain at the POA stained with Hoechst (blue). A region within the square is magnified in the inset. Arrowheads indicate starter cells (yellow) at the injection site (scale bar in inset, 50μm). b, Optogenetic activation of GABAPOA→PFC neurons. Shown is the percentage of time in wake, NREM, or REM state before, during, and after laser stimulation (blue shading, 10 Hz, 120 s), averaged from 6 mice (P<0.001 for wake and NREM, P=0.003 for REM, bootstrap). Shading for each trace, 95% CI. c, Average fractional inputs in cTRIOPOA→TMN (purple) or cTRIOPOA→PFC (grey) tracing (P=0.0002 for hypothalamus, P=0.02 for amygdala, P=0.03 for striatum, P=0.001 for midbrain, P=0.003 for pons, t-test). n=3 mice in each group. Error bar, ±s.e.m. d, Schematic of the axon projection mapping experiment. e, Coronal sections containing POA, TMN, and DMH regions stained with Hoechst (blue). A region within the square is magnified in the inset. Red, synaptophysin-mRuby; green, mGFP. f, Projection levels (quantified by mGFP-labeled axonal arbors) in different brain areas normalized by that in the TMN. Shown are only areas with projections > 10% of the TMN projection. Hb, habenula; LH, lateral hypothalamus; DMH, dorsomedial hypothalamus. n=3 mice. g–i, Axon projections of POA CCK, CRH, TAC1 neurons. Upper panel, coronal section containing the TMN region. Red, immunostaining for HDC showing histaminergic neurons. Lower panel, projection levels (quantified by eYFP-labeled axonal arbors) in different brain areas normalized by that in the TMN. n=3,3,4 mice respectively.
Extended Data Figure 8
Extended Data Figure 8. Identification of genetic markers for GABAPOA→TMN neurons using TRAP and single-cell RNA-seq, and overlap between each identified marker and GAD and between the markers in the POA
a, TRAP, shown is bioanalyzer trace of immunoprecipitated RNA. FU, fluorescence units. b, Histogram display of differentially expressed genes (IP/input). c, FPKM (fragments per kilobase of transcript per million mapped reads) IP vs. FPKM input (log scale). Several marker genes enriched in GABAPOA→TMN neurons (Cck, Crh, Slc32a1, Rpl10a) are highlighted. Red dots, genes that are significantly different in IP vs. input (P<0.05, Fisher’s exact test); blue dots, non-significant genes. d, Single-cell RNA-seq, shown is heat map of expression levels of several cell-type markers (e.g., Gad1, Gad2, Slc32a1, Slc17a6, and Chat) and all neuropeptide-encoding genes (based on the list of ref. plus Gal) in cholinergic neurons in the nucleus basalis and eYFP-labeled GABAPOA→TMN neurons in the POA. Tac1 and Pdyn are highly expressed in GABAPOA→TMN neurons. RPKM, reads per kilobase of transcript per million mapped reads. e–h, Overlap between each identified marker and GAD. A representative image showing overlap between CCK-ChR2-eYFP (e), CRH-eYFP (f), TAC1-eYFP (g), DYN-ChR2-eYFP (h) and FISH for mRNA encoding GAD1/2. Arrowheads indicate cells co-labeled with GAD1/2 probe and eYFP. Mouse brain figure adapted with permission from ref. . i–k, Overlap between the markers. A representative image showing overlap between CCK and CRH (i), CRH and TAC1 (j) or CCK and TAC1 (k) using double FISH for both peptides. Arrowheads indicate co-labeled cells. l, Percentage of cells expressing each peptide marker that are GAD1/2 positive (n=2 or 3 mice per marker). m, Quantification of overlap between CCK and CRH, TAC1 and CRH or TAC1 and CCK (n=3 mice per pair). Error bar, ±s.e.m.
Extended Data Figure 9
Extended Data Figure 9. Effect of laser activation of CCK, CRH, TAC1, and PDYN neurons on transition probability between each pair of brain states
a, Transition probability within each 10 s period in CCK neuron activation experiment. Error bar, 95 % CI (bootstrap). n=4 mice. b–d, Similar to a, for CRH, TAC1, and PDYN neuron activation. n=5,7,5 mice respectively.
Extended Data Figure 10
Extended Data Figure 10. Pharmacogenetic inactivation of CCK, CRH, and TAC1 neurons, optogenetic inactivation of CCK neurons, optogenetic activation of GAL neurons and optogenetic activation of PDYN neurons in the POA
a, Pharmacogenetic inactivation of CCK neurons. Left, a representative image showing hM4D(Gi)-mCherry expression in the POA of a CCK-Cre mouse and an enlarged view of the region in white box. Mouse brain figure adapted with permission from ref. . Middle, effect of CNO injection in CCK-Cre mice expressing hM4D(Gi). Each bar shows the percentage of time in each brain state during the first 4 hrs of the recording session, after injection of vehicle (grey) or CNO (blue). Error bar, ± s.e.m. (n=6 mice, P=0.022, 0.025, 0.044 for REM, Wake, and NREM, paired t-test). Right, effect of CNO injection in control CCK-Cre mice not expressing hM4D(Gi) (n=4 mice, P=0.27, 0.46, and 0.29 for REM, Wake, and NREM, paired t-test). The effect of CNO was significantly different between hM4D(Gi)-expressing and control mice (P=0.006, 0.036, and 0.014 for REM, Wake, and NREM, t-test). b, Similar to a, for CRH neuron inactivation (n=6 mice, P=0.015, 0.018, 0.024). For control, n=5 mice; P=0.58, 0.41, and 0.12. Difference between hM4D(Gi) and control, P=0.003, 0.03 and 0.014. c, For TAC1 neuron inactivation (n=6 mice, P=0.0057, 0.0026, 0.0095). For control, n=4 mice; P=0.92, 0.13, and 0.06. Difference between hM4D(Gi) and control, P=0.001, 0.005 and 0.037. d, Optogenetic inhibition of POA CCK neurons suppresses sleep and enhances wakefulness. Shown is percentage of time in wake, NREM, or REM state before, during, and after laser stimulation (blue shading, constant light, 60 s), averaged from 4 mice (P<0.0001 for wake and NREM, P=0.008 for REM, bootstrap). e, Similar to d, with laser stimulation of POA GAL neurons (blue shading, 10 Hz, 60 s), averaged from 4 mice (P<0.0001 for increase in wakefulness, bootstrap). f, Similar to d, with optogenetic stimulation of POA PDYN neurons (blue shading, 10 Hz, 120 s), averaged from 5 mice (P=0.42, 0.002, and 0.0003 for REM, NREM, and wake, bootstrap). Shading for each trace, 95% CI.
Figure 1
Figure 1. Optogenetic activation/inhibition of GABAPOA→TMN neurons enhances/suppresses sleep
a, Schematic of optogenetic activation experiment. Right panel, fluorescence image of POA (box in schematic) in a GAD2-Cre mouse with rEIAV-DIO-TLoop-ChR2-eYFP injected into the TMN. Mouse brain figure adapted with permission from ref. . b, Two example trials. Shown are EEG power spectra, EMG traces, brain states (color coded), and EEG, EMG traces during selected periods (indicated by boxes) on an expanded time scale. Blue shading, laser stimulation (10 Hz, 120 s). c, Percentage of time in wake, NREM, or REM state before, during, and after laser stimulation (blue shading), averaged from 9 mice (P<0.0001 for laser-induced change from wake to sleep states, bootstrap). d, Schematic of optogenetic inhibition experiment. e, Two example trials. Blue shading, laser stimulation (constant light, 60 s). f, Percentage of time in wake, NREM, or REM state before, during, and after laser stimulation, averaged from 4 mice (P<0.0001 for wake, P=0.003 and 0.002 for REM and NREM, bootstrap). Shading for each trace, 95% confidence interval (CI).
Figure 2
Figure 2. Optogenetic activation of GABAPOA or VGLUTPOA→TMN neurons promotes wakefulness
a, Schematic for optogenetic stimulation of GABAPOA neurons. Mouse brain figure adapted with permission from ref. . b, Two example trials. Blue shading, laser stimulation (10 Hz, 120 s). c, Percentage of time in wake, NREM, or REM state, averaged from 5 mice (P<0.0001 for increased wakefulness, bootstrap). Shading, 95% CI. d–f, Similar to a–c, for optogenetic stimulation of VGLUTPOA→TMN neurons (P<0.0001 for increase in wakefulness, bootstrap, n=4 mice).
Figure 3
Figure 3. Optogenetically identified GABAPOA→TMN neurons are active during sleep
a, Example recording of spontaneous and laser-evoked spikes from a GABAPOA→TMN neuron. Blue ticks, laser pulses. b, Comparison between laser-evoked (blue) and averaged spontaneous (grey) spike waveforms. c, Spike raster showing multiple laser stimulation trials at 10 and 20 Hz. d, Firing rates of an example GABAPOA→TMN neuron. e, Firing rates of 17 identified GABAPOA→TMN neurons during different brain states. Each line shows firing rates of one unit; grey bar, average across units. Error bar, ±s.e.m. f, Firing rate modulation of 17 identified (blue, from 7 mice) and 51 unidentified (grey, 11 mice) units. W, wake; R, REM; NR, NREM.
Figure 4
Figure 4. Identification of molecular markers for POA sleep neurons
a, Schematics of TRAP (upper) and single-cell RNA-seq (lower) for gene profiling. Mouse brain figure adapted with permission from ref. . b, Overlap between HA labeling of GABAPOA→TMN neurons and CCK expression. Shown is a coronal section at the POA stained with HA antibody (red) and Hoechst (blue). Region within the square is magnified (inset; scale bar, 50 μm). Arrowheads, HA-labeled neurons stained with CCK antibody; 49.1±7.5% of HA+ neurons are CCK+ (n=3 mice). c, Schematic of optogenetic activation of POA CCK neurons (top) and a fluorescence image of POA in a CCK-Cre mouse injected with AAV-DIO-ChR2-eYFP. d, Percentage of time in wake, NREM, or REM state before, during, and after optogenetic stimulation (blue shading, 10 Hz, 120 s) of CCK neurons (P=0.0007 for REM, P<0.0001 for NREM and wake, bootstrap; n=4 mice). e, Overlap between HA labeling and CRH expression. 17.1±1.9% of HA-labeled neurons are CRH+ (arrowheads; n=3 mice). f, A fluorescence image of POA in a CRH-Cre mouse injected with AAV-DIO-ChR2-eYFP. g, Percentage of time in wake, NREM, or REM state, averaged from 5 CRH-Cre mice (P=0.0014 for NREM, P<0.0001 for REM and wake). h, Overlap between eYFP labeling of GABAPOA→TMN neurons and TAC1 expression. Arrowheads, eYFP+ neurons expressing TAC1 (fluorescence in situ hybridization, n=2 mice). i, A fluorescence image of POA in a TAC1-Cre mouse injected with AAV-DIO-ChR2-eYFP. j, Percentage of time in wake, NREM, or REM state, averaged from 7 TAC1-Cre mice (P<0.0001 for NREM and wake). Shading, 95% CI.

Similar articles

Cited by

References

    1. Von Economo C. Sleep as a problem of localization. J Nerv Ment Dis. 1930;71:249–259.
    1. Nauta WJ. Hypothalamic regulation of sleep in rats; an experimental study. J Neurophysiol. 1946;9:285–316. - PubMed
    1. McGinty DJ, Sterman MB. Sleep suppression after basal forebrain lesions in the cat. Science. 1968;160:1253–1255. - PubMed
    1. Sallanon M, et al. Long-lasting insomnia induced by preoptic neuron lesions and its transient reversal by muscimol injection into the posterior hypothalamus in the cat. Neuroscience. 1989;32:669–683. - PubMed
    1. Lu J, Greco MA, Shiromani P, Saper CB. Effect of lesions of the ventrolateral preoptic nucleus on NREM and REM sleep. J Neurosci. 2000;20:3830–3842. - PMC - PubMed

Publication types

MeSH terms