. 2017 Jun 8;546(7657):259-264.
doi: 10.1038/nature22363. Epub 2017 May 17.

Structure of the full-length glucagon class B G-protein-coupled receptor

Affiliations

Structure of the full-length glucagon class B G-protein-coupled receptor

Haonan Zhang et al. Nature. .

Abstract

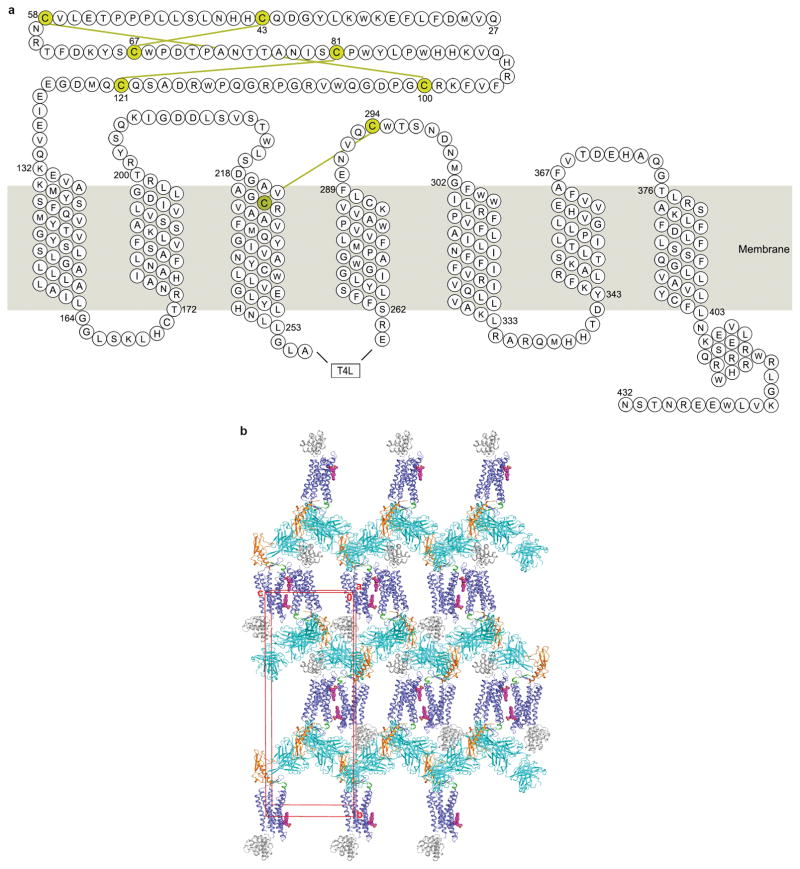
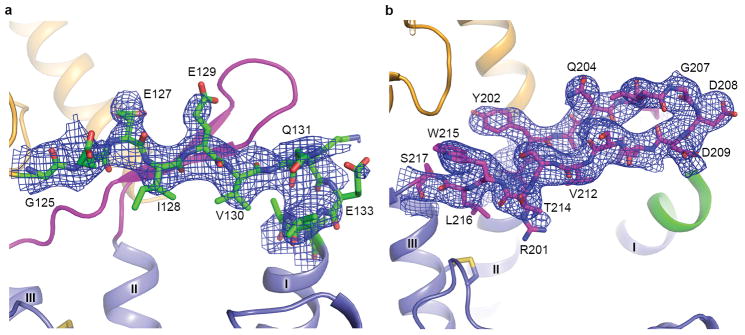
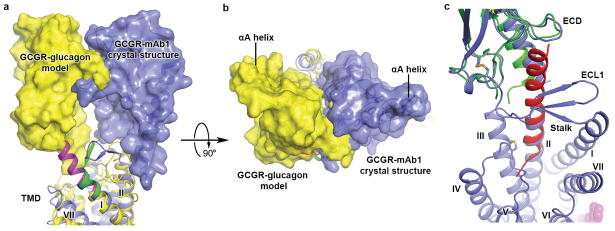
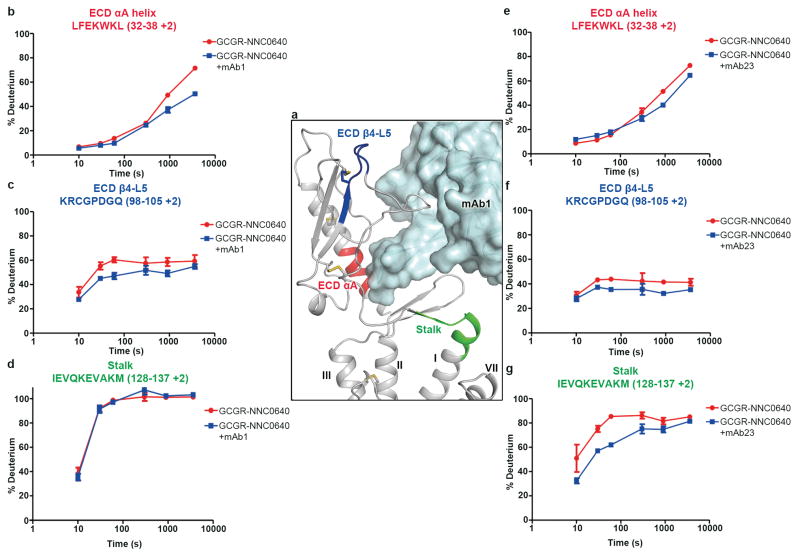
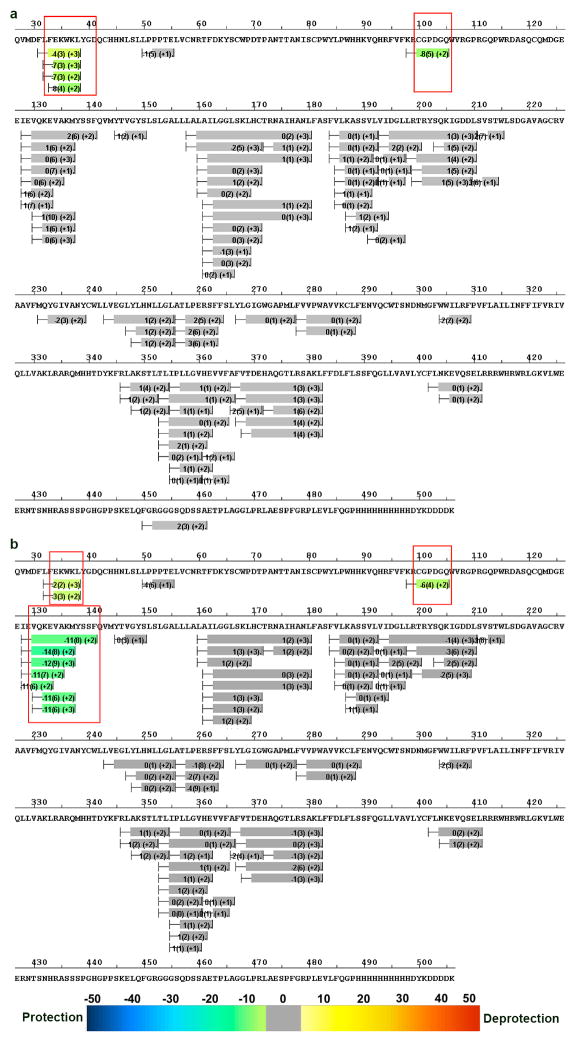
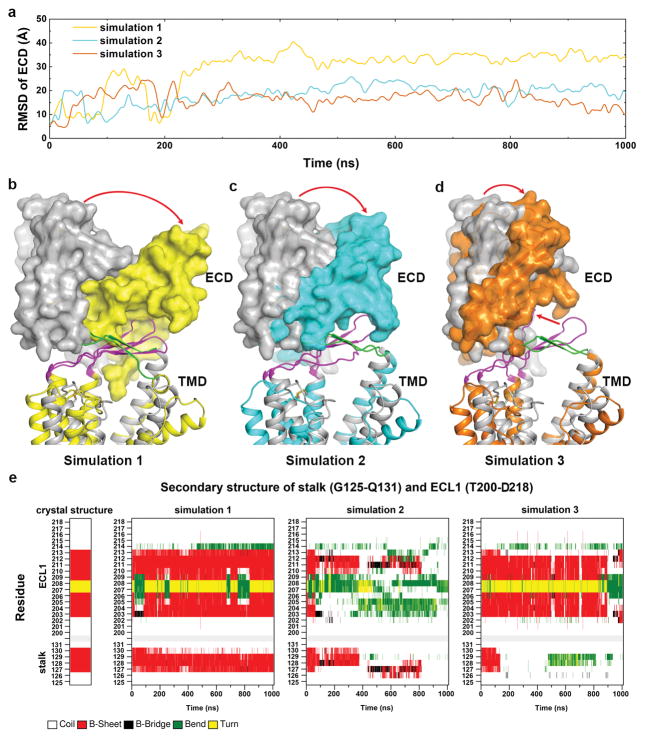
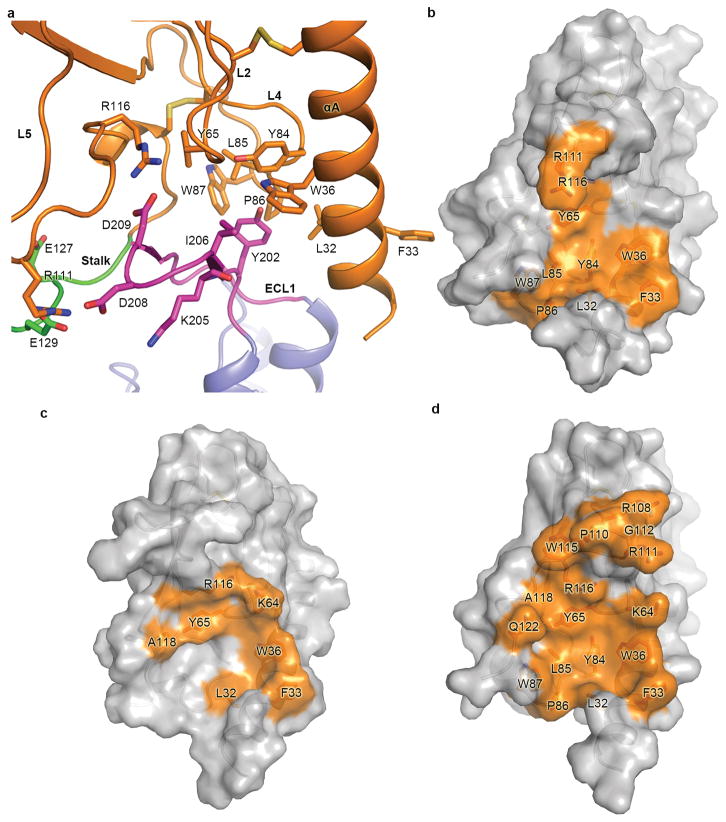
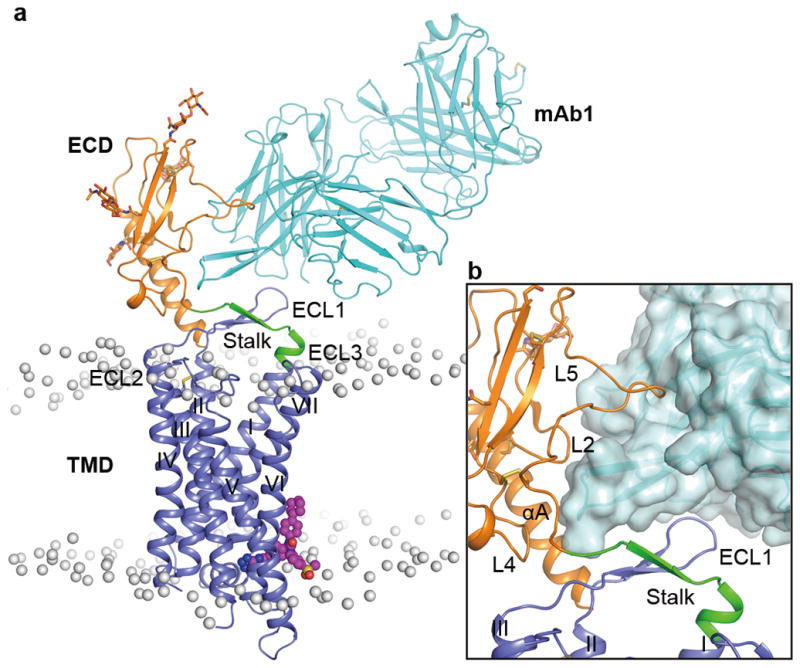
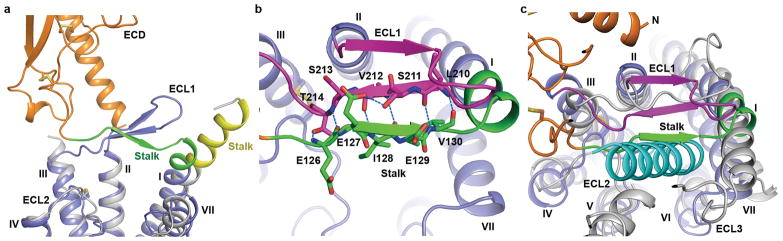
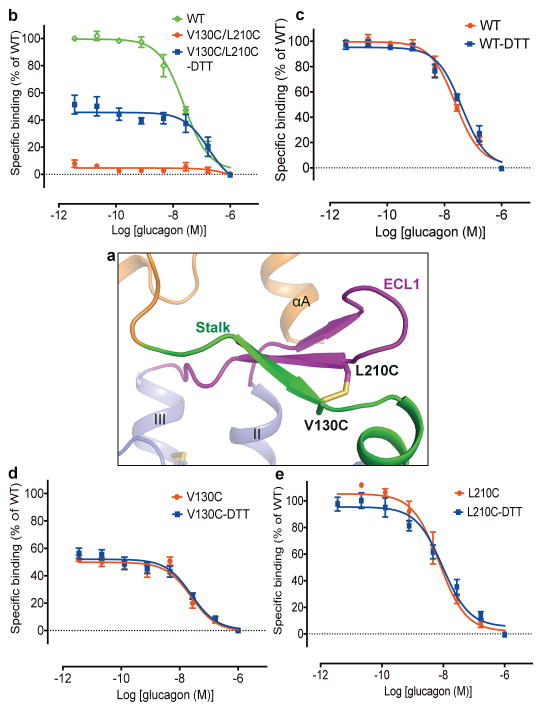
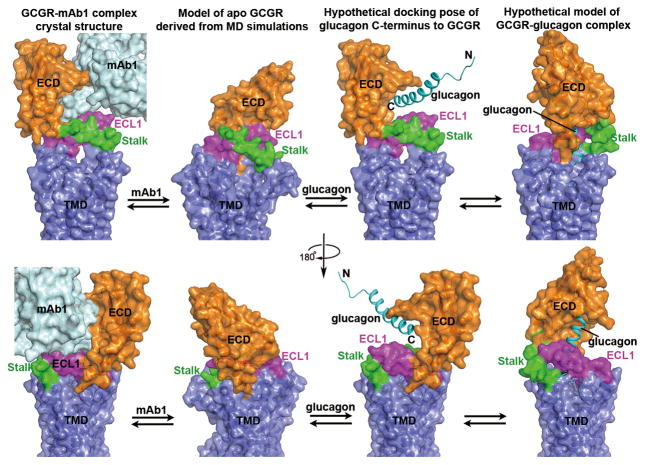
The human glucagon receptor, GCGR, belongs to the class B G-protein-coupled receptor family and plays a key role in glucose homeostasis and the pathophysiology of type 2 diabetes. Here we report the 3.0 Å crystal structure of full-length GCGR containing both the extracellular domain and transmembrane domain in an inactive conformation. The two domains are connected by a 12-residue segment termed the stalk, which adopts a β-strand conformation, instead of forming an α-helix as observed in the previously solved structure of the GCGR transmembrane domain. The first extracellular loop exhibits a β-hairpin conformation and interacts with the stalk to form a compact β-sheet structure. Hydrogen-deuterium exchange, disulfide crosslinking and molecular dynamics studies suggest that the stalk and the first extracellular loop have critical roles in modulating peptide ligand binding and receptor activation. These insights into the full-length GCGR structure deepen our understanding of the signalling mechanisms of class B G-protein-coupled receptors.


Figures

Extended Data Figure 1
Extended Data Figure 1. Snake plot of the GCGR construct used for crystallization and crystal packing of the GCGR-NNC0640-mAb1 complex structure
a, Snake plot of the GCGR-T4L fusion construct used for crystallization. The eight cysteine residues forming disulfide bonds are shown in yellow with four yellow lines illustrating the disulfide bonds. b, Crystal packing of the GCGR-NNC0640-mAb1 complex structure. GCGR and mAb1 are shown in cartoon representation. The ECD, stalk and TMD of the receptor are colored in orange, green and blue, respectively. The T4L fusion is in grey and mAb1 is in cyan. NNC0640 is displayed as magenta spheres. The unit cell is shown as a red box.
Extended Data Figure 2
Extended Data Figure 2. Binding of [3H]-NNC0640 and [125I]-glucagon to WT and mutant GCGRs and glucagon-induced cAMP assays
a, Binding of [3H]-NNC0640 to membrane preparations from Sf9 cells expressing WT and the engineered GCGR for crystallization. Data are shown as means ± S.E.M. from three independent experiments performed in duplicate. “Construct” indicates the construct used for crystallization, containing the T4L fusion at ICL2 and 45 residues truncated at the C-terminus of the receptor. b, Binding of [3H]-NNC0640 to membrane preparations from HEK293T cells expressing WT and mutant GCGRs. Data are shown as means ± S.E.M. from three independent experiments performed in duplicate. The IC50 values for the WT and mutant GCGRs from at least three independent experiments are listed in Extended Data Table 2. c, Glucagon-induced cAMP accumulation measurement of the mutants V130C/L210C, V130C and L210C and the WT GCGR. d, Glucagon-induced cAMP accumulation measurement of the mutants V130C/L210C, V130C and L210C and the WT GCGR in presence of 1 mM DTT. Dose-response curves of cAMP accumulation assays generated from three independent experiments performed in duplicate. Data are shown as means ± S.E.M. e–g, Disulfide cross-linking assays of the GCGR mutant Q113C/D209C (e) and the controls, single-site mutants Q113C (f) and D209C (g). Dose-response curves of [125I]-glucagon binding assay generated from three independent experiments performed in duplicate. Data are shown as means ± S.E.M.
Extended Data Figure 3
Extended Data Figure 3. Electron densities for the stalk and ECL1 in the GCGR-FL crystal structure
a, Electron densities for the stalk. The stalk region is shown as sticks and colored in green. The rest of the receptor is shown in cartoon representation and colored in orange (ECD), magenta (ECL1) and blue (TMD). Electron densities are contoured at 1.0 σ from a composite omit map and colored in blue. b, Electron densities for ECL1. ECL1 is shown as sticks and colored in magenta. The rest of the receptor is shown in cartoon representation and colored in orange (ECD), green (stalk) and blue (TMD). Electron densities are contoured at 1.0 σ from a composite omit map and colored in blue.
Extended Data Figure 4
Extended Data Figure 4. Comparison between the GCGR-FL crystal structure and previously published structure and models
a and b, Comparison between the GCGR-mAb1 complex structure and the previous model of GCGR-glucagon complex. Only the receptors in the GCGR-mAb1 complex structure and the model are shown in cartoon representation and colored in blue and yellow, respectively. The ECDs are also shown in surface representation. The stalk in the GCGR-FL structure is in green, and the stalk in the model is in magenta. (b) Side view; (c) Top view. c, Comparison between the GCGR-FL structure and crystal structure of GLP-1R’s ECD bound to its endogenous ligand GLP-1. Structural superimposition shows spatial clashes between ECL1 and helix II of GCGR and GLP-1. The receptor in the GCGR-FL structure is shown as blue cartoon, and the ligand NNC0640 is displayed as magenta spheres. The complex structure of GLP-1R’s ECD bound to GLP-1 (PDB ID: 3IOL) is shown in cartoon representation. The ECD of GLP-1R is colored in green, and GLP-1 is in red.
Extended Data Figure 5
Extended Data Figure 5. HDX studies for the NNC0640-stabilized GCGR in complex with mAb1 or mAb23
a, Interaction between GCGR and mAb1. The receptor is shown in grey cartoon representation. The regions of αA helix (residues L32–L38) and β4-L5 (residues K98–Q105) in ECD and the stalk (residues I128–M137), which showed increased protection in the antibody-bound GCGRs, are colored in red, blue and green, respectively. The antibody mAb1 is shown as cyan surface and cartoon. b–d, HDX plots for the regions of ECD αA helix (b), ECD β4-L5 (c) and the stalk (d) in the antibody-free and mAb1-bound GCGRs. e–g, HDX plots for the regions of ECD αA helix (e), ECD β4-L5 (f) and the stalk (g) in the antibody-free and mAb23-bound GCGRs. HDX data are plotted as means ± S.D. of three independent experiments.
Extended Data Figure 6
Extended Data Figure 6. Differential perturbation heat map view of the HDX studies
a, Heat map view of the GCGR-NNC0640-mAb1 complex colored according to the heat map coloring scheme used by the software HDX Workbench. Each bar represents a peptide showing the average difference (across 6 time points) in D2O uptake between the receptor-antibody complex and the antibody-free receptor with the standard deviation between replicates and the peptide charge states shown in parentheses. The regions that revealed statistically significant reduction in deuterium uptake in the receptor-antibody complex compared to the antibody-free receptor are colored in green and boxed in red. The D2O difference between the antibody-bound and antibody-free GCGRs at two consecutive time points has a P-value < 0.05 or a single time point has a P-value < 0.01. The regions with no significant change are in grey and the regions that have no peptides covering the sequence in MSMS and HDX runs are shown as gaps. b, Heat map view of the GCGR-NNC0640-mAb23 complex.
Extended Data Figure 7
Extended Data Figure 7. MD simulations of the apo GCGR
a, Main chain RMSD values of the ECD versus simulation time in the three 1-μs MD simulations. The values were calculated from snapshots at 100 ps intervals. All the structures were superimposed to the crystal structure of GCGR-FL using the main chain atoms of residues S150-L160 (helix I), I176–V193 (helix II), A227–G246 (helix III), G271–P275 (helix IV), V311-I321 (helix V), T351-L358 (helix VI) and Q392–Y400 (helix VII). b–d, Comparison between the results of simulations and the GCGR-FL crystal structure. The GCGR-FL crystal structure is shown as grey cartoon. The results of the three simulations are shown in cartoon representation, and colored in yellow, cyan and orange, respectively. The ECDs of the receptors are also shown in surface representation. The N-terminal portion of stalk (residues G125–Q131) and the ECL1 region (residues T200-D218), which are analyzed in panel e, are colored in green and magenta, respectively. The red arrows indicate the movements of the ECDs and ECL1 (d) in the simulations. e, Secondary structure as a function of time for the stalk (residues G125–Q131) and ECL1 (residues T200-D218) regions in the crystal structure and simulations.
Extended Data Figure 8
Extended Data Figure 8. Interactions between the ECD and stalk/ECL1 in MD simulations and comparison with the binding modes of glucagon and mAb1
a, Interactions between the ECD and stalk/ECL1 in one typical MD simulation snapshot. The residues Y202, K205 and I206 on the N-terminal half of ECL1 make hydrophobic contacts with a hydrophobic core formed by residues L32, F33, W36, Y65, Y84, L85, P86 and W87 on the αA helix, L2 and L5 of the ECD. Additionally, the negatively charged residues E127 and E129 on the stalk and D208 and D209 on the tip of ECL1 tend to form salt bridges with the basic residues R111 and R116 on the L5 of the ECD. The receptor is shown in cartoon representation. The ECD, stalk, ECL1 and TMD are colored in orange, green, magenta and blue, respectively. The residues involved in the interaction are shown as sticks. b–d, Interaction interfaces on the ECD for the stalk/ECL1 in the MD simulations (b), glucagon in the GCGR-glucagon complex model (c) and mAb1 in the GCGR-NNC0640-mAb1 complex structure (d). The ECDs of the receptor are shown as grey cartoon and surface. The residues involved in the interactions are shown as sticks and colored in orange.
Figure 1
Figure 1. Overall structure of the GCGR-NNC0640-mAb1 complex
a, Structure of the GCGR-NNC0640-mAb1 complex. GCGR and mAb1 are shown in cartoon representation. The ECD (residues Q27-D124), stalk (residues G125–K136) and TMD (residues M137–W418) of the receptor and mAb1 are colored in orange, green, blue and cyan, respectively. The glycan modifications in the ECD are displayed as orange sticks. NNC0640 is shown as magenta spheres. The disulfide bonds are shown as yellow sticks. The membrane boundaries are displayed as grey spheres, which are the phosphorous atoms in each phospholipid molecule after the initial 50-ns equilibrium of the simulation system. b, Close-up view of the interface between GCGR and mAb1. The antibody mAb1 is also shown in surface representation.
Figure 2
Figure 2. Ligand-binding mode of GCGR to NNC0640
a, Ligand-binding site of NNC0640. GCGR is shown in grey cartoon representation. The ligand NNC0640 (magenta carbons) and GCGR residues (blue carbons) involved in ligand binding are shown in stick representation. Hydrogen bonds are displayed as green dashed lines. b, Schematic representation of interactions between GCGR and NNC0640 analyzed by LigPlot+20. The stick drawings of GCGR residues and NNC0640 are colored in blue and magenta, respectively. c, Comparison of the ligand-binding modes between NNC0640 and MK-0893. NNC0640 and MK-0893 are shown as sticks, and colored in magenta and yellow, respectively.
Figure 3
Figure 3. Stalk and ECL1 in the GCGR-FL structure
a, Comparison of the stalk conformation between the GCGR-FL structure and the GCGR-TMD structure. The receptors are shown in cartoon representation. The ECD, stalk and TMD in the GCGR-FL structure are colored in orange, green and blue, respectively. The stalk and TMD in the GCGR-TMD structure (PDB ID: 4L6R) are in yellow and grey, respectively. b, Interactions between the stalk and ECL1 in the GCGR-FL structure. The stalk (residues G125-K136), ECL1 (residues R201–S217) and TMD (residues M137–T200 and D218–W418) are colored in green, magenta and blue, respectively. The residues involved in stalk-ECL1 interaction are displayed as sticks. Hydrogen bonds are shown as blue dashed lines. c, Structural superimposition between the GCGR-FL crystal structure and the model of GCGR-glucagon complex. The ECD, stalk, ECL1 and TMD in the GCGR-FL crystal structure are colored in orange, green, magenta and blue, respectively. The receptor in the GCGR-glucagon model is in grey and glucagon is in cyan.
Figure 4
Figure 4. Stalk-ECL1 cross-linking assays
a, Model of the introduced disulfide bond between the mutations V130C and L210C. GCGR is shown as cartoon. The ECD, stalk, ECL1 and TMD are colored in orange, green, magenta and blue, respectively. The disulfide bond V130C-L210C is shown as yellow sticks. b–e, Disulfide cross-linking assays of the GCGR mutant V130C/L210C (b) and the controls, WT receptor (c) and single-site mutants V130C (d) and L210C (e). Dose-response curves of [125I]-glucagon binding assay generated from three independent experiments performed in duplicate. Data are shown as means ± S.E.M. Specific [125I]-glucagon binding (% of WT) of V130C/L210C-DTT is significantly different from that of V130C/L210C (P < 0.005, two-tailed t-test). Specific [125I]-glucagon binding (% of WT) of WT-DTT, V130C-DTT and L210C-DTT is not significantly different from that of WT, V130C and L210C, respectively (P > 0.05, two-tailed t-test).
Figure 5
Figure 5. Different conformational states of GCGR
The crystal structure of GCGR-mAb1 complex, the model of apo GCGR derived from MD simulations, the hypothetical docking pose of glucagon C-terminus to GCGR and the hypothetical model of GCGR-glucagon complex are shown in two different views with the TMDs in each row in same orientation. The model of the hypothetical GCGR-glucagon complex shows a conformational change of the stalk region, possibly including its dissociation with ECL1 and/or a change in secondary structure. The structure and models are shown in cartoon and surface representations. The ECD, stalk, ECL1 and TMD of GCGR are colored in orange, green, magenta and blue, respectively. The antibody mAb1 is shown as cyan cartoon and surface. Glucagon is shown as cyan cartoon.

Comment in

References

    1. Lagerstrom MC, Schioth HB. Structural diversity of G protein-coupled receptors and significance for drug discovery. Nat Rev Drug Discov. 2008;7:339–357. - PubMed
    1. Hollenstein K, et al. Insights into the structure of class B GPCRs. Trends Pharmacol Sci. 2014;35:12–22. - PMC - PubMed
    1. Finan B, et al. Chemical Hybridization of Glucagon and Thyroid Hormone Optimizes Therapeutic Impact for Metabolic Disease. Cell. 2016;167:843–857. - PubMed
    1. Longuet C, et al. The glucagon receptor is required for the adaptive metabolic response to fasting. Cell Metab. 2008;8:359–371. - PMC - PubMed
    1. Parthier C, Reedtz-Runge S, Rudolph R, Stubbs MT. Passing the baton in class B GPCRs: peptide hormone activation via helix induction? Trends Biochem Sci. 2009;34:303–310. - PubMed

Publication types

MeSH terms