. 2017 May 16;19(7):1351-1364.
doi: 10.1016/j.celrep.2017.04.055.

Endogenous Replication Stress in Mother Cells Leads to Quiescence of Daughter Cells

Affiliations

Endogenous Replication Stress in Mother Cells Leads to Quiescence of Daughter Cells

Mansi Arora et al. Cell Rep. .

Abstract

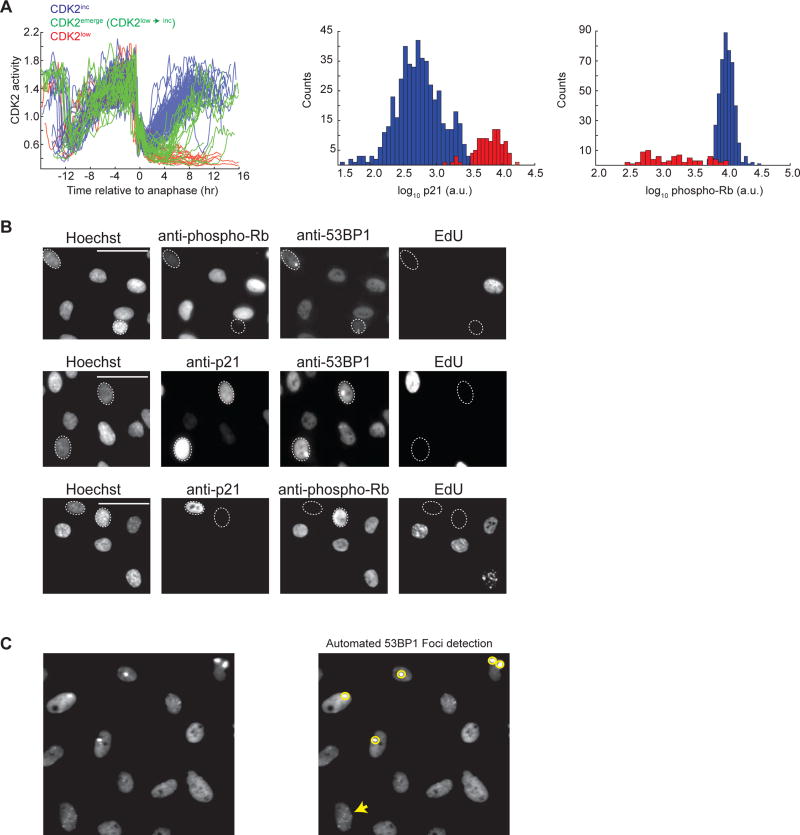
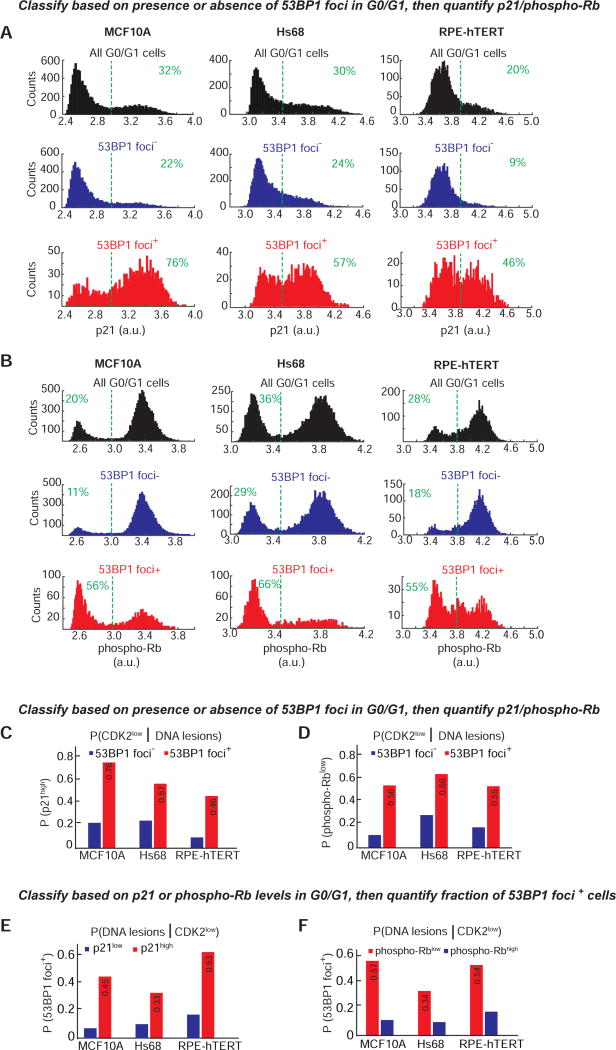
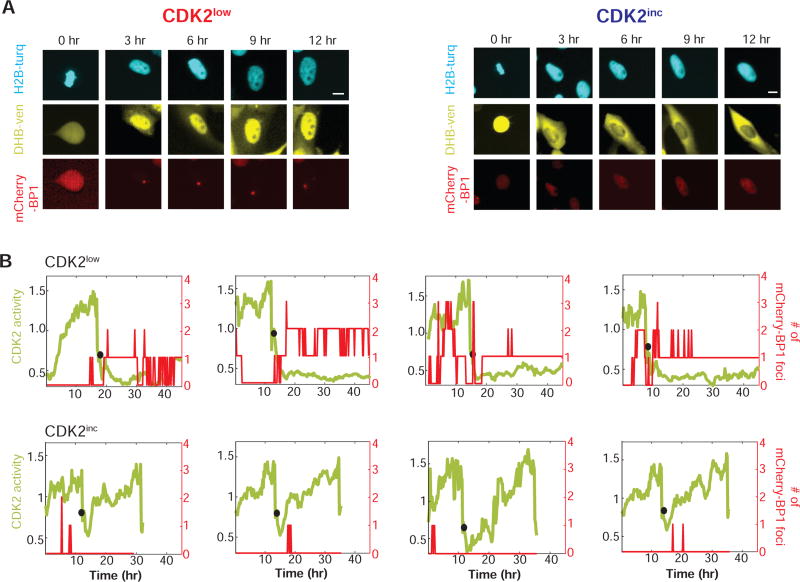
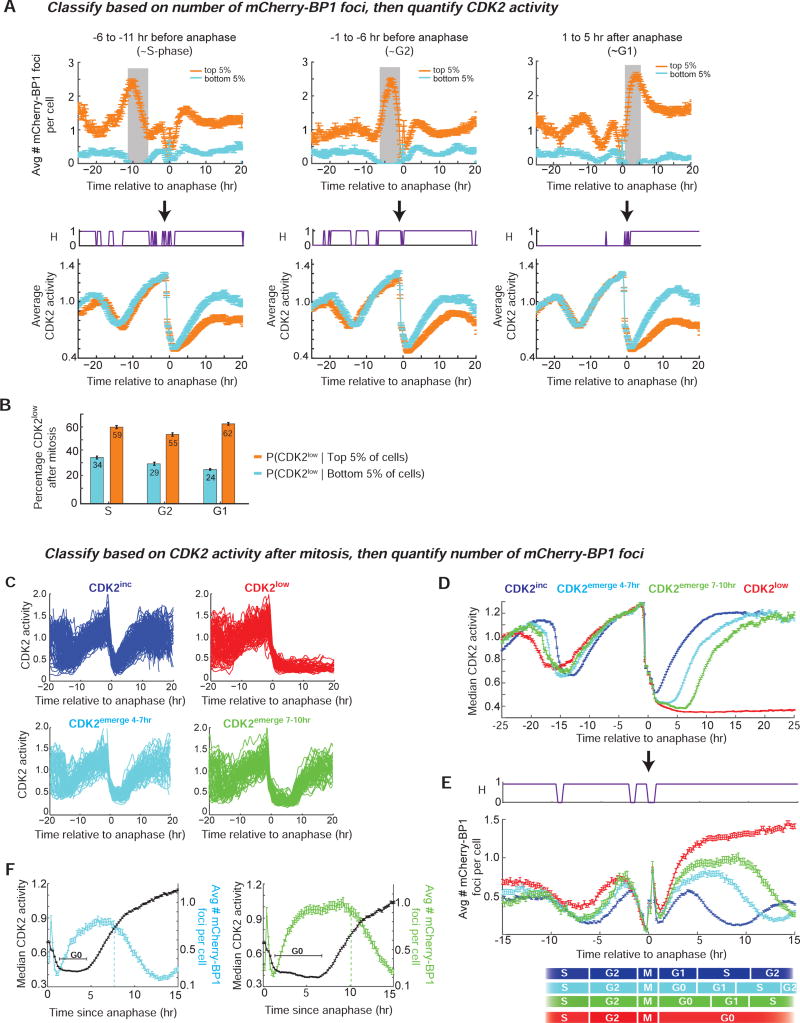
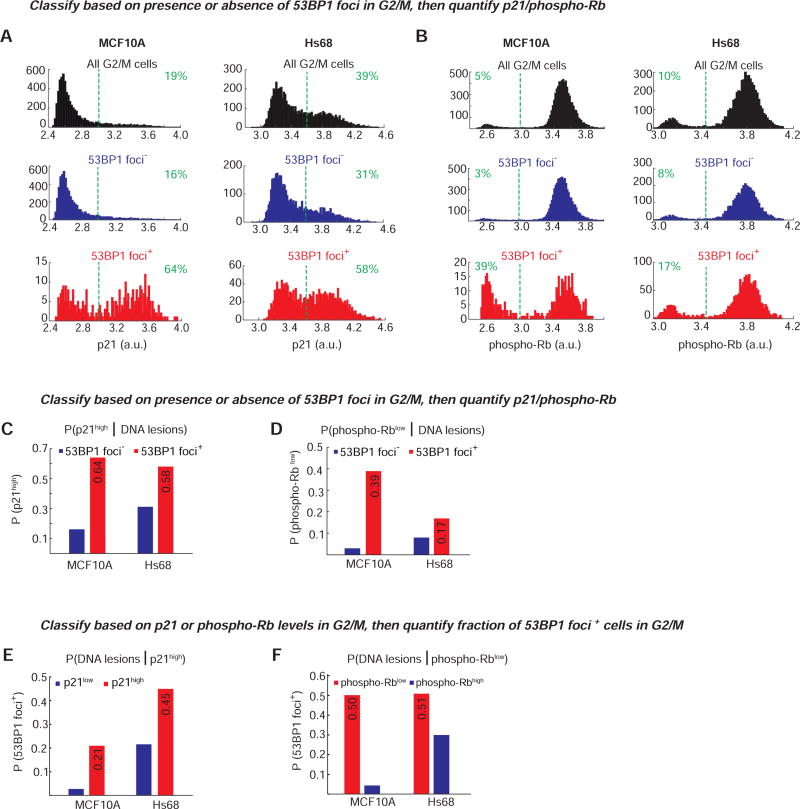
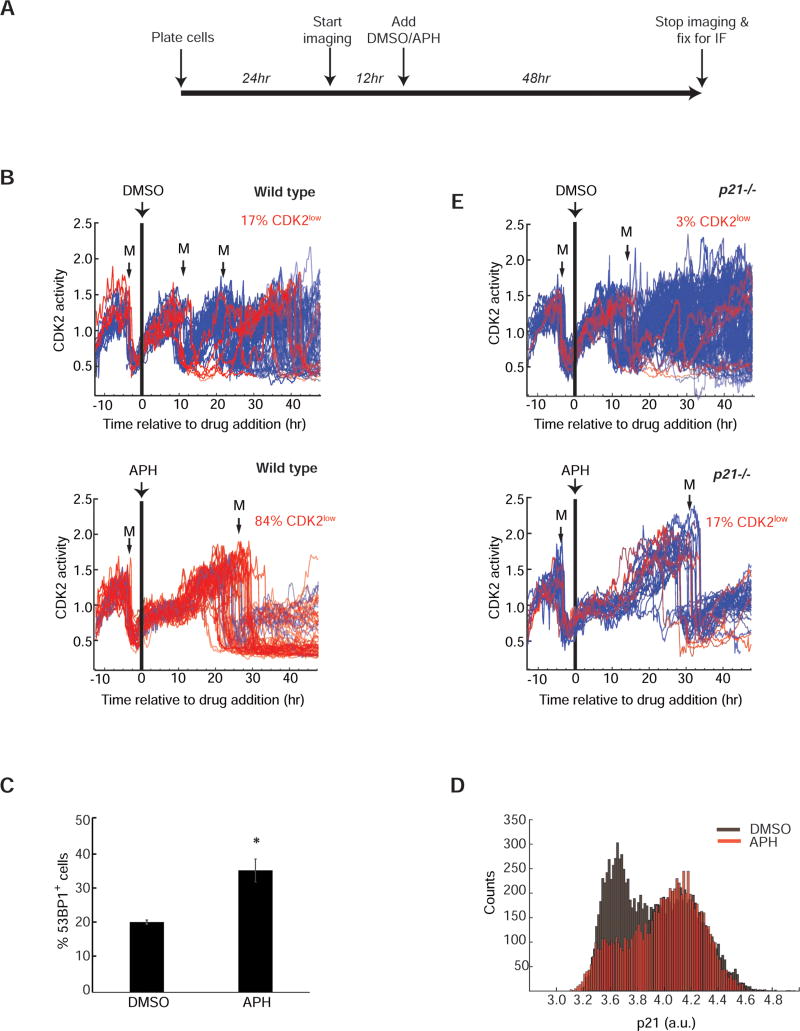
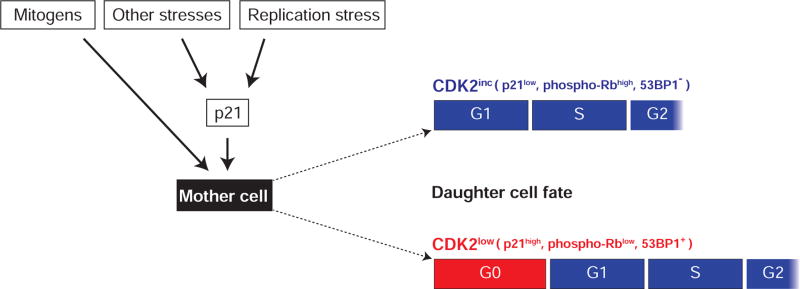
Mammalian cells have two fundamentally different states, proliferative and quiescent, but our understanding of how and why cells switch between these states is limited. We previously showed that actively proliferating populations contain a subpopulation that enters quiescence (G0) in an apparently stochastic manner. Using single-cell time-lapse imaging of CDK2 activity and DNA damage, we now show that unresolved endogenous replication stress in the previous (mother) cell cycle prompts p21-dependent entry of daughter cells into quiescence immediately after mitosis. Furthermore, the amount of time daughter cells spend in quiescence is correlated with the extent of inherited damage. Our study thus links replication errors in one cell cycle to the fate of daughter cells in the subsequent cell cycle. More broadly, this work reveals that entry into quiescence is not purely stochastic but has a strong deterministic component arising from a memory of events that occurred in the previous generation(s).

Keywords: 53BP1; CDK2; G0; cell cycle; cell-to-cell variability; endogenous DNA damage; live-cell imaging; p21; proliferation-quiescence decision; quiescence.


Figures

Figure 1
Figure 1. Immunofluorescence reveals a correlation between low phospho-Rb, high p21, and the presence of 53BP1 foci
A. Single-cell traces of CDK2 activity aligned computationally to the time of anaphase (left panel). Traces were colored red if the CDK2 activity (Cytoplasmic/nuclear ratio of the sensor) was below 0.55 at 4 hr after anaphase and through the end of the movie (CDK2low) and were colored green if the CDK2 activity was ≤ 0.55 at 4 hr after anaphase but rose above 0.55 thereafter (CDK2low→inc, hereafter referred to as CDK2emerge); otherwise traces were colored blue (CDK2inc). At the end of the imaging period, p21 and phospho-Rb-Serine 807/811 levels were visualized by immunofluorescence and plotted as histograms for CDK2inc (blue) or CDK2low (red) cells. For simplicity, only 150 randomly selected CDK2 activity traces are shown in the left panel whereas the immunofluorescence data is aggregated across 10 replicate wells to obtain 743 (p21) or 751 (phospho-Rb) cells. B. Immunofluorescence images of RPE cells labeled with EdU and then stained with Hoechst and the following antibody combinations: 1) anti-53BP1 with anti-phospho-Rb-S807/811 (top panel), 2) anti-53BP1 with anti-p21 (middle panel), and 3) anti-p21 with anti-phospho-Rb-S807/811 (bottom panel). For the top two panels, dashed ovals mark EdU-negative cells with 53BP1 foci whereas in the bottom panel, the dashed ovals mark cells that are EdU negative and stain exclusively for either p21 or phospho-Rb. Images are representative of three biological replicates. Scale bars are 50µm. C. Example of automated detection of 53BP1 foci using a custom MATLAB script. Foci identified using the script are circled in yellow. A cell with foci that are below the threshold set for detection (see Supplementary Methods for details) is marked by a yellow arrow.
Figure 2
Figure 2. Cells with 53BP1 foci tend to be in a phospho-Rblow/p21high/CDK2low state, and phospho-Rblow/p21high cells tend to have 53BP1 foci
A & B. Histograms showing bimodal distribution of p21 or phospho-Rb-S807/811 in G0/G1 MCF10A (left), Hs68 (center) or RPE-hTERT (right) cells with either no (“53BP1 foci”, blue) or at least one 53BP1 focus (“53BP1 foci+”, red). The distribution of the phospho-Rb and p21 signal in all G0/G1 cells is shown for comparison (black). Data shown are aggregated from four (MCF10A) or eight (Hs68 & RPE) replicate wells to obtain well-populated histograms. The number of cells analyzed for p21 histograms are 25,817 (MCF10A), 25,366 (Hs68) and 20,829 (RPE) and for the phospho-Rb histograms are 28,249 (MCF10A), 22,708 (Hs68) and 19,579 (RPE). Dashed green lines indicate the cutoffs for p21high and phospho-Rblow. For p21, the cutoff was based on the distribution seen in S-phase cells (p21 is degraded in S-phase and hence all S-phase cells are p21low, data not shown). For phospho-Rb, the cutoff was based on the approximate “saddle” point between the two peaks observed in the “All G0/G1” histogram. Percentage of cells to the right or left of the dashed green lines are indicated. C & D. Probability of a cell being in the CDK2low state given that it has DNA lesions. G0/G1 cells were first classified as 53BP1+ (red) or 53BP1 (blue) based on the presence or absence of 53BP1 foci, followed by calculation of the fraction of cells with high p21 or low phospho-Rb based on the cutoffs marked by dashed lines in (A) and (B). E & F. Probability of a cell having DNA lesions given that it is in the CDK2low state. G0/G1 cells were first classified as p21high (red) or p21low (blue), or phospho-Rblow (red) or phospho-Rbhigh (blue) based on the cutoffs marked by dashed lines in (A) and (B), followed by calculation of the fraction of cells with at least one 53BP1 focus.
Figure 3
Figure 3. Live-cell imaging of mCherry-BP1 foci and CDK2 activity in MCF10A cells
A. Time-lapse images of CDK2 activity (DHB-Ven) and a marker of DNA lesions (mCherry-BP1) in a CDK2low (left) or CDK2inc (right) MCF10A cell. The first image (0 hr) represents the time of metaphase. Scale bars are 10µm. B. Examples of single-cell traces of CDK2 activity (green, left y-axis) and number of mCherry-BP1 foci (red, right y-axis) detected during the 48 hr time-lapse imaging. Black circles denote the time of anaphase. Top panel: CDK2low cells; bottom panel: CDK2inc cells. The leftmost panels represent traces of cells shown in Figure 3A.
Figure 4
Figure 4. Daughter cells that enter the CDK2low or CDK2emerge state after mitosis have increased mCherry-BP1 foci and arise from mothers with a prolonged cell cycle and increased foci
A. Cells were first sorted computationally based solely on the average number of mCherry-BP1 foci during a specified time window (gray vertical bar), and then the average CDK2 activity was calculated for the top 5% and bottom 5% of the cells in that list. Top panels show the average number of mCherry-BP1 foci, and bottom panels show average CDK2 activity during the specified cell cycle phase: i) −6 to −11 hr before anaphase (~S phase, left panel) ii) −1 to −6 hr before anaphase (~G2 phase, middle panel) and iii) 1 to 5 hr after anaphase (~G0/G1 phase, right panel). Error bars represent standard error of mean, where n=225 (S-phase), 253 (G2), or 275 (G1) cells in the bottom 5th and top 5th percentile for the indicated time-window; data are aggregated from 16 replicate wells. The H-value plot (purple, bottom panel) indicates time points where the CDK2 activity is significantly different (H=1) between cells in the top 5% and bottom 5% of mCherry-BP1 foci, based on a two sample t-test with a p-value of 0.05. B. Percent of cells that enter the CDK2low state among cells in the top 5% or bottom 5% of mCherry-BP1 foci as classified as in (A). Error bars represent standard error of the mean based on the number of cells in (A). C. Cells were first classified as CDK2inc (blue), CDK2emerge 4–7hr (cyan), CDK2emerge 7–10hr (green),or CDK2low (red) based on their CDK2 activity after anaphase, regardless of the number of mCherry-BP1 foci. Traces were classified as CDK2low if the CDK2 activity (Cytoplasmic/nuclear ratio of the sensor) was ≤ 0.55 at 4 hr after anaphase and for the remainder of the imaging period. Traces were classified as CDK2emerge 4–7hr or CDK2emerge 7–10hr if the CDK2 activity was ≤ 0.55 at 4 hr after anaphase and rose above 0.55 4–7 hr or 7–10 hr after anaphase, respectively; otherwise traces were classified as CDK2inc. Note that although only cells emerging from the CDK2low state 4–7 hr or 7–10 hr after anaphase are included here, cells can emerge from the CDK2low state at all different times, ranging from several hours to several days (Spencer et al., 2013). For simplicity, only 150 randomly selected traces from each subpopulation are shown. D. Median CDK2 activity of the four subpopulations described in (C). Error bars represent standard error of the mean where n=2387 CDK2inc cells, 778 CDK2emerge 4–7hr cells, 455 CDK2emerge 7–10hr cells, 1082 CDK2low cells, derived from aggregated data from 16 replicate wells. E. For cells in each group described in (C), the average number of mCherry-BP1 foci per cell was calculated at each frame of the movie and plotted relative to time of anaphase. The estimated cell cycle phases are depicted at the bottom, based on previously reported lengths of each cell-cycle phase in MCF10A cells (Spencer et al., 2013). Note that the mCherry-BP1 signal is unreliable during mitosis due to cell rounding and chromosomal condensation. Error bars represent standard error of the mean as in (D). F. Overlay of the median CDK2 activity (black trace) and mean number of mCherry-BP1 foci (cyan or green trace) in the CDK2emerge 4–7hr and CDK2emerge 7–10hr cells depicted in (C). The time that cells spend in the quiescent CDK2low state prior to emerging is marked in black as “G0”. The vertical dashed lines represent the time at which the average number of foci per cell begins to fall. Error bars represent standard error of the mean as in (D) and (E).
Figure 5
Figure 5. G2/M cells with DNA lesions have increased p21 and reduced Rb phosphorylation
A & B. Histograms showing distribution of p21 or phospho-Rb-S807/811 in G2/M MCF10A (left) or Hs68 (right) cells with either no (“53BP1 foci”, blue) or at least one 53BP1 focus (“53BP1 foci+”, red). The distribution of the phospho-Rb and p21 signal in all G2/M cells is shown for comparison (black). Dashed vertical green lines denote the cutoff for calculating the percent p21high or phospho-Rblow as in Figure 2; the percentage of cells to the right or left of the green lines is indicated. The number of cells analyzed is the same as in Figure 2A and 2B. C & D. Probability of a cell having increased p21 or reduced Rb phosphorylation given that it has DNA lesions in G2/M phase. G2/M cells were first classified as 53BP1+ (red) or 53BP1 (blue) based on the presence or absence of 53BP1 foci, followed by calculation of the fraction of cells with high p21 or low phospho-Rb. E & F. Probability of a cell having DNA lesions given that it has high p21 or low Rb phosphorylation in G2/M phase. G2/M cells were first classified as p21high (red) or p21low (blue), or phospho-Rbhigh (blue) or phospho-Rblow (red), based on the cutoffs marked by dashed lines in (A) and (B), followed by calculation of the fraction of cells with at least one 53BP1 focus.
Figure 6
Figure 6. Introduction of low-level replication stress causes entry into the CDK2low state after mitosis
A. Experimental timeline. MCF10A cells were imaged for 12 hr prior to addition of DMSO or APH, then imaged for another 48 hr after drug addition, and then prepared for immunofluorescence. B. & E. Single cell traces of CDK2 activity in wild-type or p21−/− MCF10A cells treated with DMSO or 0.4µM Aphidicolin (APH). Only cells that underwent anaphase in a 2–4 hr window prior to drug addition are included (n=390 (WT+DMSO), 115 (WT+APH), 356(p21−/− + DMSO), 125 (p21−/− + APH); data are aggregated from 6 replicate wells for each condition. A black vertical bar represents the time of drug addition. Traces were colored blue (CDK2inc) if the CDK2 activity was above the threshold (y=0.55) at 4 hr after the first mitosis (M) subsequent to drug addition; otherwise traces were colored red (CDK2low). The number of traces that could not be classified as either CDK2inc or CDK2low is shown in Figure S5D. C. Percentage of MCF10A cells with at least one 53BP1 focus after 48 hr treatment with either DMSO or 0.4µM APH. Error bars represent standard error of mean. * denotes p-value of 0.009 calculated using two-tailed Student’s t-test with equal variance. D. Histograms of p21 levels measured by immunofluorescence in cells fixed at the end of 48hr of imaging in the presence of DMSO (gray) or 0.4µM APH (red).
Figure 7
Figure 7. Schematic of key inputs that determine the proliferative or quiescent fate of a cell after mitosis
Cells assess their environment (presence or absence of mitogens (Spencer et al., 2013)), as well as stresses such as endogenous replication stress (this manuscript), during a “decision window” at the end of the previous cell cycle and choose between two alternate fates after mitosis – proliferative/CDK2inc or quiescent/CDK2low

References

    1. Al Mamun M, Albergante L, Moreno A, Carrington JT, Blow JJ, Newman TJ. Inevitability and containment of replication errors for eukaryotic genome lengths spanning megabase to gigabase. Proc Natl Acad Sci U S A. 2016;113:E5765–E5774. - PMC - PubMed
    1. Anderson L, Henderson C, Adachi Y. Phosphorylation and rapid relocalization of 53BP1 to nuclear foci upon DNA damage. Mol Cell Biol. 2001;21:1719–1729. - PMC - PubMed
    1. Barboza JA, Liu G, Ju Z, El-Naggar AK, Lozano G. p21 delays tumor onset by preservation of chromosomal stability. Proc Natl Acad Sci U S A. 2006;103:19842–19847. - PMC - PubMed
    1. Barr AR, Cooper S, Heldt FS, Butera F, Stoy H, Mansfeld J, Novak B, Bakal C. DNA damage during S-phase mediates the proliferation-quiescence decision in the subsequent G1 via p21 expression. Nat Commun. 2017;8:14728. - PMC - PubMed
    1. Bartek J, Lukas J. Mammalian G1- and S-phase checkpoints in response to DNA damage. Curr Opin Cell Biol. 2001a;13:738–747. - PubMed

Publication types