. 2017 Jul 25;8(30):49303-49317.
doi: 10.18632/oncotarget.17571.

Inflammatory microRNA-194 and -515 attenuate the biosynthesis of chondroitin sulfate during human intervertebral disc degeneration

Affiliations

Inflammatory microRNA-194 and -515 attenuate the biosynthesis of chondroitin sulfate during human intervertebral disc degeneration

Bo Hu et al. Oncotarget. .

Abstract

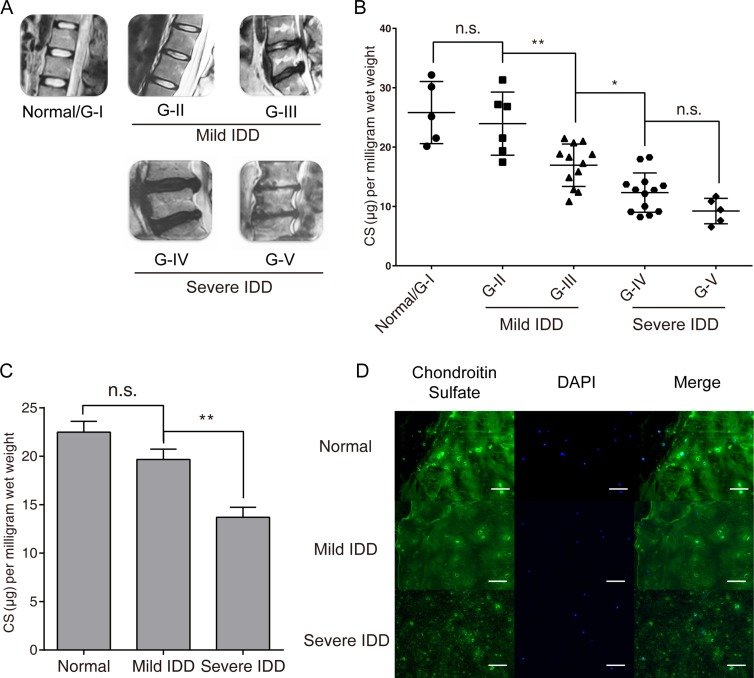
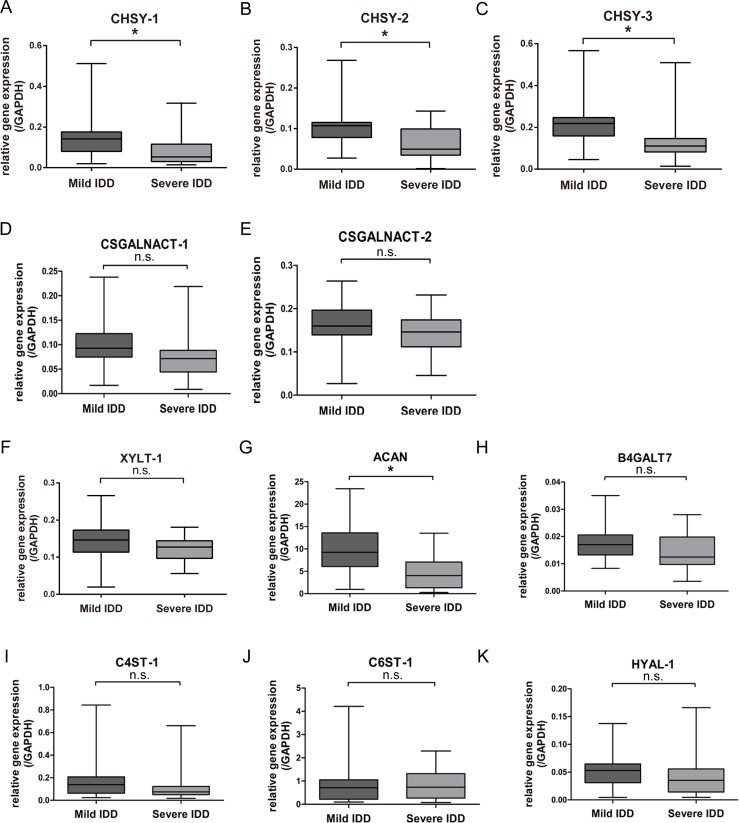
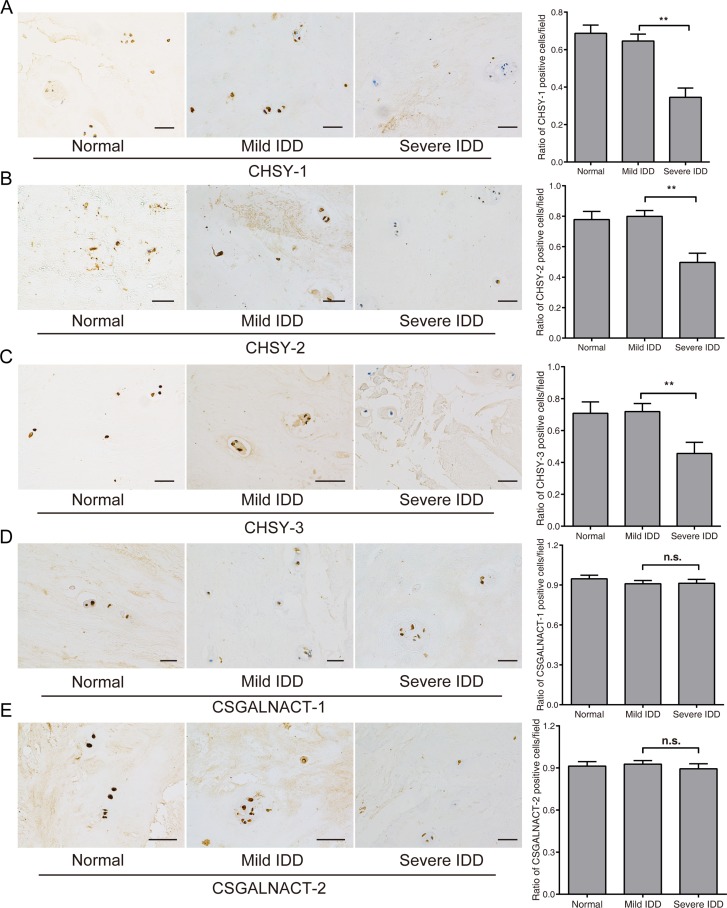
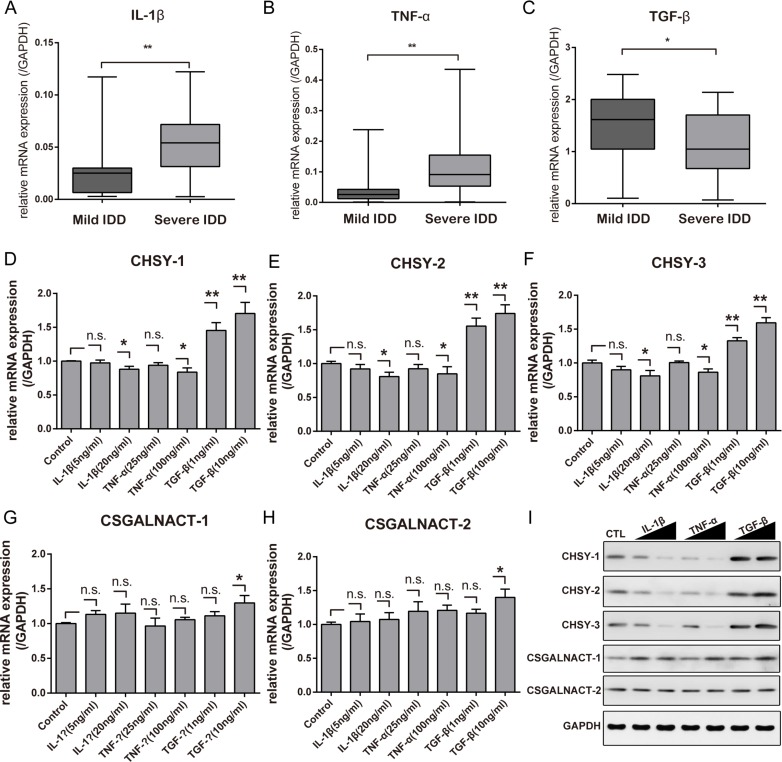
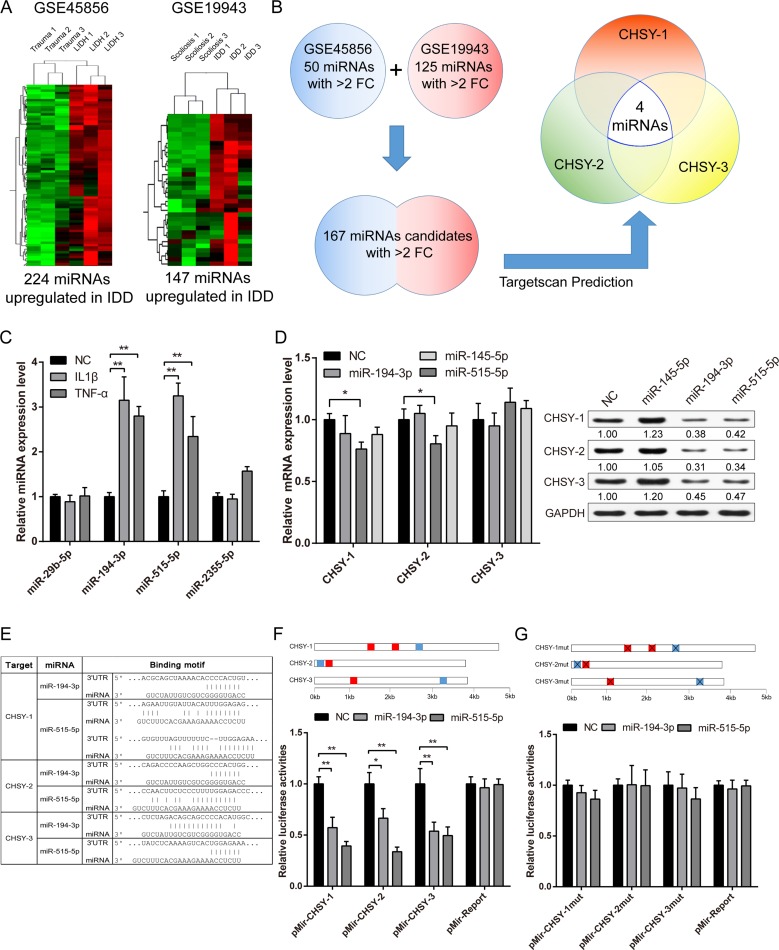
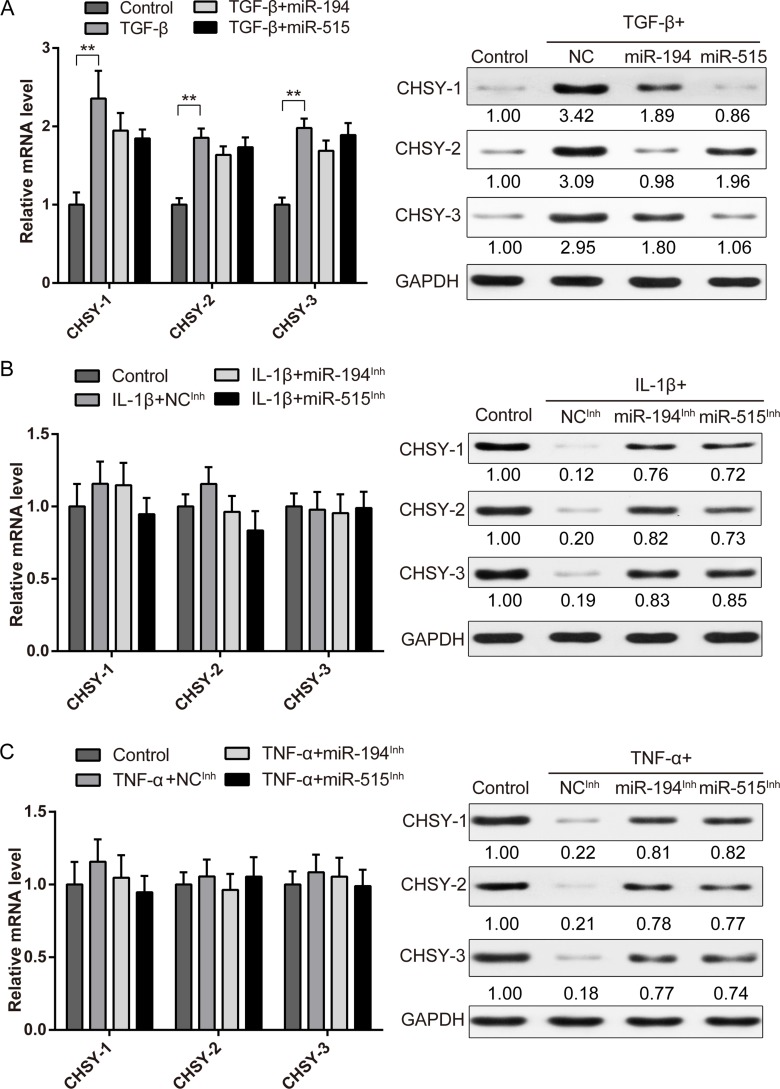
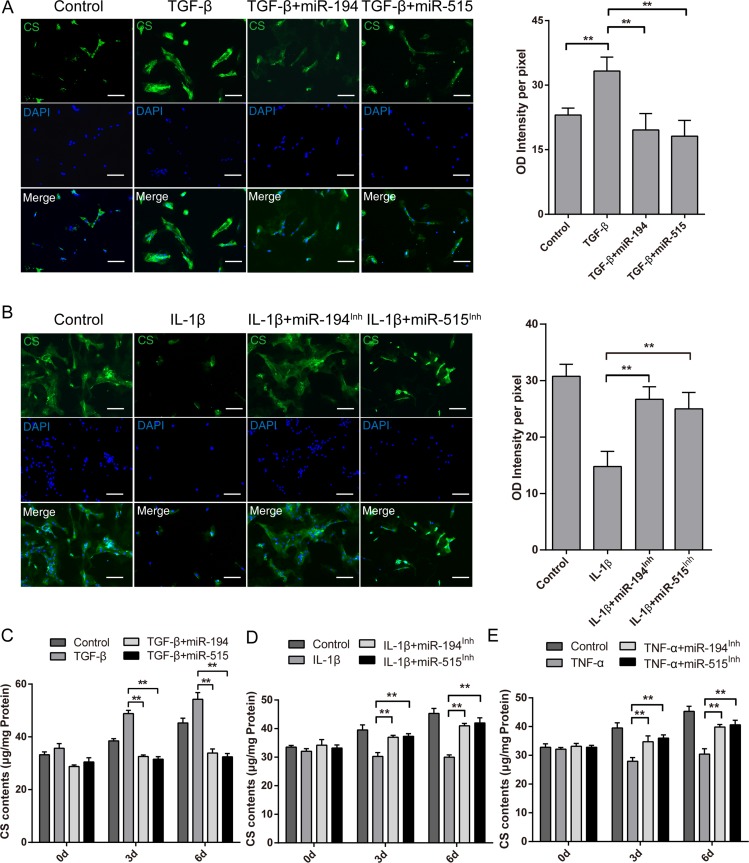
Intervertebral disc degeneration (IDD) is characterized by dehydration and loss of extracellular matrixes in the nucleus pulposus region. Chondroitin sulfate has been found to be the water-binding molecule that played a key role in IDD. Although investigators have reported that inflammatory cytokines are involved in the reduction of chondroitin sulfate in IDD, but the underlying mechanism is unrevealed. Since chondroitin sulfate synthesis is controlled by chondroitin sulfate glycosyltransferases CHSY-1/2/3 and CSGALNACT-1/2, their functional role and regulatory mechanism in IDD is not fully studied. Here, we set out to investigate the function and regulatory roles of these factors during IDD development. We found that among these chondroitin sulfate glycosyltransferases, CHSY-1/2/3 are significantly down-regulated in severe IDD samples than mild IDD samples. In vitro experiments revealed that Interleukin-1β and Tumor Necrosis Factor-α stimulation led to significant reduction of CHSY-1/2/3 at protein level than mRNA level in NP cells, indicating a post-transcriptional regulatory mechanisms are involved. By computational prediction and analysis, we found that inflammatory cytokines stimulated microRNA-194 and -515 target CHSY-1/2/3 mRNA and significantly interrupt their translation and downstream chondroitin sulfate deposition. Inhibition of microRNA-194 and -515 however, significantly rescued CHSY-1/2/3 expressions and chondroitin sulfate deposition. These findings together demonstrated a vital role of inflammatory stimulated microRNAs in promoting intervertebral disc degeneration by interrupt chondroitin sulfate synthesis, which may provide new insights into the mechanism and therapeutic approaches in IDD.

Keywords: biosynthesis; chondroitin sulfate; glycosyltransferases; intervertebral disc degeneration; nucleus pulposus.


Conflict of interest statement

CONFLICTS OF INTEREST

The authors disclose no potential conflicts of interest.

Figures

Figure 1
Figure 1. CS concentration reduced significantly in degenerated human intervertebral disc tissues
(A) Disc tissues from patients were collected and classified using the modified Pfirrmann grading system, and samples of grade II/III (n = 18) were assigned to the mild IDD group, samples of grade IV/V (n = 18) were allocated to the severe IDD group, samples of grade I (n = 5) were allocated to the normal group. (BC) DMMB assay shows that the CS concentration in NP samples from each sample divided by Pfirrmann grade (B) and the mean CS concentration between mild IDD, severe IDD and normal NP samples (C). The results are normalized to the tissue wet weight, and data are shown as mean ± SD. *p < 0.05; **p < 0.01. (D) Representative Immunofluorescence microscopy images showing the CS staining between normal disc, mild IDD NP and severe IDD NP samples, see also Supplementary Figure 1A. Bars represents 200 μm.
Figure 2
Figure 2. Assessing the expression of CS related enzymes in mild and severe IDD NP samples
(AE) Real-time PCR analysis assessing the mRNA levels of CHSY-1 (A) CHSY-2 (B) CHSY-3 (C) CSGALNACT-1 (D) CSGALNACT-2 (E) XYLT-1 (F) and ACAN (G) B4GALT7 (H) C4ST-1 (I) C6ST-1 (J) and HYAL-1 (K) between mild and severe IDD NP samples. n = 18 for each group, *represents p < 0.05, n.s. represents no significance. The data were normalized to GAPDH.
Figure 3
Figure 3. Immunohistochemistry analysis of CS glycosyltransferases in mild and severe NP tissues
Immunohistochemistry analysis was performed to measure the protein level of five CS glycosyltransferases, and representative images of the NP cells stained for CHSY-1 (A), CHSY-2 (B), CHSY-3 (C), CSGALNACT-1 (D), CSGALNACT-2 (E) were shown in the left panels. n = 5 for each group, bars represents 200 μm. Quantifications of positive cells in the IHC analysis were shown in the right panels. Data are shown as mean ± SD. *p < 0.05; **p < 0.01.
Figure 4
Figure 4. Inflammatory cytokines affect CHSY expressions in vitro
Real-time PCR analysis showing the mRNA level of IL-1β (A), TNF-α (B) and TGF-β (C) between mild and severe IDD NP tissues. *p < 0.05; **p < 0.01, n = 18 for each group. The mRNA level of CHSY-1 (D), CHSY-2 (E), CHSY-3 (F), CSGALNACT-1 (G), and CSGALNACT-2 (H) under different inflammatory cytokine stimulation were tested using Real-time PCR. Data are shown as mean ± SD. *p < 0.05; **p < 0.01, n = 3, n.s. represents no significance. Western blot analysis showing the protein level of CHSY-1, CHSY-2, CHSY-3, CSGALNACT-1 and CSGALNACT-2 (I). The solid triangle represents increased doses of inflammatory cytokine.
Figure 5
Figure 5. Screening and validation of CHSY targeted microRNAs
(A) Representative images of hierarchical cluster showing the differentially expressed miRNAs among non-degenerated and degenerated NP tissues. Red represents highly expressed miRNA, while green represents reduced expression. Trauma and scoliosis samples were NP tissues obtained from these patients with no sign of disc degeneration, which represents normal NP, while LIDH and IDD represents degenerated NP tissues. (B) A scheme of computational prediction of CHSYs targeted miRNAs. Only miRNAs that target all three CHSYs were selected for further analysis. (C) Real-time PCR analysis showing the expression of candidate miRNAs under IL-1β and TNF-α stimulation. Data are shown as mean ± SD. **p < 0.01, n = 3, all expression were normalized to U6 expression as internal reference. (D) Real-time PCR analysis showing the expression of CHSYs under miRNA transfections. Data are shown as mean ± SD. *p < 0.05, n = 3, data were normalized to GAPDH, a scramble miRNA mimic control that target none of the CHSYs was used as negative control, here miR-145 was also served as a negative control. The right panel shows the relative protein level of CHSYs, the quantification of gray scale were shown under the blot, n = 3. (E) A list of target sites of miR-194 and -515 in CHSYs mRNA. (FG) Dual luciferase reporter assay of wildtype (F) and mutated (G) CHSY 3′UTR reporters under miR-194 and -515 overexpression. The blue squares represent miR-194 targeted sites, while red square represents miR-515 targeted sites. Data are shown as mean ± SD. *p < 0.05, **p < 0.01, n = 6, data were normalized to Renilla luciferase activities.
Figure 6
Figure 6. MiR-194 and miR-515 is essential for inflammatory cytokine regulated CHSY expressions
Real-time PCR and Western blot analysis showing the expression level of CHSY-1, -2 and -3 under TGF-β (A), IL-1β (B), TNF-α (C) treatment combined with miR-194, -515 or control miRNA mimic overexpression (A) or inhibition (B-C). Data are shown as mean ± SD. **p < 0.01, n = 3, data were normalized to GAPDH. The right panel shows the relative protein level of CHSYs, the quantification of gray scale were shown under the blot, n = 3.
Figure 7
Figure 7. Effects of miR-194, -515 on inflammatory cytokines modulated chondroitin sulfate content in human NP cells
(A) Immunofluorescence images of CS in NP cells treated with 10 ng/ml TGF-β and miR-194 or miR-515 or scramble miRNA mimic control for 72 h. (B) Immunofluorescence images of CS in NP cells treated with 20 ng/ml IL-1β and miR-194 or miR-515 inhibitors or scramble control inhibitor for 72 h. The quantifications of relative intensity were shown in the right panel. Data are shown as mean ± SD. **p < 0.01, n = 5, bars represents 50 μm. Cells and culture medium were collected to perform the DMMB assay at 3, 6, or 9 days after TGF-β and miRNA overexpression treatment (C), IL-1β and miRNA inhibition treatment (D), or TNF-α and miRNA inhibition treatment (E). Data are shown as mean ± SD. **p < 0.01, n = 3.

Similar articles

Cited by

References

    1. Luoma K, Riihimaki H, Luukkonen R, Raininko R, Viikari-Juntura E, Lamminen A. Low back pain in relation to lumbar disc degeneration. Spine. 2000;25:487–92. - PubMed
    1. Deyo RA, Weinstein JN. Low back pain. N Engl J Med. 2001;344:363–70. - PubMed
    1. Kepler CK, Ponnappan RK, Tannoury CA, Risbud MV, Anderson DG. The molecular basis of intervertebral disc degeneration. Spine J. 2013;13:318–30. - PubMed
    1. Vergroesen PP, Kingma I, Emanuel KS, Hoogendoorn RJ, Welting TJ, van Royen BJ, van Dieën JH, Smit TH. Mechanics and biology in intervertebral disc degeneration: a vicious circle. Osteoarthritis Cartilage. 2015;23:1057–70. - PubMed
    1. Sivan SS, Hayes AJ, Wachtel E, Caterson B, Merkher Y, Maroudas A, Brown S, Roberts S. Biochemical composition and turnover of the extracellular matrix of the normal and degenerate intervertebral disc. Eur Spine J. 2014;23:S344–53. - PubMed

MeSH terms

LinkOut - more resources