

Application of advanced sampling and analysis methods to predict the structure of adsorbed protein on a material surface
- PMID: 28514864
- PMCID: PMC5435533
- DOI: 10.1116/1.4983274
Application of advanced sampling and analysis methods to predict the structure of adsorbed protein on a material surface
Abstract
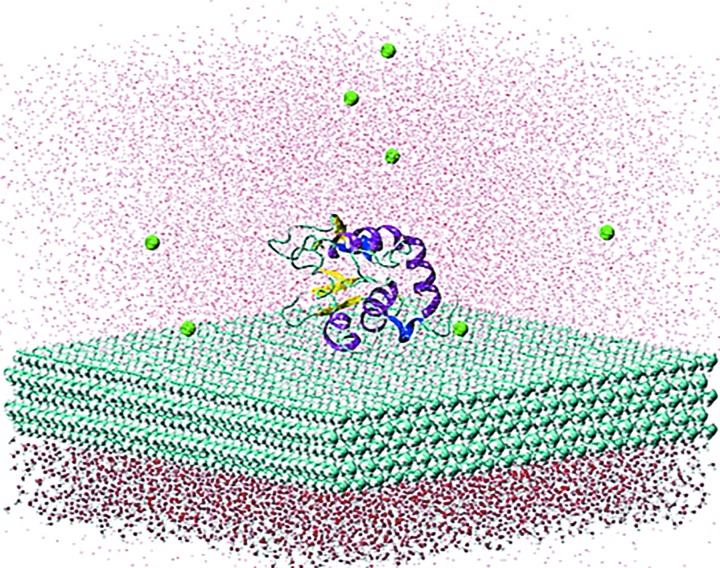
The use of standard molecular dynamics simulation methods to predict the interactions of a protein with a material surface have the inherent limitations of lacking the ability to determine the most likely conformations and orientations of the adsorbed protein on the surface and to determine the level of convergence attained by the simulation. In addition, standard mixing rules are typically applied to combine the nonbonded force field parameters of the solution and solid phases the system to represent interfacial behavior without validation. As a means to circumvent these problems, the authors demonstrate the application of an efficient advanced sampling method (TIGER2A) for the simulation of the adsorption of hen egg-white lysozyme on a crystalline (110) high-density polyethylene surface plane. Simulations are conducted to generate a Boltzmann-weighted ensemble of sampled states using force field parameters that were validated to represent interfacial behavior for this system. The resulting ensembles of sampled states were then analyzed using an in-house-developed cluster analysis method to predict the most probable orientations and conformations of the protein on the surface based on the amount of sampling performed, from which free energy differences between the adsorbed states were able to be calculated. In addition, by conducting two independent sets of TIGER2A simulations combined with cluster analyses, the authors demonstrate a method to estimate the degree of convergence achieved for a given amount of sampling. The results from these simulations demonstrate that these methods enable the most probable orientations and conformations of an adsorbed protein to be predicted and that the use of our validated interfacial force field parameter set provides closer agreement to available experimental results compared to using standard CHARMM force field parameterization to represent molecular behavior at the interface.
Figures


Similar articles
-
Parameterization of an interfacial force field for accurate representation of peptide adsorption free energy on high-density polyethylene.Biointerphases. 2015 Jun 27;10(2):021002. doi: 10.1116/1.4916361. Biointerphases. 2015. PMID: 25818122 Free PMC article.
-
TIGER2 with solvent energy averaging (TIGER2A): An accelerated sampling method for large molecular systems with explicit representation of solvent.J Chem Phys. 2015 Oct 14;143(14):144105. doi: 10.1063/1.4932341. J Chem Phys. 2015. PMID: 26472361 Free PMC article.
-
Quantification of the influence of protein-protein interactions on adsorbed protein structure and bioactivity.Colloids Surf B Biointerfaces. 2013 Oct 1;110:363-71. doi: 10.1016/j.colsurfb.2013.04.018. Epub 2013 May 13. Colloids Surf B Biointerfaces. 2013. PMID: 23751416 Free PMC article.
-
Simulation of multiphase systems utilizing independent force fields to control intraphase and interphase behavior.J Comput Chem. 2012 Jun 15;33(16):1458-66. doi: 10.1002/jcc.22979. Epub 2012 Apr 4. J Comput Chem. 2012. PMID: 22488548 Free PMC article.
-
Validation of the GROMOS force-field parameter set 45Alpha3 against nuclear magnetic resonance data of hen egg lysozyme.J Biomol NMR. 2004 Dec;30(4):407-22. doi: 10.1007/s10858-004-5430-1. J Biomol NMR. 2004. PMID: 15630561
Cited by
-
Fibrinogen adsorption to biomaterials.J Biomed Mater Res A. 2018 Oct;106(10):2777-2788. doi: 10.1002/jbm.a.36460. Epub 2018 Sep 8. J Biomed Mater Res A. 2018. PMID: 29896846 Free PMC article. Review.
-
Early Blood Clot Detection Using Forward Scattering Light Measurements Is Not Superior to Delta Pressure Measurements.Biosensors (Basel). 2023 Dec 4;13(12):1012. doi: 10.3390/bios13121012. Biosensors (Basel). 2023. PMID: 38131772 Free PMC article.
-
Predicting the In Vivo Performance of Cardiovascular Biomaterials: Current Approaches In Vitro Evaluation of Blood-Biomaterial Interactions.Int J Mol Sci. 2021 Oct 21;22(21):11390. doi: 10.3390/ijms222111390. Int J Mol Sci. 2021. PMID: 34768821 Free PMC article. Review.
-
Combining Experimental Isotherms, Minimalistic Simulations, and a Model to Understand and Predict Chemical Adsorption onto Montmorillonite Clays.ACS Omega. 2021 May 26;6(22):14090-14103. doi: 10.1021/acsomega.1c00481. eCollection 2021 Jun 8. ACS Omega. 2021. PMID: 34124432 Free PMC article.
References
Publication types
MeSH terms
Substances
Grants and funding
LinkOut - more resources
Full Text Sources
Other Literature Sources
Research Materials