

Transient activation of fission yeast AMPK is required for cell proliferation during osmotic stress
- PMID: 28515144
- PMCID: PMC5491188
- DOI: 10.1091/mbc.E17-04-0235
Transient activation of fission yeast AMPK is required for cell proliferation during osmotic stress
Abstract
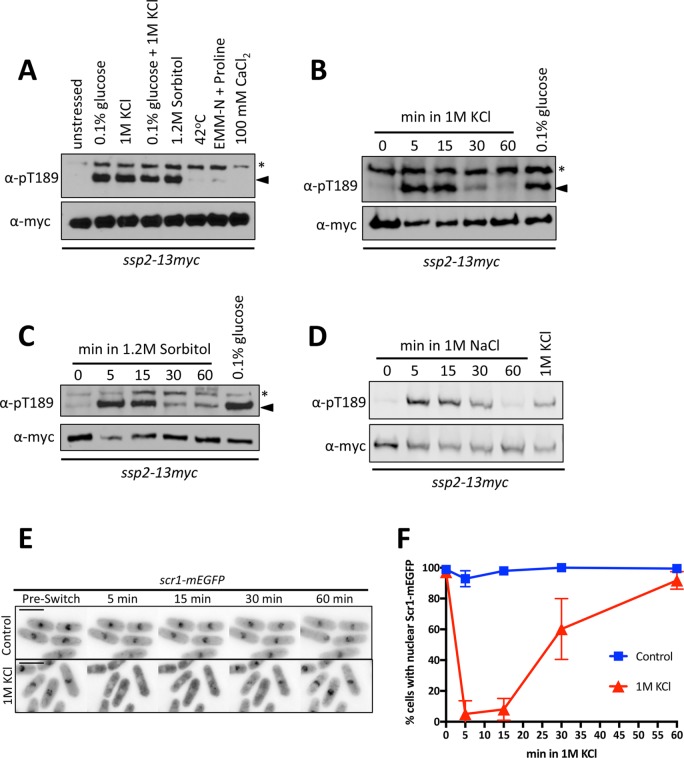
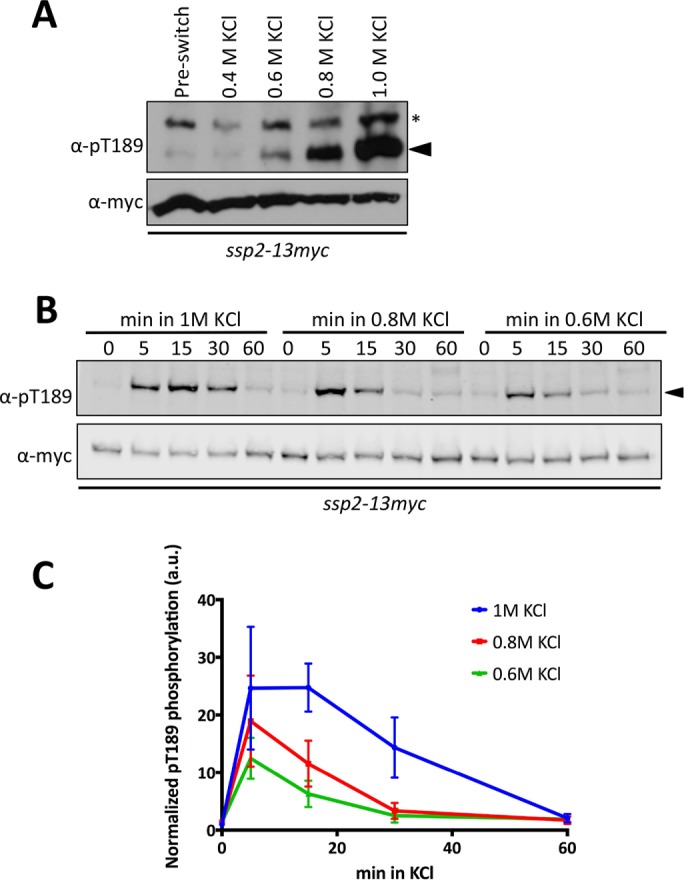
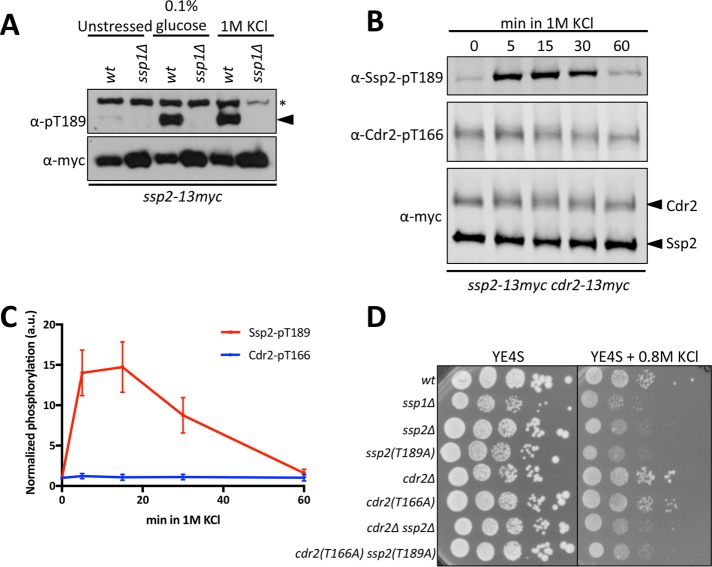
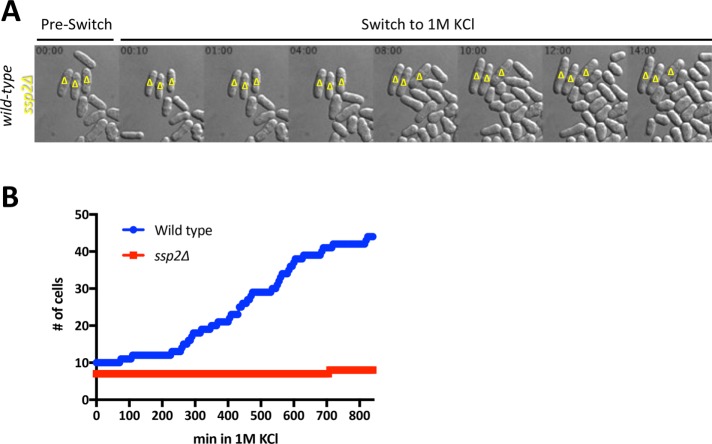
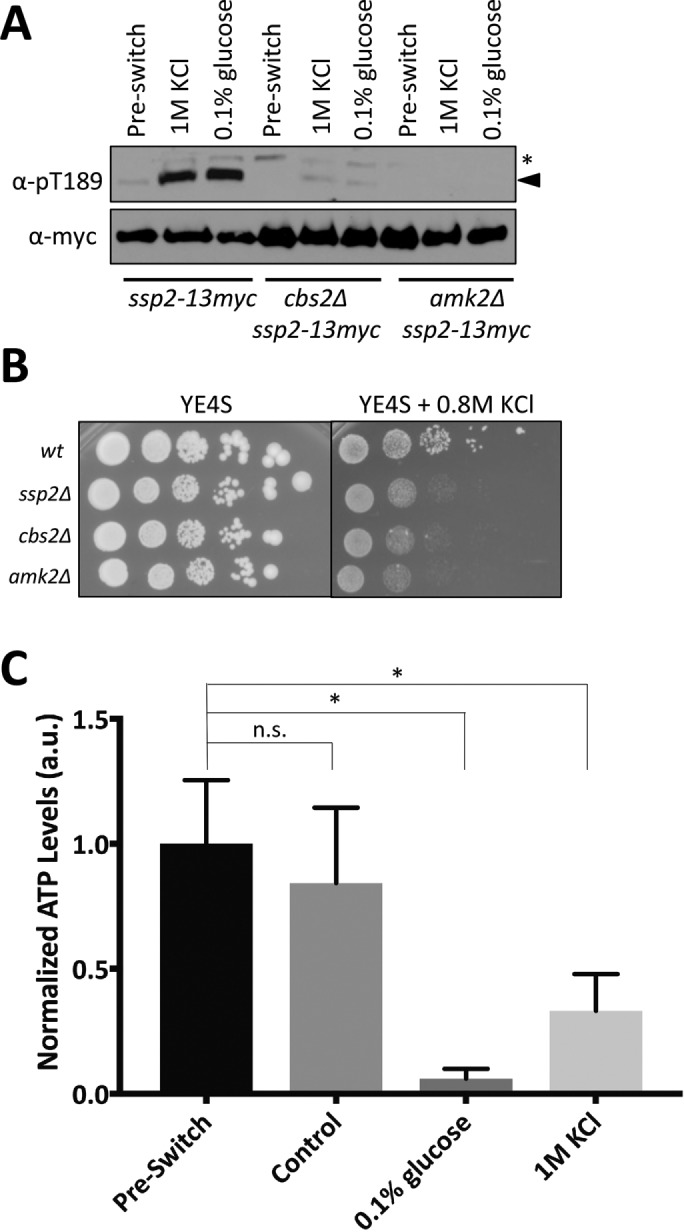
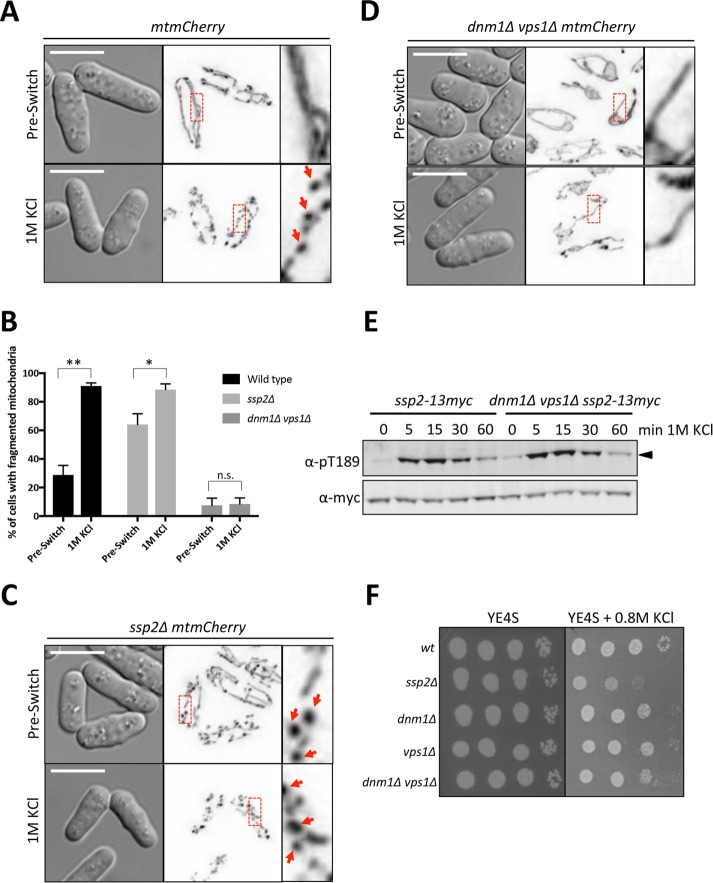
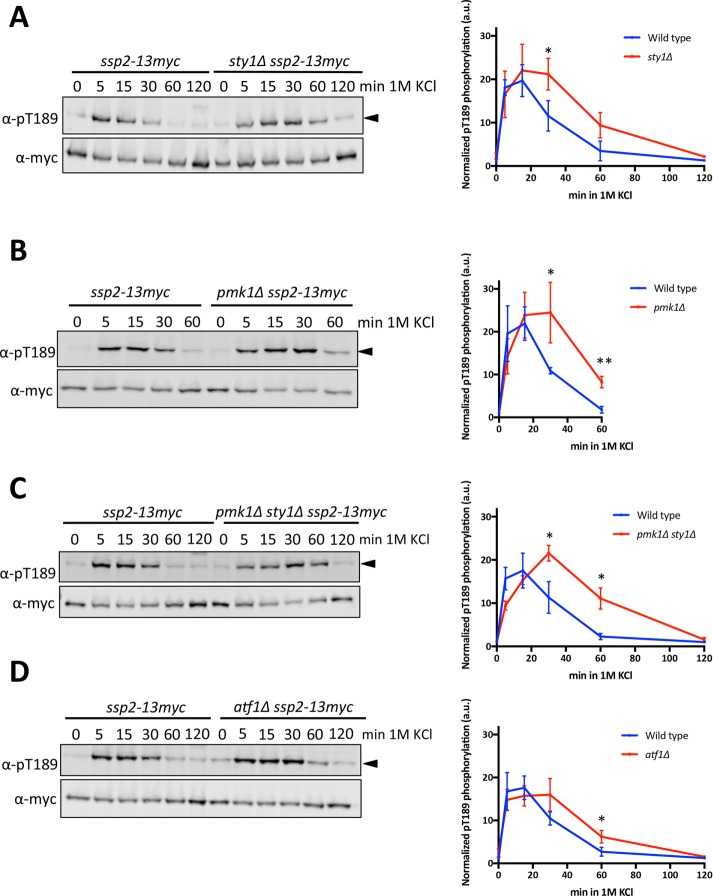
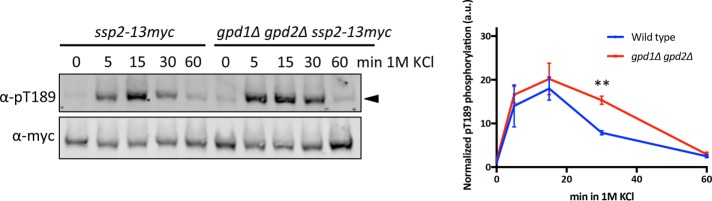
The heterotrimeric kinase AMPK acts as an energy sensor to coordinate cell metabolism with environmental status in species from yeast through humans. Low intracellular ATP leads to AMPK activation through phosphorylation of the activation loop within the catalytic subunit. Other environmental stresses also activate AMPK, but it is unclear whether cellular energy status affects AMPK activation under these conditions. Fission yeast AMPK catalytic subunit Ssp2 is phosphorylated at Thr-189 by the upstream kinase Ssp1 in low-glucose conditions, similar to other systems. Here we find that hyperosmotic stress induces strong phosphorylation of Ssp2-T189 by Ssp1. Ssp2-pT189 during osmotic stress is transient and leads to transient regulation of AMPK targets, unlike sustained activation by low glucose. Cells lacking this activation mechanism fail to proliferate after hyperosmotic stress. Activation during osmotic stress requires energy sensing by AMPK heterotrimer, and osmotic stress leads to decreased intracellular ATP levels. We observed mitochondrial fission during osmotic stress, but blocking fission did not affect AMPK activation. Stress-activated kinases Sty1 and Pmk1 did not promote AMPK activation but contributed to subsequent inactivation. Our results show that osmotic stress induces transient energy stress, and AMPK activation allows cells to manage this energy stress for proliferation in new osmotic states.
© 2017 Schutt and Moseley. This article is distributed by The American Society for Cell Biology under license from the author(s). Two months after publication it is available to the public under an Attribution–Noncommercial–Share Alike 3.0 Unported Creative Commons License (http://creativecommons.org/licenses/by-nc-sa/3.0).
Figures
Similar articles
-
AMPK phosphorylation by Ssp1 is required for proper sexual differentiation in fission yeast.J Cell Sci. 2012 Jun 1;125(Pt 11):2655-64. doi: 10.1242/jcs.098533. Epub 2012 Feb 28. J Cell Sci. 2012. PMID: 22375066
-
Phosphatases Generate Signal Specificity Downstream of Ssp1 Kinase in Fission Yeast.Mol Cell Biol. 2017 May 2;37(10):e00494-16. doi: 10.1128/MCB.00494-16. Print 2017 May 15. Mol Cell Biol. 2017. PMID: 28223368 Free PMC article.
-
Epe1 contributes to activation of AMPK by promoting phosphorylation of AMPK alpha subunit, Ssp2.Sci Rep. 2017 Jun 9;7(1):3208. doi: 10.1038/s41598-017-03442-0. Sci Rep. 2017. PMID: 28600551 Free PMC article.
-
[Regulation of energy metabolism by AMPK: a novel therapeutic approach for the treatment of metabolic and cardiovascular diseases].Med Sci (Paris). 2006 Apr;22(4):381-8. doi: 10.1051/medsci/2006224381. Med Sci (Paris). 2006. PMID: 16597407 Review. French.
-
AMP-activated protein kinase: structure and regulation.Curr Protein Pept Sci. 2008 Oct;9(5):478-92. doi: 10.2174/138920308785915254. Curr Protein Pept Sci. 2008. PMID: 18855699 Review.
Cited by
-
Decoupling of Rates of Protein Synthesis from Cell Expansion Leads to Supergrowth.Cell Syst. 2019 Nov 27;9(5):434-445.e6. doi: 10.1016/j.cels.2019.10.001. Epub 2019 Nov 6. Cell Syst. 2019. PMID: 31706948 Free PMC article.
-
Interplays of AMPK and TOR in Autophagy Regulation in Yeast.Cells. 2023 Feb 4;12(4):519. doi: 10.3390/cells12040519. Cells. 2023. PMID: 36831186 Free PMC article. Review.
-
Hyperosmotic Stress Initiates AMPK-Independent Autophagy and AMPK- and Autophagy-Independent Depletion of Thioredoxin 1 and Glyoxalase 2 in HT22 Nerve Cells.Oxid Med Cell Longev. 2019 Mar 27;2019:2715810. doi: 10.1155/2019/2715810. eCollection 2019. Oxid Med Cell Longev. 2019. PMID: 31049129 Free PMC article.
-
Dissecting the cell cycle regulation, DNA damage sensitivity and lifespan effects of caffeine in fission yeast.Microb Cell. 2025 Jun 24;12:141-156. doi: 10.15698/mic2025.06.852. eCollection 2025. Microb Cell. 2025. PMID: 40584586 Free PMC article.
-
Sml1 Inhibits the DNA Repair Activity of Rev1 in Saccharomyces cerevisiae during Oxidative Stress.Appl Environ Microbiol. 2020 Mar 18;86(7):e02838-19. doi: 10.1128/AEM.02838-19. Print 2020 Mar 18. Appl Environ Microbiol. 2020. PMID: 32005731 Free PMC article.
References
-
- Aiba H, Yamada H, Ohmiya R, Mizuno T. The osmo-inducible gpd1+ gene is a target of the signaling pathway involving Wis1 MAP-kinase kinase in fission yeast. FEBS Lett. 1995;376:199–201. - PubMed
-
- Albertyn J, Hohmann S, Thevelein JM, Prior BA. GPD1, which encodes glycerol-3-phosphate dehydrogenase, is essential for growth under osmotic stress in Saccharomyces cerevisiae, and its expression is regulated by the high-osmolarity glycerol response pathway. Mol Cell Biol. 1994;14:4135–4144. - PMC - PubMed
-
- Bähler J, Wu JQ, Longtine MS, Shah NG, McKenzie A, Steever AB, Wach A, Philippsen P, Pringle JR. Heterologous modules for efficient and versatile PCR-based gene targeting in Schizosaccharomyces pombe. Yeast. 1998;14:943–951. - PubMed
-
- Barnes K, Ingram JC, Porras OH, Barros LF, Hudson ER, Fryer LGD, Foufelle F, Carling D, Hardie DG, Baldwin SA. Activation of GLUT1 by metabolic and osmotic stress: potential involvement of AMP-activated protein kinase (AMPK) J Cell Sci. 2002;115:2433–2442. - PubMed
-
- Celenza JL, Carlson M. A yeast gene that is essential for release from glucose repression encodes a protein kinase. Science. 1986;233:1175–1180. - PubMed
MeSH terms
Substances
Grants and funding
LinkOut - more resources
Full Text Sources
Other Literature Sources
Molecular Biology Databases
