

Receptor for advanced glycation end products is targeted by FBXO10 for ubiquitination and degradation
- PMID: 28515150
- PMCID: PMC5572686
- DOI: 10.1096/fj.201700031R
Receptor for advanced glycation end products is targeted by FBXO10 for ubiquitination and degradation
Abstract
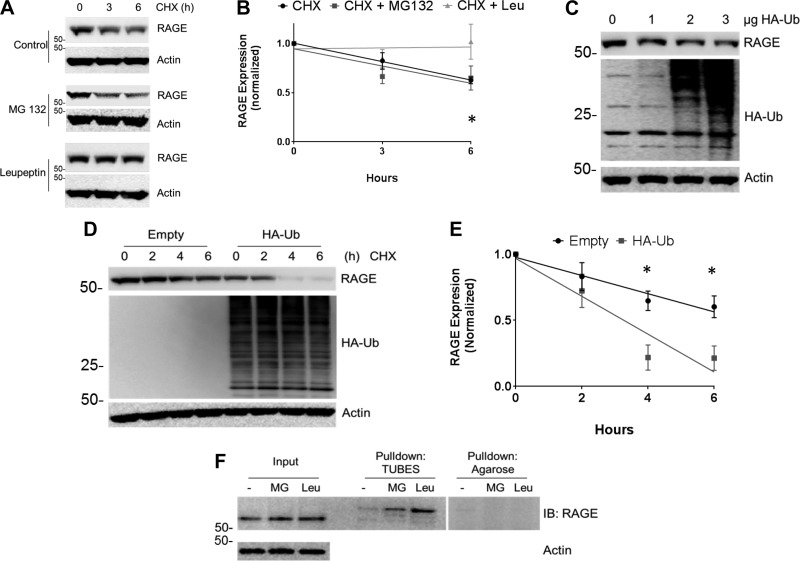
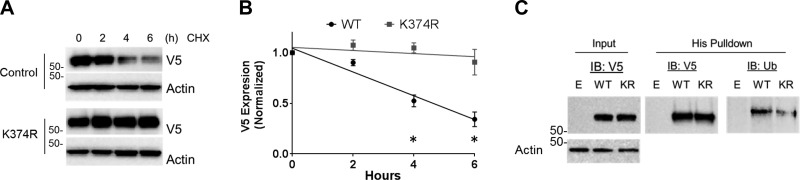
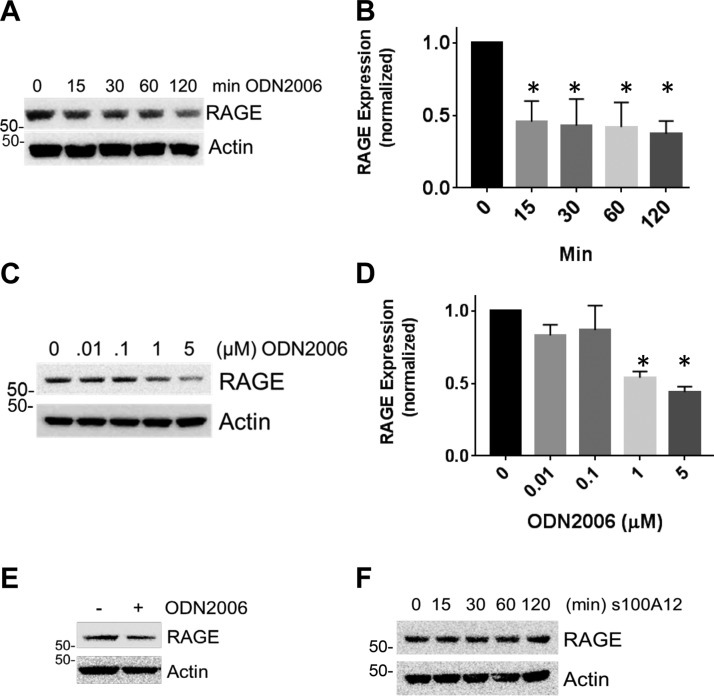
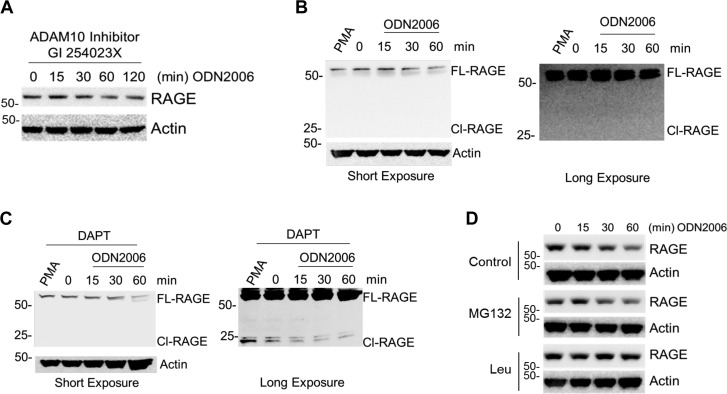
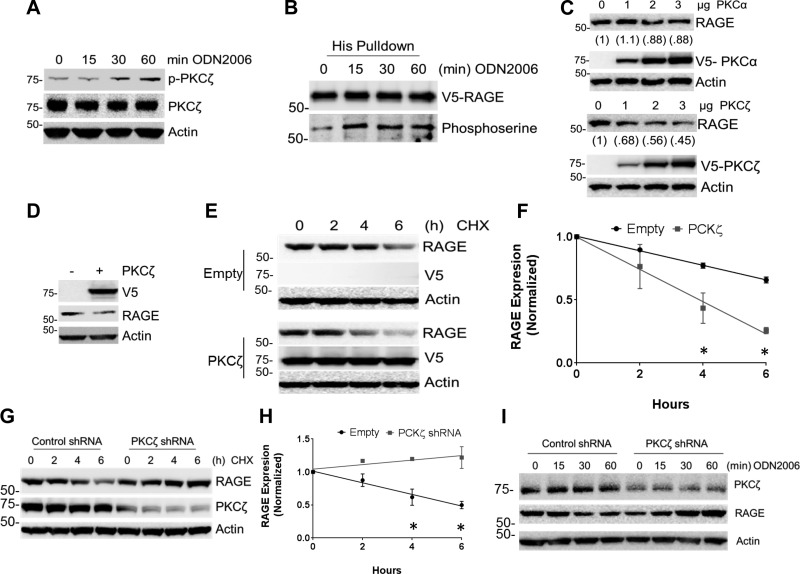
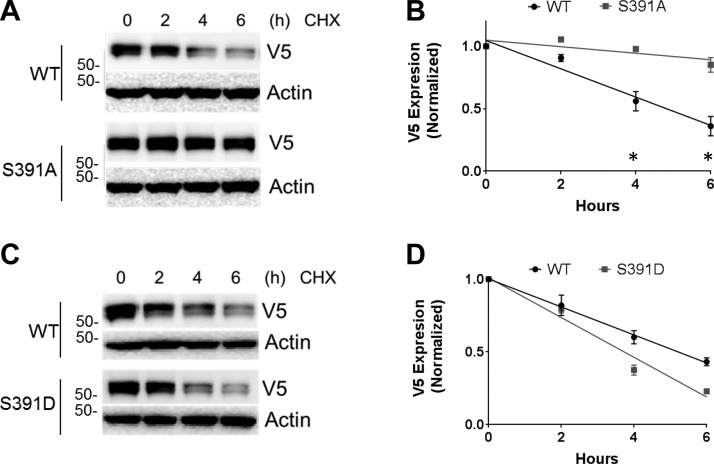
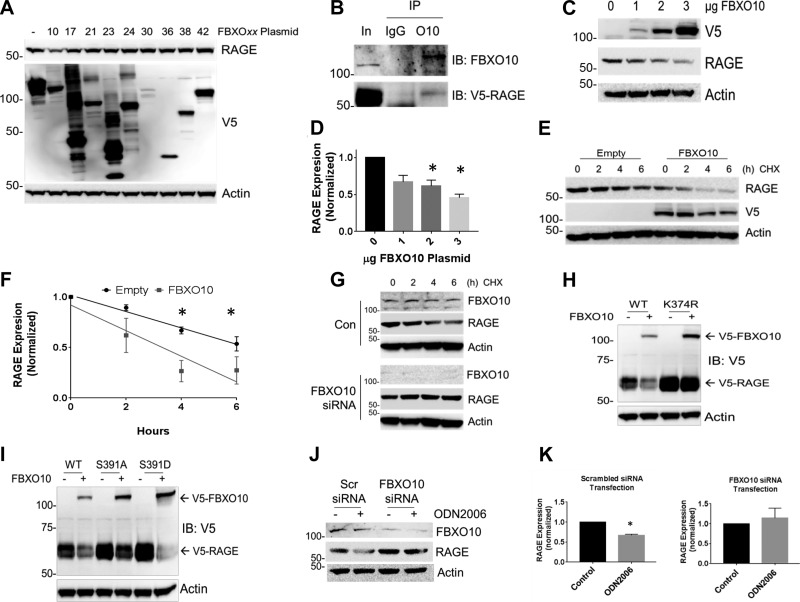
The receptor for advanced glycation end products (RAGE) is a highly expressed cell membrane receptor serving to anchor lung epithelia to matrix components, and it also amplifies inflammatory signaling during acute lung injury. However, mechanisms that regulate its protein concentrations in cells remain largely unknown. Here we show that RAGE exhibits an extended life span in lung epithelia (t½ 6 h), is monoubiquitinated at K374, and is degraded in lysosomes. The RAGE ligand ODN2006, a synthetic oligodeoxynucleotide resembling pathogenic hypomethylated CpG DNA, promotes rapid lysosomal RAGE degradation through activation of protein kinase Cζ (PKCζ), which phosphorylates RAGE. PKCζ overexpression enhances RAGE degradation, while PKCζ knockdown stabilizes RAGE protein levels and prevents ODN2006-mediated degradation. We identify that RAGE is targeted by the ubiquitin E3 ligase subunit F-box protein O10 (FBXO10), which associates with RAGE to mediate its ubiquitination and degradation. FBXO10 depletion in cells stabilizes RAGE and is required for ODN2006-mediated degradation. These data suggest that modulation of regulators involved in ubiquitin-mediated disposal of RAGE might serve as unique molecular inputs directing RAGE cellular concentrations and downstream responses, which are critical in an array of inflammatory disorders, including acute lung injury.-Evankovich, J., Lear, T., Mckelvey, A., Dunn, S., Londino, J., Liu, Y., Chen, B. B., Mallampalli, R. K. Receptor for advanced glycation end products is targeted by FBXO10 for ubiquitination and degradation.
Keywords: F-box proteins; acute lung injury; ubiquitin.
© FASEB.
Figures
Similar articles
-
FBXO10 prevents chronic unpredictable stress-induced behavioral despair and cognitive impairment through promoting RAGE degradation.CNS Neurosci Ther. 2021 Dec;27(12):1504-1517. doi: 10.1111/cns.13727. Epub 2021 Sep 7. CNS Neurosci Ther. 2021. PMID: 34492157 Free PMC article.
-
Modulation of leukotriene B4 receptor 1 signaling by receptor for advanced glycation end products (RAGE).FASEB J. 2016 May;30(5):1811-22. doi: 10.1096/fj.201500117. Epub 2016 Jan 26. FASEB J. 2016. PMID: 26813973
-
Integral role of receptor for advanced glycation end products (RAGE) in nondiabetic atherosclerosis.Fukushima J Med Sci. 2019;65(3):109-121. doi: 10.5387/fms.2019-12. Fukushima J Med Sci. 2019. PMID: 31915324 Free PMC article.
-
Glycation & the RAGE axis: targeting signal transduction through DIAPH1.Expert Rev Proteomics. 2017 Feb;14(2):147-156. doi: 10.1080/14789450.2017.1271719. Epub 2016 Dec 22. Expert Rev Proteomics. 2017. PMID: 27967251 Free PMC article. Review.
-
The Potential of Receptor for Advanced Glycation End Products (RAGE) as a Therapeutic Target for Lung Associated Diseases.Curr Drug Targets. 2019;20(6):679-689. doi: 10.2174/1389450120666181120102159. Curr Drug Targets. 2019. PMID: 30457049 Review.
Cited by
-
Scutellarein inhibits the development of colon cancer via CDC4‑mediated RAGE ubiquitination.Int J Mol Med. 2020 Apr;45(4):1059-1072. doi: 10.3892/ijmm.2020.4496. Epub 2020 Feb 10. Int J Mol Med. 2020. PMID: 32124957 Free PMC article.
-
The role of RAGE in host pathology and crosstalk between RAGE and TLR4 in innate immune signal transduction pathways.FASEB J. 2020 Dec;34(12):15659-15674. doi: 10.1096/fj.202002136R. Epub 2020 Nov 1. FASEB J. 2020. PMID: 33131091 Free PMC article. Review.
-
The RNFT2/IL-3Rα axis regulates IL-3 signaling and innate immunity.JCI Insight. 2020 Feb 13;5(3):e133652. doi: 10.1172/jci.insight.133652. JCI Insight. 2020. PMID: 31990690 Free PMC article.
-
Geranylgeranylated-SCFFBXO10 Regulates Selective Outer Mitochondrial Membrane Proteostasis and Function.bioRxiv [Preprint]. 2024 Apr 16:2024.04.16.589745. doi: 10.1101/2024.04.16.589745. bioRxiv. 2024. Update in: Cell Rep. 2024 Oct 22;43(10):114783. doi: 10.1016/j.celrep.2024.114783. PMID: 38659932 Free PMC article. Updated. Preprint.
-
Gene Expression of Sirtuin-1 and Endogenous Secretory Receptor for Advanced Glycation End Products in Healthy and Slightly Overweight Subjects after Caloric Restriction and Resveratrol Administration.Nutrients. 2018 Jul 21;10(7):937. doi: 10.3390/nu10070937. Nutrients. 2018. PMID: 30037068 Free PMC article. Clinical Trial.
References
-
- Shirasawa M., Fujiwara N., Hirabayashi S., Ohno H., Iida J., Makita K., Hata Y. (2004) Receptor for advanced glycation end-products is a marker of type I lung alveolar cells. Genes Cells 9, 165–174 - PubMed
-
- Guo W. A., Knight P. R., Raghavendran K. (2012) The receptor for advanced glycation end products and acute lung injury/acute respiratory distress syndrome. Intensive Care Med. 38, 1588–1598 - PubMed
-
- Ramsgaard L., Englert J. M., Manni M. L., Milutinovic P. S., Gefter J., Tobolewski J., Crum L., Coudriet G. M., Piganelli J., Zamora R., Vodovotz Y., Enghild J. J., Oury T. D. (2011) Lack of the receptor for advanced glycation end-products attenuates E. coli pneumonia in mice. PLoS One 6, e20132 - PMC - PubMed
Publication types
MeSH terms
Substances
Grants and funding
LinkOut - more resources
Full Text Sources
Other Literature Sources
Molecular Biology Databases
