Comparative Study
. 2017 Aug 1;118(2):986-1001.
doi: 10.1152/jn.00209.2017. Epub 2017 May 17.

Responses of Purkinje cells in the oculomotor vermis of monkeys during smooth pursuit eye movements and saccades: comparison with floccular complex

Affiliations
Comparative Study

Responses of Purkinje cells in the oculomotor vermis of monkeys during smooth pursuit eye movements and saccades: comparison with floccular complex

Ramanujan T Raghavan et al. J Neurophysiol. .

Abstract

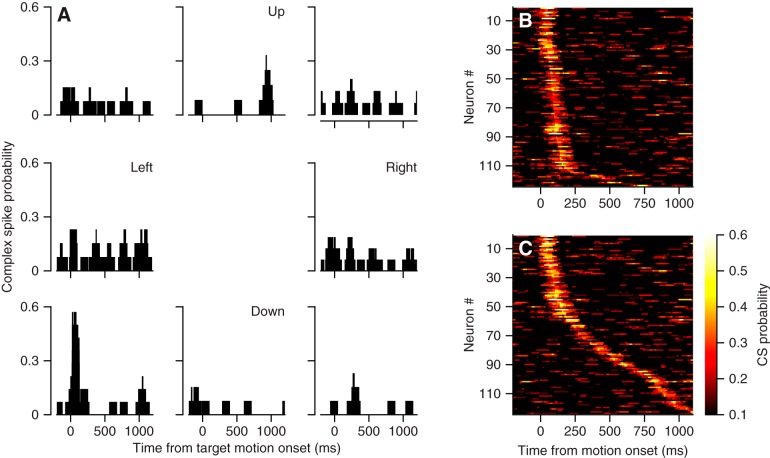
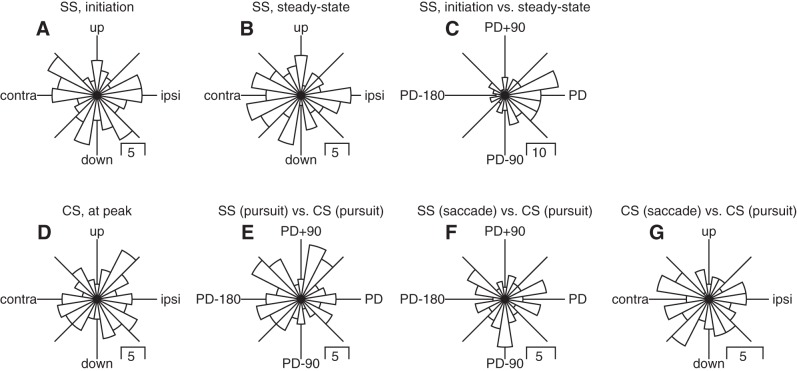
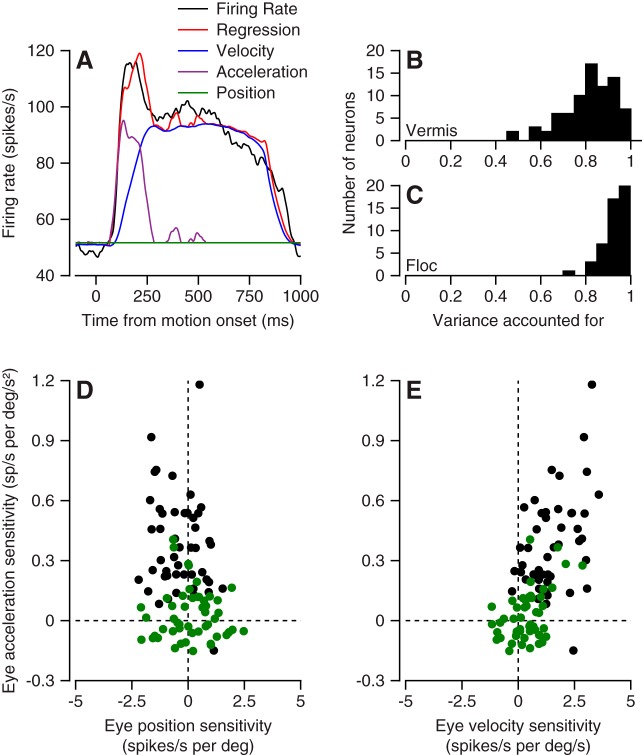
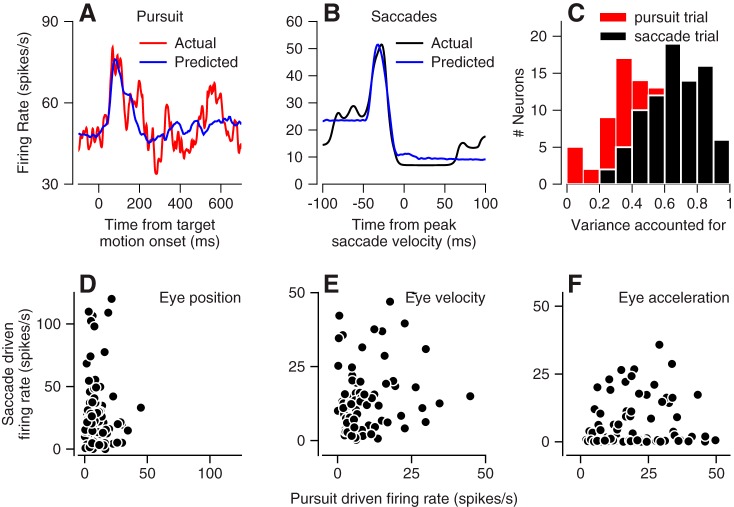
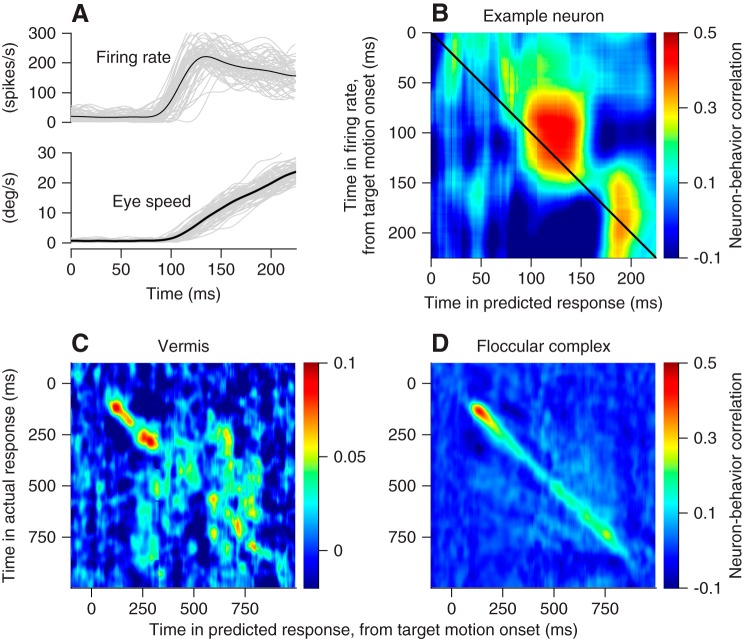
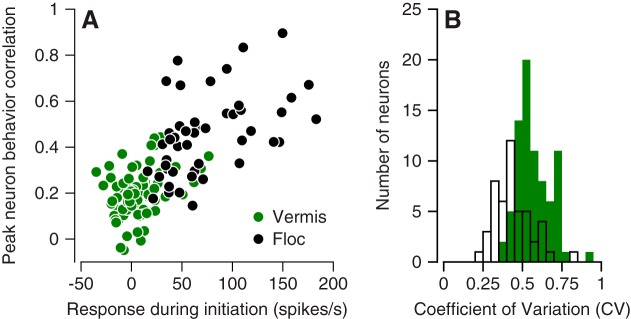
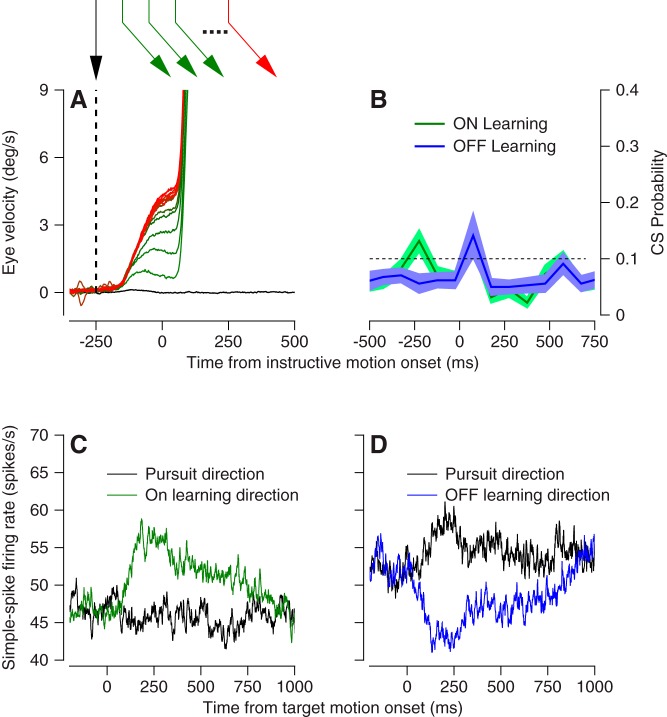
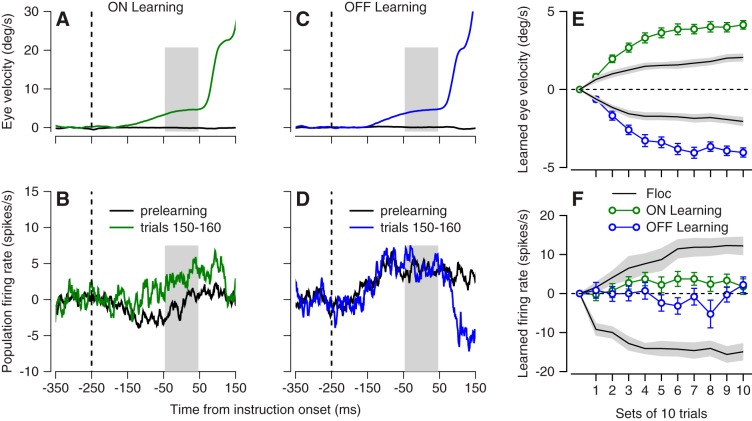
We recorded the responses of Purkinje cells in the oculomotor vermis during smooth pursuit and saccadic eye movements. Our goal was to characterize the responses in the vermis using approaches that would allow direct comparisons with responses of Purkinje cells in another cerebellar area for pursuit, the floccular complex. Simple-spike firing of vermis Purkinje cells is direction selective during both pursuit and saccades, but the preferred directions are sufficiently independent so that downstream circuits could decode signals to drive pursuit and saccades separately. Complex spikes also were direction selective during pursuit, and almost all Purkinje cells showed a peak in the probability of complex spikes during the initiation of pursuit in at least one direction. Unlike the floccular complex, the preferred directions for simple spikes and complex spikes were not opposite. The kinematics of smooth eye movement described the simple-spike responses of vermis Purkinje cells well. Sensitivities were similar to those in the floccular complex for eye position and considerably lower for eye velocity and acceleration. The kinematic relations were quite different for saccades vs. pursuit, supporting the idea that the contributions from the vermis to each kind of movement could contribute independently in downstream areas. Finally, neither the complex-spike nor the simple-spike responses of vermis Purkinje cells were appropriate to support direction learning in pursuit. Complex spikes were not triggered reliably by an instructive change in target direction; simple-spike responses showed very small amounts of learning. We conclude that the vermis plays a different role in pursuit eye movements compared with the floccular complex.NEW & NOTEWORTHY The midline oculomotor cerebellum plays a different role in smooth pursuit eye movements compared with the lateral, floccular complex and appears to be much less involved in direction learning in pursuit. The output from the oculomotor vermis during pursuit lies along a null-axis for saccades and vice versa. Thus the vermis can play independent roles in the two kinds of eye movement.

Keywords: cerebellum; complex spikes; kinematic models; motor learning; simple spikes.


Figures

Fig. 1.
Fig. 1.
Example recording from a Purkinje cell in the oculomotor vermis during pursuit eye movements. A–C: averages of eye and target position, velocity, and acceleration vs. time for step-ramp target motion. Dashed and solid lines show target and eye kinematics, respectively. D: extracellular potentials from a Purkinje cell on slow and fast time base, showing both simple spikes and 1 complex spike (labeled CS). E: raster showing simple-spike times during 100 repetitions of the same target motion and pursuit eye movement. Each line shows data from 1 trial, and each dot indicates the time of occurrence of 1 action potential.
Fig. 2.
Fig. 2.
Direction tuning during pursuit for the population of Purkinje cells in the oculomotor vermis. A–C: firing rate vs. time for pursuit in 8 directions in 3 example Purkinje cells. Traces are color-coded to match the bubble plots at right, where each circle is plotted in polar coordinates to indicate the direction of target motion and the size of the circle indicates simple-spike firing rate in the interval from 150 to 250 ms after the onset of target motion. D and E: scatterplots showing simple-spike firing rate vs. baseline for each Purkinje cell in our sample, with the null and preferred directions on the y- and x-axis. D and E show firing rate measured 150–250 and 500–600 ms after the onset of target motion. F and G: distribution of direction selectivity index for simple-spike firing rate measured 150–250 or 500–600 ms after the onset of target motion. H and I: latency of simple-spike firing rate in the preferred direction, relative to the onset of pursuit for Purkinje cells in the vermis (H) and floccular complex (Floc; I). In DH, green and black show data from the oculomotor vermis and the floccular complex.
Fig. 3.
Fig. 3.
Comparison of direction tuning in oculomotor vermis for pursuit and saccadic eye movements. A and C: simple-spike firing vs. time during pursuit in 8 directions for 2 example Purkinje cells. B and D: simple-spike firing vs. time during 10° amplitude saccades in 8 directions for the same 2 Purkinje cells. Colors of traces correspond to colors of dots in each inset and indicate the direction of the target motion for pursuit or the target step for saccades. E: polar histogram indicating the distribution of the difference in preferred direction (PD) of vermis Purkinje cells for saccades vs. pursuit.
Fig. 4.
Fig. 4.
Independent direction tuning for pursuit and saccades in the oculomotor vermis. A and B: simple-spike firing rate during saccades vs. time averaged across the population of Purkinje cells for responses in the preferred direction for pursuit (A) or saccades (B). D and E: simple-spike firing rate during pursuit vs. time averaged across the population of Purkinje cells for responses in the preferred direction for pursuit (D) or saccades (E). In A, B, D, and E, dark curves show average firing rate and the light gray ribbon shows the standard error of the mean. C: direction tuning for saccades. F: direction tuning for pursuit. In C and F, filled and open symbols show average direction tuning curves for the full sample of Purkinje cells where 0° was chosen to be the preferred direction for pursuit or saccades, respectively.
Fig. 5.
Fig. 5.
Complex-spike responses of Purkinje cells in the oculomotor vermis during pursuit eye movements. A: direction tuning for an example Purkinje cell. Each graph is positioned to indicate the direction of target motion and the histograms show the probability of a complex spike as a function of time in a sliding 100-ms bin. B and C: summary of probability of complex spikes during pursuit in the preferred direction, where preferred direction is defined in B by the largest response in the interval from 50 to 250 ms after the onset of target motion and in C by the largest response across the entire trial. Here, the colors indicate the probability of a complex spike in a 100-ms sliding bin, each horizontal line shows data for 1 Purkinje cell, and time goes from left to right.
Fig. 6.
Fig. 6.
Direction tuning of simple spikes (SS) and complex spikes for the population of Purkinje cells in the oculomotor vermis during saccades and pursuit. A–G contain a polar histogram showing the distribution of a particular measure of preferred direction across the full sample of Purkinje cells. A: simple-spike firing from 150 to 250 ms after the onset of target motion. B: simple-spike firing from 500 to 600 ms after the onset of target motion. C: difference for simple-spike firing between 150 and 250 and 500–600 ms after the onset of target motion. D: peak complex-spike probability in the interval from 50 to 250 ms after the onset of target motion. E: difference between preferred simple-spike and complex-spike direction, both in the interval from 50 to 250 ms after the onset of target motion. F: difference between preferred simple-spike direction during saccades and preferred complex-spike direction during pursuit initiation. G: difference between preferred complex-spike directions during saccades and pursuit.
Fig. 7.
Fig. 7.
Comparison of relationship between simple-spike firing and eye kinematics during pursuit for oculomotor vermis and floccular complex. A: firing rate vs. time showing the contribution of different kinematic components, according to the colors in the key. B and C: variance accounted for by Eq. 2 for Purkinje cells in oculomotor vermis (B) and floccular complex (C). D and E: scatterplots summarizing sensitivity to eye position, velocity, and acceleration for our full sample of Purkinje cells. Green and black symbols show data for oculomotor vermis and floccular complex.
Fig. 8.
Fig. 8.
Comparison of relationship between simple-spike firing and eye kinematics in oculomotor vermis for pursuit vs. saccades. A and B: fits of Eq. 3 to simple-spike firing rate in an example Purkinje cell for pursuit (A) and saccades (B). C: variance accounted for in fits to data for pursuit and saccades. Pink and black bars show data for pursuit vs. saccades D–F: scatterplots summarizing size of firing rate responses eye position, velocity, and acceleration for our full sample of Purkinje cells. The y- and x-axes show data for saccades and pursuit.
Fig. 9.
Fig. 9.
Comparison of trial-by-trial neuron-behavior correlations in oculomotor vermis and floccular complex. A: example data from 1 Purkinje cell. Black traces show averages across trials and gray traces show single trials. B–D: each pixel uses color to show the trial-by-trial correlation coefficient between actual firing rate and the firing rate predicted by the regression fit at the times shown on the y- and x-axis. B: data for an example Purkinje cell in the oculomotor vermis. C: averages across all Purkinje cells recorded in the oculomotor vermis. D: averages across all Purkinje cells recorded in the floccular complex.
Fig. 10.
Fig. 10.
Quantitative comparison of neuron-behavior correlations in oculomotor vermis and floccular complex. A: scatterplot showing relationship between the peak neuron-behavior correlation and the peak response during pursuit initiation for all individual Purkinje cells. Green and black symbols show data for vermis and floccular complex. B: distribution of the coefficient of variation of interspike intervals during fixation at straight ahead for both samples of Purkinje cells: Green and white bars show data for vermis and floccular complex.
Fig. 11.
Fig. 11.
Experimental design to study direction learning in pursuit. A: eye velocity in the learning direction vs. time at different phases of a pursuit learning experiment. Colors of traces correspond to colors and temporal sequence of target motions, indicated in the schematic at top. B: average complex-spike probability vs. time across the full sample of Purkinje cells in the oculomotor vermis in learning trials designed to cause learning in either the on- or off-direction for the Purkinje cell under study. C and D: average firing rate vs. time in the prelearning baseline block, comparing data for tracking in the pursuit or learning directions for on-direction (C) or off-direction (D) learning blocks.
Fig. 12.
Fig. 12.
Very small learned changes in simple-spike firing during direction learning in the oculomotor vermis. A and B: learned eye velocity (A) and change in simple-spike firing rate (C) for on-direction learning blocks in an example Purkinje cell. C and D: learned eye velocity (C) and change in simple-spike firing rate (D) for on-direction learning blocks in an example Purkinje cell. E: learning curves for eye velocity. F: learning curves for simple-spike firing rate. In E and F, green and blue symbols show averages across all experiments for on-direction and off-direction learning in the oculomotor vermis, and black traces summarize data from the floccular complex. Gray ribbons indicate means ± SE across floccular Purkinje cells.

Similar articles

Cited by

References

    1. Badura A, Schonewille M, Voges K, Galliano E, Renier N, Gao Z, Witter L, Hoebeek FE, Chédotal A, De Zeeuw CI. Climbing fiber input shapes reciprocity of Purkinje cell firing. Neuron 78: 700–713, 2013. doi:10.1016/j.neuron.2013.03.018. - DOI - PubMed
    1. Berens P. CircStat: a MATLAB toolbox for circular statistics. J Stat Softw 31: 1–21, 2009. doi:10.18637/jss.v031.i10. - DOI
    1. Carey MR. Synaptic mechanisms of sensorimotor learning in the cerebellum. Curr Opin Neurobiol 21: 609–615, 2011. doi:10.1016/j.conb.2011.06.011. - DOI - PubMed
    1. Churchland MM, Cunningham JP, Kaufman MT, Ryu SI, Shenoy KV. Cortical preparatory activity: representation of movement or first cog in a dynamical machine? Neuron 68: 387–400, 2010. doi:10.1016/j.neuron.2010.09.015. - DOI - PMC - PubMed
    1. Dash S, Catz N, Dicke PW, Thier P. Encoding of smooth-pursuit eye movement initiation by a population of vermal Purkinje cells. Cereb Cortex 22: 877–891, 2012. doi:10.1093/cercor/bhr153. - DOI - PubMed

Publication types

LinkOut - more resources