. 2017 May 17;9(390):eaah5084.
doi: 10.1126/scitranslmed.aah5084.

BET bromodomain inhibition suppresses innate inflammatory and profibrotic transcriptional networks in heart failure

Affiliations

BET bromodomain inhibition suppresses innate inflammatory and profibrotic transcriptional networks in heart failure

Qiming Duan et al. Sci Transl Med. .

Erratum in

Abstract

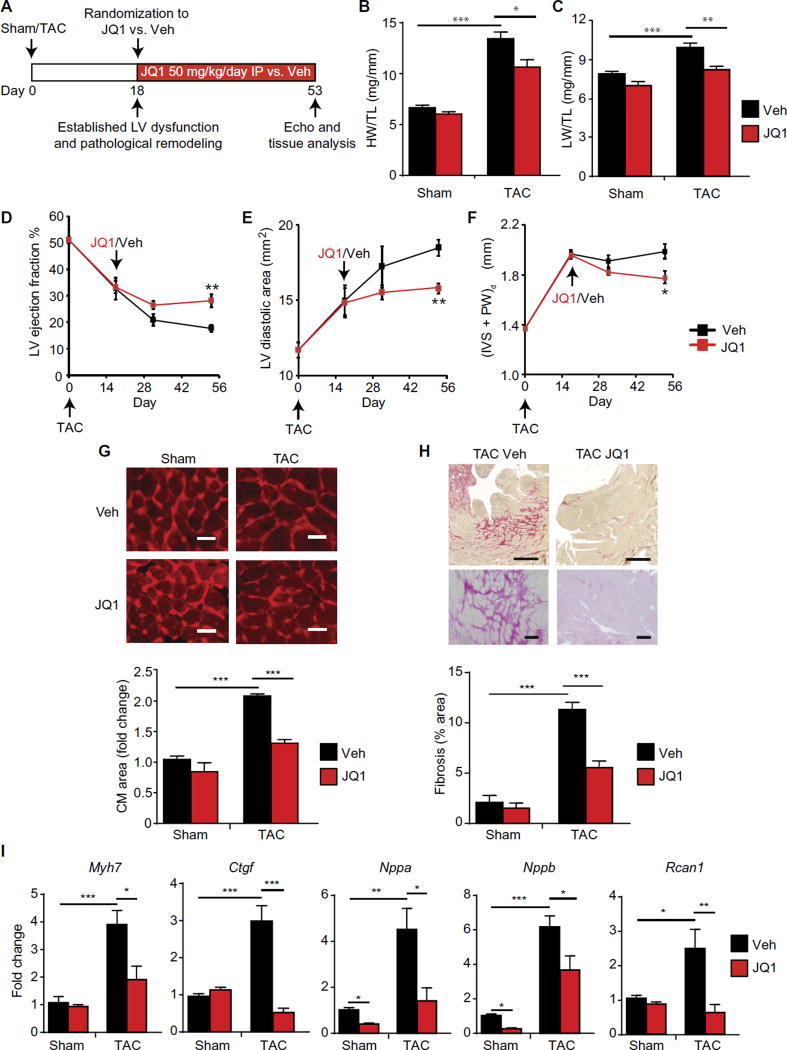
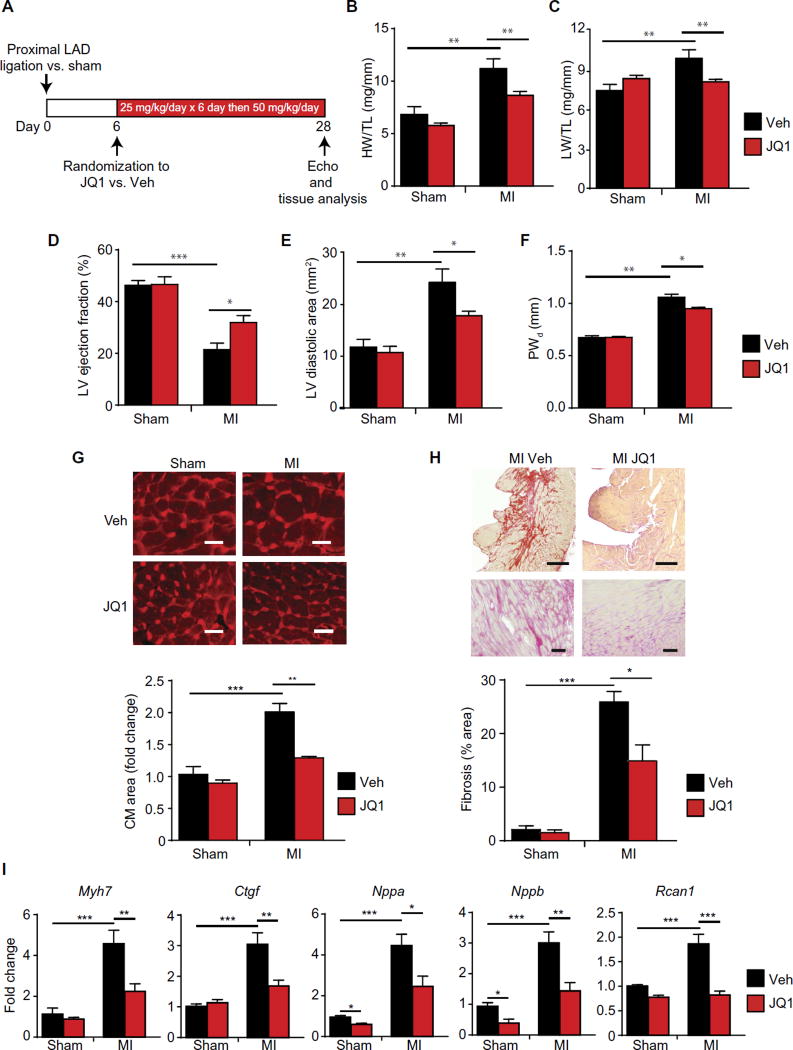
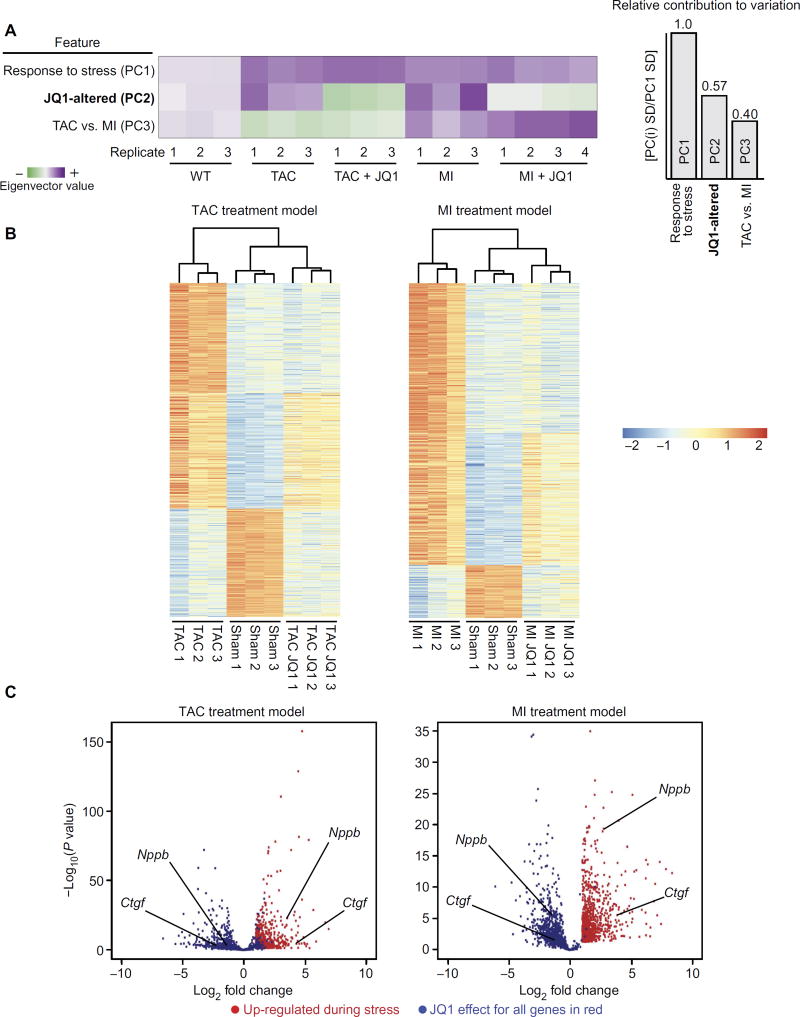
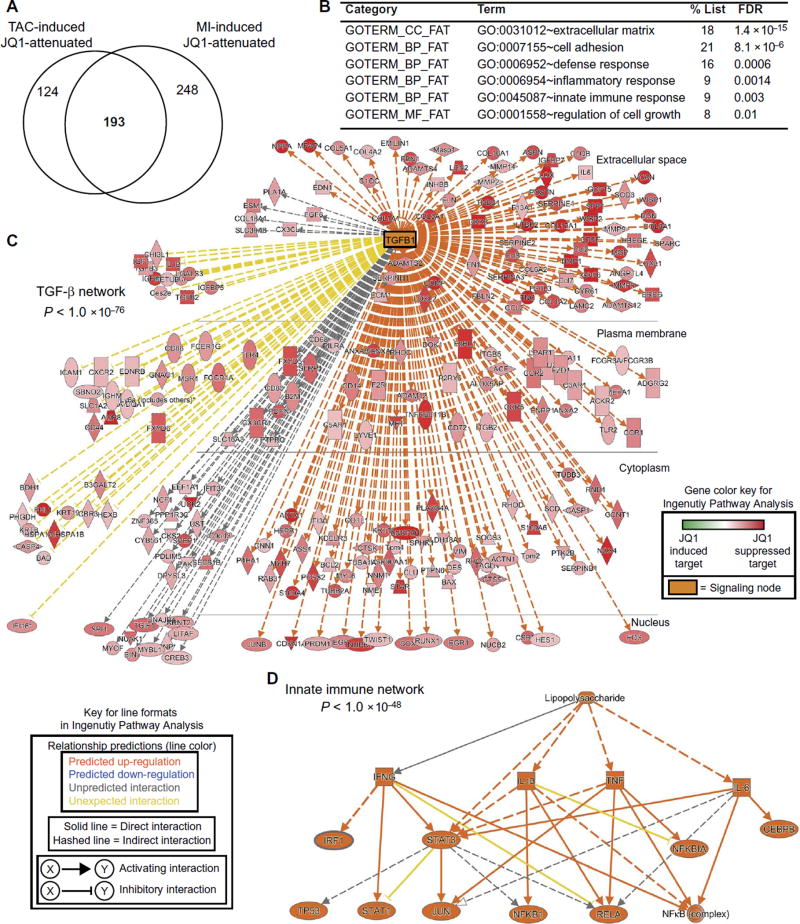
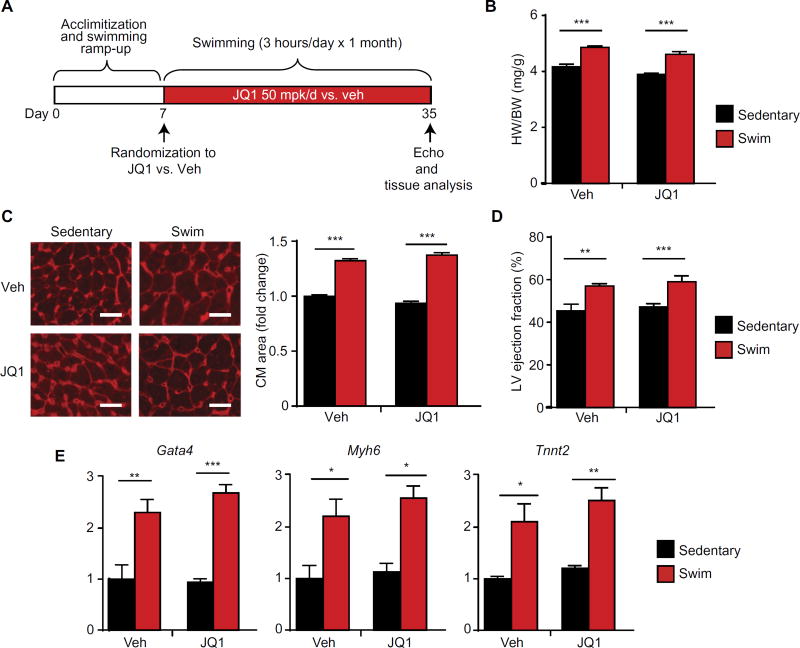
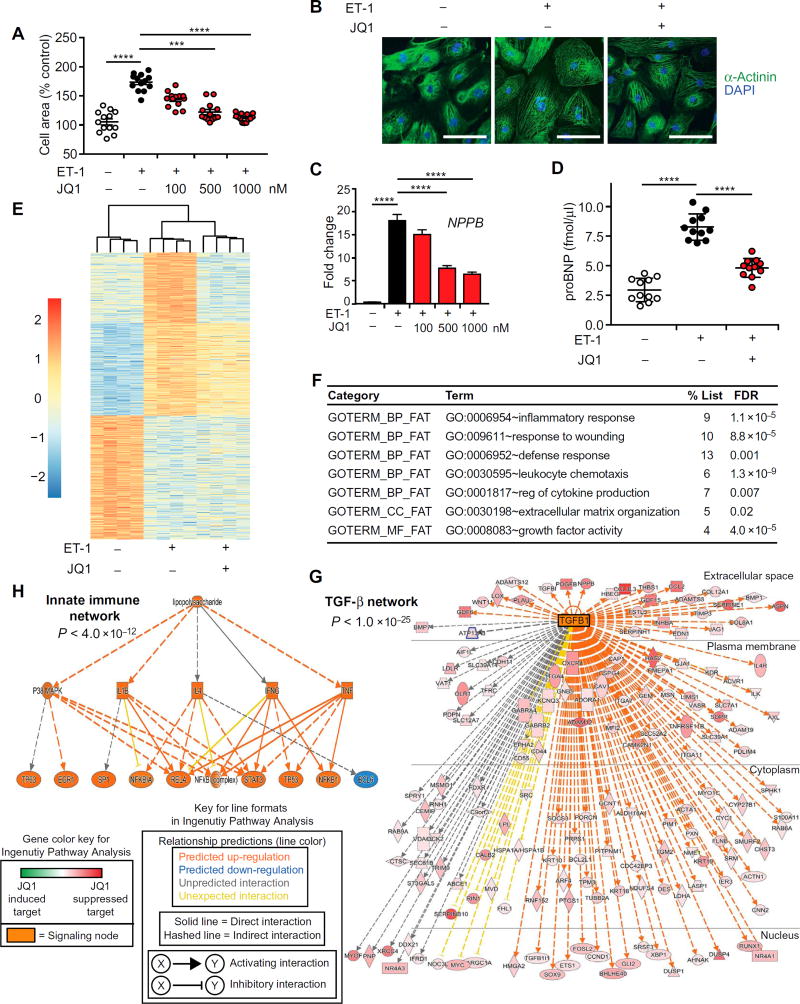
Despite current standard of care, the average 5-year mortality after an initial diagnosis of heart failure (HF) is about 40%, reflecting an urgent need for new therapeutic approaches. Previous studies demonstrated that the epigenetic reader protein bromodomain-containing protein 4 (BRD4), an emerging therapeutic target in cancer, functions as a critical coactivator of pathologic gene transactivation during cardiomyocyte hypertrophy. However, the therapeutic relevance of these findings to human disease remained unknown. We demonstrate that treatment with the BET bromodomain inhibitor JQ1 has therapeutic effects during severe, preestablished HF from prolonged pressure overload, as well as after a massive anterior myocardial infarction in mice. Furthermore, JQ1 potently blocks agonist-induced hypertrophy in human induced pluripotent stem cell-derived cardiomyocytes (iPSC-CMs). Integrated transcriptomic analyses across animal models and human iPSC-CMs reveal that BET inhibition preferentially blocks transactivation of a common pathologic gene regulatory program that is robustly enriched for NFκB and TGF-β signaling networks, typified by innate inflammatory and profibrotic myocardial genes. As predicted by these specific transcriptional mechanisms, we found that JQ1 does not suppress physiological cardiac hypertrophy in a mouse swimming model. These findings establish that pharmacologically targeting innate inflammatory and profibrotic myocardial signaling networks at the level of chromatin is effective in animal models and human cardiomyocytes, providing the critical rationale for further development of BET inhibitors and other epigenomic medicines for HF.


Conflict of interest statement

Competing interests: S.M.H. and D.S. are scientific co-founders and shareholders of Tenaya Therapeutics and serve as consultants for this entity. J.E.B. is now a shareholder and executive of Novartis Pharmaceuticals. S.M.H., J.E.B., and J.D.B. are co-inventors on patent application US20160095867A1 entitled “BET inhibition therapy for heart disease” held jointly by the Dana-Farber Cancer Institute, the Case Western Reserve University, and the Brigham and Women’s Hospital that covers methods for treating cardiac diseases using BET inhibitors. All other authors declare that they have no competing interests.

Figures

Fig. 1
Fig. 1. BET bromodomain inhibition treats preestablished HF after prolonged pressure overload
(A) Experimental protocol for preestablished pressure overload model induced by TAC in mice. Veh, vehicle. (B) Ratio of heart weight/tibia length (HW/TL) (n = 10) and (C) lung weight/tibia length (LW/TL) (n = 10). (D) LV ejection fraction, (E) LV diastolic area, and (F) LV wall thickness quantified by echocardiography (n = 10). (IVS + PW)d is the total thickness of the interventricular septum and posterior LV wall at the end-diastole. (G) Representative LV cross sections stained with wheat germ agglutinin (WGA) with quantification of mean cardiomyocyte (CM) cell area shown below (n = 3 to 4). Scale bars, 20 µm. (H) Representative LV cross sections stained with picrosirius red. Scale bars, 400 µm (top) and 100 µm (bottom). Quantification of fibrotic area below (n = 5). (I) Quantitative reverse transcription polymerase chain reaction (qRT-PCR) for indicated genes in mouse heart tissue (n = 5). For (A) to (I), *P < 0.05, **P < 0.01, ***P < 0.001 for indicated comparison. Data are shown as means ± SEM.
Fig. 2
Fig. 2. BET bromodomain inhibition ameliorates HF after a massive anterior wall myocardial infarction
(A) Experimental protocol for MI model induced by surgical ligation of the proximal LAD coronary artery. (B and C) Gravimetric measurements on day 28. Ratios of heart weight/tibia length and lung weight/tibia length were measured (n = 10). (D) LV ejection fraction, (E) LV diastolic area, and (F) LV posterior wall thickness quantified by echocardiography on day 28 [n= 10 (MI) and6 (sham)]. PWd is the thickness of the posterior LV wall (remote LV) at the end-diastole. The mid-LV interventricular septum was transmurally infarcted in this model and was therefore not relevant to the wall thickness assessment. (G) Representative cross sections from remote LV stained with WGA with quantification of mean cardiomyocyte (CM) cell area shown below (n = 3 to 4). Scale bars, 20 µm. (H) Representative cross sections from remote LV stained with picrosirius red. Scale bars, 400 µm (top) and 100 µm (bottom). Quantification of fibrotic area below (n = 5). (I) qRT-PCR for indicated genes in remote LV tissue (n = 5). For (A) to (I), *P < 0.05, **P < 0.01, ***P < 0.001 for indicated comparison. Data are shown as means ± SEM.
Fig. 3
Fig. 3. BET bromodomain inhibition suppresses transactivation of a specific stress-inducible gene program during HF pathogenesis
(A) Global display of information content derived from principal components analysis of RNA-seq data. Each row in the principal components analysis plot is an eigenvector that describes a feature across all samples. The purple to green shading scale reflects the magnitude of the principal components analysis eigenvector for the component of interest. Summary bar plots on the right show that the largest source of variance in the data can be explained by the response to stress (TAC and MI) with the next largest source of variation ascribed to JQ1-associated changes in gene expression. A smaller source of variation can be ascribed to differences in gene expression between the TAC and MI models. (B) Heat map of genes differentially expressed with stress in the TAC (left) and MI model (right). Scale is log2. Statistical criteria from DESeq analysis were ≥2-fold change and a false discovery rate of <0.05. The top one-third of each heat map is the cluster of genes that are up-regulated with stress and dampened by JQ1. The middle one-third of each heat map is the cluster of genes up-regulated with stress and unaffected by JQ1, demonstrating specificity. The bottom one-third of each heat map shows that genes that are down-regulated with stress are not significantly reversed by JQ1. (C) Volcano plot demonstrating magnitude and significance of JQ1 on suppressing induction of stress-inducible genes in both the TAC and MI models. Genes up-regulated by TAC (left) or MI (right) versus sham are plotted in red. Plotted in blue is the effect of JQ1 (stress-JQ1 versus stress-vehicle) for each gene shown in red. Representative genes are called out (black lines) for each volcano plot.
Fig. 4
Fig. 4. BET bromodomain inhibition suppresses transactivation of shared transcriptional networks across HF models
(A) Venn diagram showing significant overlap of gene sets that are stress-induced and JQ1-suppressed across the TAC and MI models (χ2 < 0.001). A common set of 193 genes was identified as being shared targets of BET bromodomain inhibition (gene list is provided in table S4). (B) Gene ontology analysis using DAVID for the Venn overlap genes shown in (A). A false discovery rate (FDR) of <0.05 was considered statistically significant. (C and D) Ingenuity Pathway Analysis. The common gene set was analyzed by Ingenuity Pathway Analysis. These analyses revealed two dominant signaling networks that were highly enriched in the set of genes suppressed by JQ1. (C) A large TGF-β network (P < 1.0 × 10−76). Each target gene is shown in red, with the darkness of red shading designating the relative degree of inhibition by JQ1 of that particular gene. Although the legend includes a green color scale for JQ1–up-regulated genes, there are no green-shaded genes on this diagram because all genes were selected a priori to be those that are suppressed by JQ1. TGFB1 as a central node gene is shown in orange. (D) JQ1 suppressed genes enriched for a network of innate immune signaling nodes with strong convergence on NFκB transcriptional responses (P < 1.0 × 10−48). Keys for the Ingenuity Pathway Analysis color shading and line formatting schemes are provided in the figure.
Fig. 5
Fig. 5. BET bromodomain inhibition does not suppress physiologic cardiac hypertrophy in response to chronic endurance exercise training
(A) Schematic of swimming protocol. (B) Gravimetry; heart weight/body weight ratio on day 35 (n = 7). (C) Representative LV cross sections stained with WGA with quantification of mean cardiomyocyte cell area shown at the right (n = 5). Scale bars, 20 µm. (D) Echocardiographic LV ejection fraction on day 35 (n = 7). (E) qRT-PCR for indicated genes in mouse LV tissue (n= 5). For (B) to (E), *P < 0.05, **P < 0.01, ***P < 0.001 for indicated comparisons. No statistically significant JQ1 effect was observed. Data are shown as means ± SEM.
Fig. 6
Fig. 6. BET bromodomain inhibition blocks agonist-induced hypertrophy and stress-mediated gene transactivation in human iPSC-CMs
(A) Human iPSC-CMs treated with ET-1 (10 nM), JQ1, or vehicle for 18 hours and stained for α-actinin immunofluorescence for quantification of cell area (n = 12). Bars designate means ± SEM. (B) Representative images of human iPSC-CM stained for α-actinin immunofluorescence. ET-1 (10 nM) and JQ1 (1000 nM); 18 hours. Scale bars, 100 µm. (C) qRT-PCR for NPPB/BNP in iPSC-CMs (n= 12). Data are shown as means ± SEM. (D) ELISA for proBNP protein concentration in medium of iPSC-CM (n = 11). ET-1 (10 nM) and JQ1 (1000 nM); 18 hours. Bars designate means ± SEM. For (A), (C), and (D), ****P < 0.0001, ***P < 0.0005. (E) Heat map of genes differentially expressed in iPSC-CM with ET-1 stimulation. Statistical criteria from DESeq analysis were ≥2-fold change and a false discovery rate of <0.05. The top one-third of each heat map is the cluster of genes that are up-regulated with ET-1 and dampened by JQ1. The middle one-third of each heat map is the cluster of genes up-regulated with ET-1 and unaffected by JQ1, demonstrating specificity. The bottom one-third of each heat map shows that genes that are down-regulated with ET-1 are not significantly reversed by JQ1. Scale is log2. (F) Gene ontology analysis using DAVID for the set of genes that were ET-1–inducible and suppressed by JQ1 (top third of heat map). A false discovery rate of <0.05 was considered statistically significant. (G and H) Ingenuity Pathway Analysis. The set of ET-1–induced genes that were attenuated by JQ1 was analyzed by Ingenuity Pathway Analysis. These analyses revealed two dominant signaling networks that were highly enriched in the set of genes suppressed by JQ1 and paralleled the findings in mouse heart tissue from Fig. 4. (G) A large TGF-β network (P < 1.0 × 10⁻²⁵). Each target gene is shown in red, with the darkness of red shading designating the relative degree of inhibition by JQ1 of that particular gene. Although the legend includes a green color scale for JQ1–up-regulated genes, there are no green-shaded genes on this diagram because all genes were selected a priori to be those that are suppressed by JQ1. TGFB1 as a central node gene is shown in orange. (H) JQ1 suppressed genes enriched for a network of innate immune signaling nodes with strong convergence on NFκB transcriptional responses (P < 1.0 × 10−48). Keys for the Ingenuity Pathway Analysis color shading and line formatting schemes are provided.

Comment in

References

    1. Braunwald E. Research advances in heart failure: A compendium. Circ. Res. 2013;113:633–645. - PubMed
    1. Roger VL, Go AS, Lloyd-Jones DM, Benjamin EJ, Berry JD, Borden WB, Bravata DM, Dai S, Ford ES, Fox CS, Fullerton HJ, Gillespie C, Hailpern SM, Heit JA, Howard VJ, Kissela BM, Kittner SJ, Lackland DT, Lichtman JH, Lisabeth LD, Makuc DM, Marcus GM, Marelli A, Matchar DB, Moy CS, Mozaffarian D, Mussolino ME, Nichol G, Paynter NP, Soliman EZ, Sorlie PD, Sotoodehnia N, Turan TN, Virani SS, Wong ND, Woo D, Turner MB. Executive summary: Heart disease and stroke statistics—2012 update: A report from the American Heart Association. Circulation. 2012;125:188–197. - PubMed
    1. Hill JA, Olson EN. Cardiac plasticity. N. Engl. J. Med. 2008;358:1370–1380. - PubMed
    1. van Berlo JH, Maillet M, Molkentin JD. Signaling effectors underlying pathologic growth and remodeling of the heart. J. Clin. Invest. 2013;123:37–45. - PMC - PubMed
    1. Kanisicak O, Khalil H, Ivey MJ, Karch J, Maliken BD, Correll RN, Brody MJ, Lin S-JL, Aronow BJ, Tallquist MD, Molkentin JD. Genetic lineage tracing defines myofibroblast origin and function in the injured heart. Nat. Commun. 2016;7:12260. - PMC - PubMed

Publication types

MeSH terms