. 2017 May 17;7(1):2036.
doi: 10.1038/s41598-017-02163-8.

Early Onset of Nucleate Boiling on Gas-covered Biphilic Surfaces

Affiliations

Early Onset of Nucleate Boiling on Gas-covered Biphilic Surfaces

Biao Shen et al. Sci Rep. .

Abstract

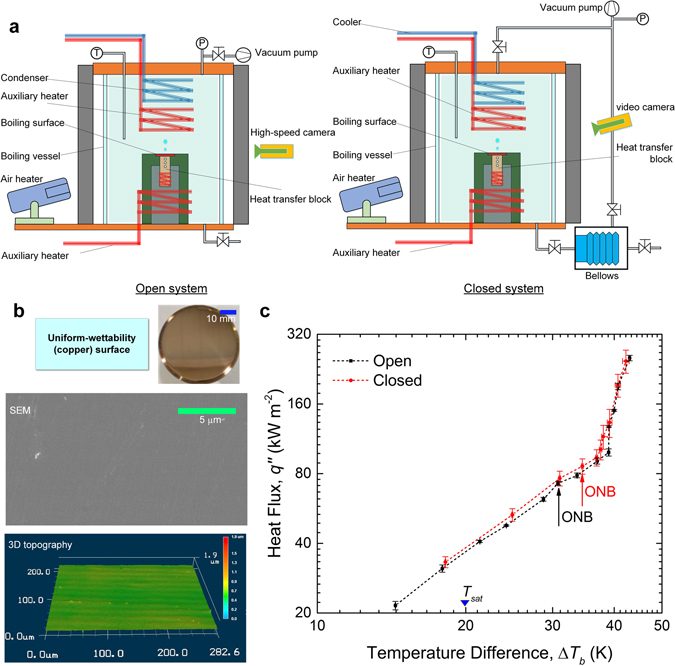
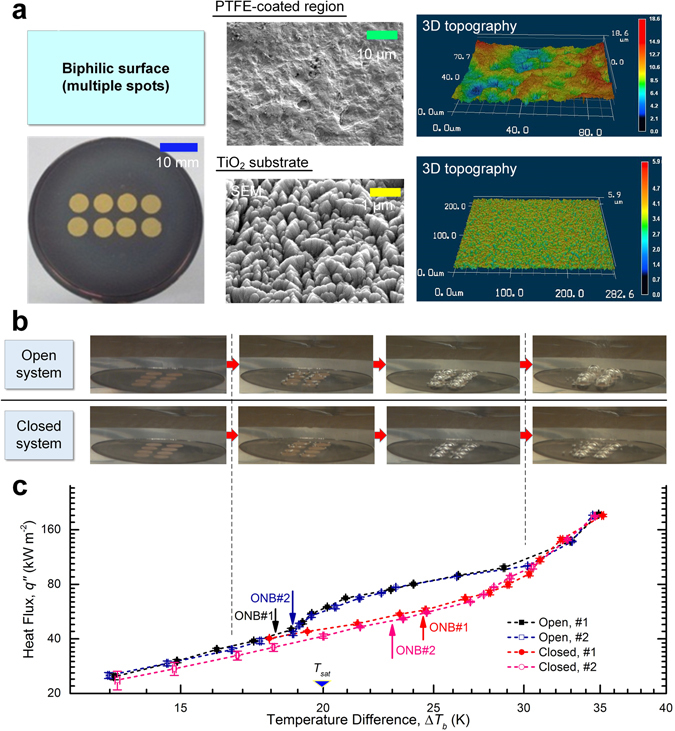
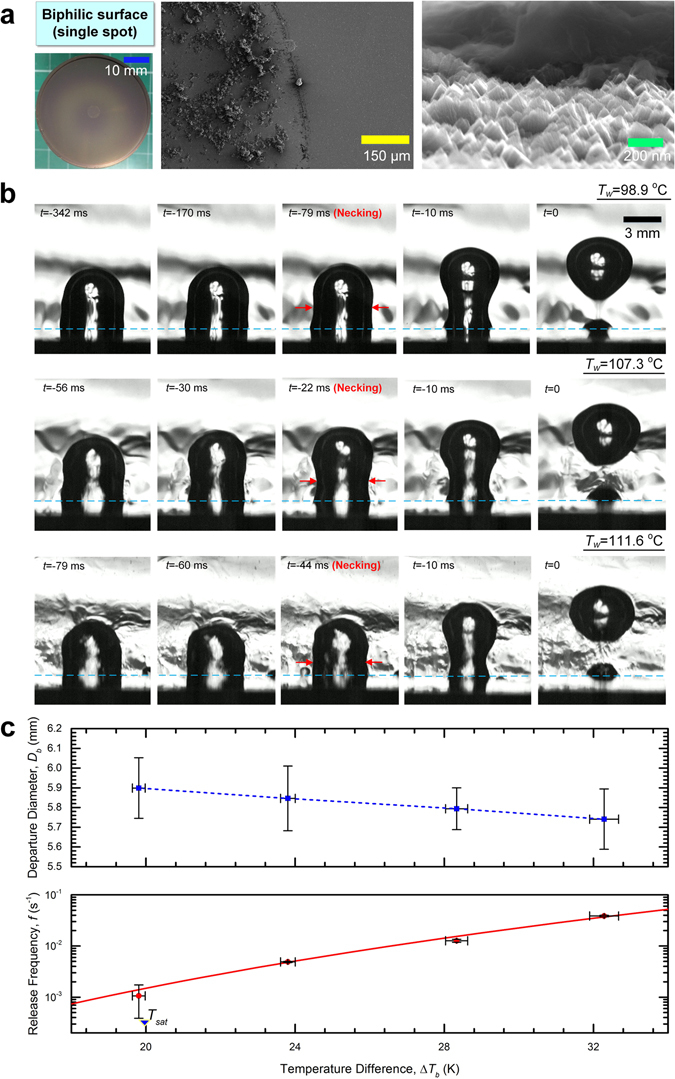
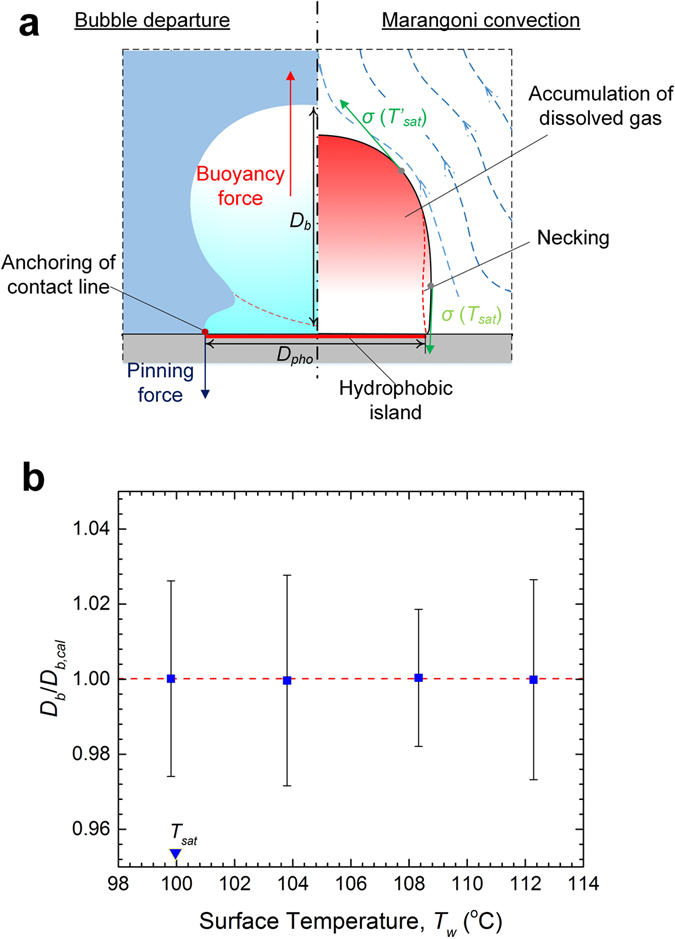
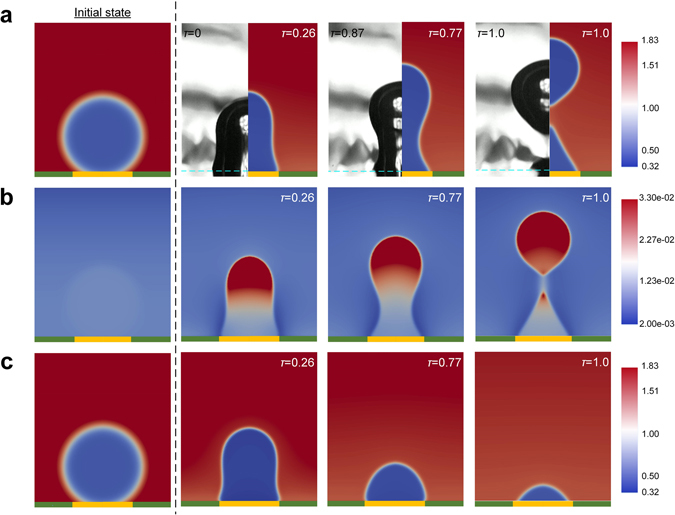
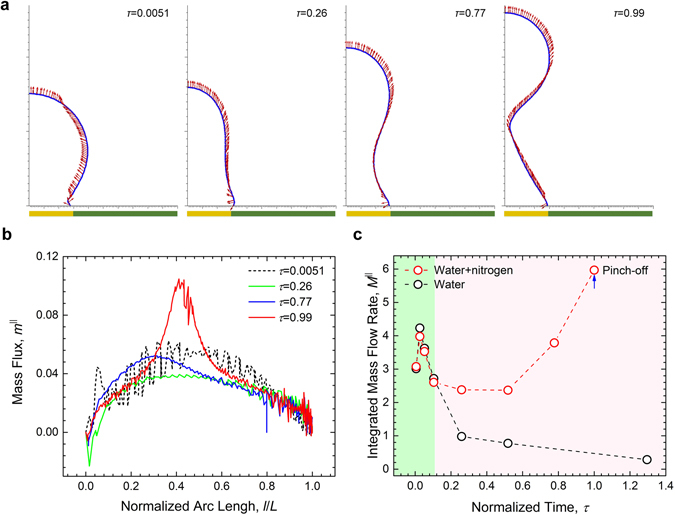
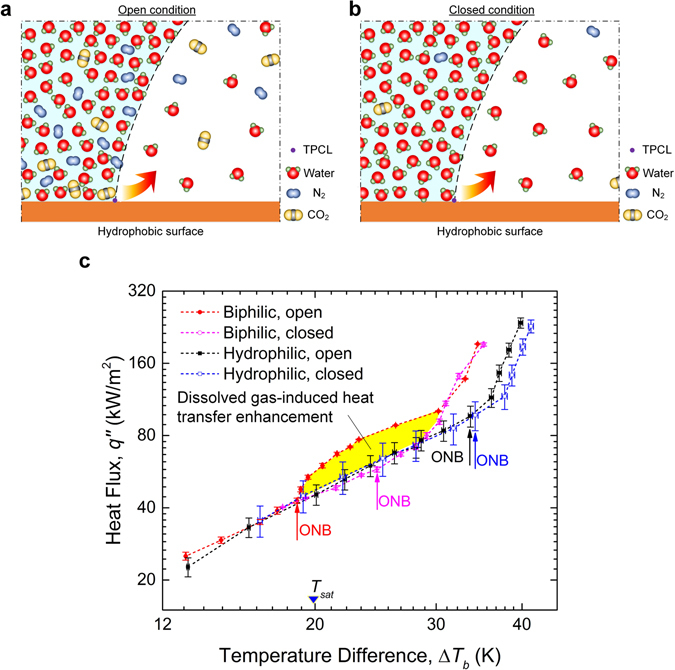
For phase-change cooling schemes for electronics, quick activation of nucleate boiling helps safeguard the electronics components from thermal shocks associated with undesired surface superheating at boiling incipience, which is of great importance to the long-term system stability and reliability. Previous experimental studies show that bubble nucleation can occur surprisingly early on mixed-wettability surfaces. In this paper, we report unambiguous evidence that such unusual bubble generation at extremely low temperatures-even below the boiling point-is induced by a significant presence of incondensable gas retained by the hydrophobic surface, which exhibits exceptional stability even surviving extensive boiling deaeration. By means of high-speed imaging, it is revealed that the consequently gassy boiling leads to unique bubble behaviour that stands in sharp contrast with that of pure vapour bubbles. Such findings agree qualitatively well with numerical simulations based on a diffuse-interface method. Moreover, the simulations further demonstrate strong thermocapillary flows accompanying growing bubbles with considerable gas contents, which is associated with heat transfer enhancement on the biphilic surface in the low-superheat region.


Conflict of interest statement

The authors declare that they have no competing interests.

Figures

Figure 1
Figure 1
Pool boiling experiments using open and closed setups. (a) Boiling experimental apparatuses of the open and closed systems. Instead of boiling deaeration, more thorough vacuum degasification was employed in the closed system. The content of dissolved air in subcooled water (T bulk = 80 °C) decreased from c g ≈ 5.53 ppm in the open vessel to c g < 0.7 ppm in the closed system that can be hermetically sealed off from the atmosphere, thanks to a pressure-stabilizing rubber bellows. Heat was incrementally applied to the heat transfer block to generate boiling on its upward-facing surface of 30 mm in diameter. The surface temperature and heat flux was calculated by a heat conduction model based on steady-state measurements of the three thermocouples embedded along the length of the heat transfer block. (b) A homogeneous boiling surface with uniform wettability. The plain copper surface with a contact angle ≈80°, polished to a mirror finish, was largely free of surface defects as shown by the scanning electron microscope (SEM) image. The surface morphology measurement by a 3D laser profilometer shows an average roughness of 0.03 µm. (c) Plot of the boiling curves obtained for the homogeneous surface. The boiling incipience superheat (ΔT sat = T w -T sat) rose slightly from ΔT sat = 12.8 K in the open system to ΔT sat = 15.2 K in the closed system. Error bars represent standard deviations of the least-square fittings. Despite the somewhat lower ONB in the open system, BHT varied little following the dissimilar degassing schemes in the present study.
Figure 2
Figure 2
Effect of dissolved gas on boiling heat transfer on a biphilic surface. (a) A heterogeneous surface with mixed wettability. The superhydrophilic TiO2 substrate (after 12 hours of UV irradiation, θ e ≈ 0°) was coated with an array of hydrophobic (θ e > 120°) PTFE circular spots of 6 mm in diameter and 7 mm in pitch. The SEM and 3D laser profilometer images reveal contrasting surface topographies between the TiO2 and PTFE subregions, which had an average roughness of 0.3 µm and 3 µm, respectively. (b) Evolution of the boiling characteristics. Following the initial quiescent stage of natural convection, small bubbles first appeared around the interface between the hydrophilic and hydrophobic subregions, which then coalesced and formed a single bubble completely encompassing each hydrophobic island. Although the expansion of the bubble base was limited to the edge of the hydrophobic coatings, the mostly stationary bubbles grew notably larger in the open system due to the presence of dissolved gas. At high superheats, more bubbles started to nucleate on the TiO2 surface as well, which quickly departed from the surface. (c) Plot of the boiling curves. The open and closed cases differed in the incipience of boiling: ΔT sat = 4.6 K (run #1) and 2.9 K (run #2) in the closed system, compared with ΔT sat = −1.6 K (run #1) and −1.4 K (run #2) in the open system. Error bars represent standard deviations of the least-square fittings. An increasing divide seems to emerge between the boiling curves before re-converging in the regime of fully-developed nucleate boiling, which is in large part attributable to particularly strong dissolved gas-induced thermocapillary convection under the open condition.
Figure 3
Figure 3
Bubble behaviour in the open system. (a) A heterogeneous surface with a single artificial nucleation site. On the superhydrophilic TiO2 surface (θ e ≈ 0°, post UV-irradiation) was deposited by drop-coating a hydrophobic island (θ e > 145°) with a diameter of 6 mm that was composed of APTES (3-aminopropyltriethoxysilane)-modified halloysite nanotubes and synthesized polymer P(FA-C8-co-DOPAm). The SEM images confirms dissimilar topography for the non-wetting surface, which was particularly favourable to bubble nucleation. An isolated bubble could preferentially form and grow without interference from neighbouring bubbles. (b) Series of high-speed photos showing the process of bubble pinch-off from the biphilic surface at various surface temperatures. The time sequence was set to 0 at the moment of bubble pinch-off. Regardless of the surface temperature, the bubble departure commenced with “necking”. Further stretching of the bubble stem ultimately led to rupture of the interface (with only part of the bubble detached from the surface). The light blue dash line represents the boiling surface. (c) Plot of the bubble departure diameter (taken as the equilibrium bubble size before necking), D b, and the release frequency, f, versus the excess surface temperature relative to the bulk temperature, ΔT b, based on the analysis of the high-speed imaging results. The bubble dynamics on the biphilic surface cannot be adequately explained by the existing correlations as the observed partial bubble departures involve essentially no waiting time. The red line represents a best fit to the data, fT b 6.70±0.35. Each data point in the figure is averaged over five consecutive bubble growth periods, with the error bars indicating the spread of the individual measurements.
Figure 4
Figure 4
Bubble departure mechanism. (a) Surrounded by subcooled liquid, the stationary bubble sitting on the hydrophobic surface assumes an elongated slug shape, as the three-phase contact line is pinned at the end of the non-wetting domain. The increasing buoyancy force results in continuous thinning and stretching of the neck section of the bubble, which leads ultimately to its rupture. Dissolved gas in the water is gasified during evaporation, and ends up being entrained into the bubble by the incoming vapour. The accumulation of gas results in a significant temperature difference between the gas-depleted bottom and gas-rich top of the bubble. The surface stress imbalance contributes to strong thermocapillary effect. (b) Plot of the experimentally measured bubble departure diameter, D b, versus the calculations by equation (4), D b,cal. The cofactor in the present empirical correlation, D b,cal = Λ(x g)Lc, depends on the mole fraction of gas within the bubble, Λ(x g) = (0.944 ± 7.398 × 10−4) + (0.0648 ± 2.590 × 10−3) × x g. Here Lc = [6D pho σ/g(ρ l − ρ v)]1/3 is the modified characteristic capillary length. Error bar: spread of individual measurements over five consecutive bubble growth periods.
Figure 5
Figure 5
Bubble behaviour in the closed system. (a) Evolution of bubble shape with increasing surface temperatures as captured by the high-speed camera. Despite the shrinking size and receding three-phase contact line, the bubble remained immobile on the hydrophobic surface. The light blue dash line represents the boiling surface. See Supplementary Videos M2 for the examples of the oscillatory behaviour of the interface. (b) Oscillations of the bubble cap explained by the dynamic equilibrium between evaporation and condensation. The growth of the bubble is vertically confined within a superheated liquid layer above the heat transfer surface. That is because any excess bubble expansion is limited by condensation by the subcooled bulk, and excess contraction by increased evaporation at the base of the bubble. (c) Plot of the distribution of the time-averaged (vertical) bubble size, h b, over various T w. The continuous shrinkage of the bubble was for the most part due to the thinning of the superheated liquid layer under increasing surface heat fluxes. For comparison, calculations of the bubble departure diameter by equation (4) in the limit of x g = 0 are included (red dash-dot line), which shows that without dissolved gas, the bubble never achieved the minimal size needed for the buoyancy force to overcome the hold of the bubble by the surface. The error bars represent the standard deviations of the transient measurements. For detailed transient data, refer to Supplementary Fig. S6.
Figure 6
Figure 6
Simulated bubble behaviours with and without the gas presence. (a) Bubble pinch-off in a dilute water-nitrogen mixture. The diffuse-interface simulation shows that the vertical bubble deformation leads to the formation of a thinning neck and eventual (partial) departure from the surface. The results compare qualitatively well with the experimental observation at T w = 98.9 °C in the open case (with the heater surface marked by the green dash lines). The colour scale indicates the total fluid density that is normalized by the critical density of water. Here the nondimensional time, τ, is scaled by the bubble departure time (counted from the start of the simulation until the actual instant of bubble pinch-off in the two-component case). For the experiment, on account of the fact that the bubbles largely remain on the surface, the instant τ = 0 is set at the moment of “necking” before final departure. Yellow strip: hydrophobic subregion (θ e = 120°); green strip: hydrophilic subregion (θ e = 10°). (b) Accumulation of incondensable gas within the bubble. The images show the spatial distributions of nitrogen at the same instants as in (a), whose normalized density is represented by the colour scale. Exceptionally high solute concentrations materialize in the upper part of the bubble as the bubble continues to grow on the hydrophobic surface. Consequently, the bubble pinch-off transpires with the ascent of the top of the bubble filled with incondensable nitrogen. Note that the images of the full bubble are produced by merging the axisymmetric simulation results with their mirror counterparts. In Supplementary Videos M3, we include movies depicting the evolutions of the total density and nitrogen density distributions during bubble departure, respectively. (c) Shrinkage of a pure vapour bubble. The results show that a continuously shrinking bubble, under the enhanced (contaminant-free) condensation, fails to depart from the surface. In Supplementary Videos M4, we show the bubble growth and eventual collapse in a single-component system.
Figure 7
Figure 7
Simulated interfacial flow in the water-nitrogen system. (a) Evolution of the local velocity distribution at the bubble interface. The results show that as the bubble grows, the velocity vectors below the neck increasingly align with the bubble surface, which is thought to be driven by the strong surface stress difference between the gas-rich top and vapour-only bottom. Note that the bubble interface is evaluated at the isodensity level of ρ = 0.8ρ l. Yellow strip: hydrophobic subregion (θ e = 120°); green strip: hydrophilic subregion (θ e = 10°). (b) Distributions of the mass flux tangent to the interface, m ||, over the bubble surface (i.e., the normalized arc length by the total length of the bubble outline) during various stages of bubble growth. Driven by the significant thermocapillary effect, consistently strong Marangoni flow (tangent to the surface) prevails in the lower section of the bubble, which gradually weakens approaching the bubble cap. At the moment of pinch-off, the mass flux rises sharply around the neck region. (c) Total tangential mass fluxes integrated over the bubble interface, M ||, versus nondimensional time, τ. Sustained by the ever-increasing surface stress gradient (due to the accumulation of nitrogen inside the bubble), M || strongly diverges nearing the eventual pinch-off. In contrast, in the single-component system, the mass flux along the bubble surface decreases rapidly over time.
Figure 8
Figure 8
Different mechanisms of bubble generation on a hydrophobic surface and their impact on heat transfer. (a) Bubble nucleation in the open system. A considerable amount of gas is believed to aggregate near the hydrophobic surface even when the bulk liquid is nearly depleted of incondensables following boiling deaeration. The liquid phase with such high concentrations of dissolved air tends to become metastable at significantly lower superheats, which allows a mixture of vapour and gas contents to be liberated through the three-phase contact line (TPCL) into the growing bubble. (b) Bubble nucleation in the closed system. Under reduced external pressures, the gas enrichment tends to form larger nanobubbles on the hydrophobic surface, the constant merging of which facilitates eventual removal. As a result of the less formidable presence of dissolved gas, vapour bubble nucleation follows the conventional route irrespective of the surface hydrophobicity. (c) Comparison of the boiling curves of the biphilic (PTFE/TiO2) surface under the open and closed conditions and that of the uniformly superhydrophilic (TiO2) surface under similar conditions. The boiling incipience occurred on the biphilic surface at ΔT sat = −1.6 K in the open system and ΔT sat = 2.9 K in the closed system, respectively; on the other hand, ONB on the hydrophilic surface was measured to be ΔT sat = 13.9 K in the open system and ΔT sat = 14.2 K in the closed system, respectively. It would appear that compared with the very different boiling curves of the biphilic surface, the results of the TiO2 surface varied little between the open and closed conditions, denoting little effect of dissolved gas. The significant gap between the boiling curves of the open and closed systems of the biphilic surface (shaded by yellow) represents the impact of the gas accumulation on heat transfer in the low-superheat region.

Similar articles

Cited by

References

    1. Gerardi C, Buongiorno J, Hu L-W, McKrell T. Study of bubble growth in water pool boiling through synchronized, infrared thermometry and high-speed video. Int. J. Heat and Mass Tran. 2010;53:4185–4192. doi: 10.1016/j.ijheatmasstransfer.2010.05.041. - DOI
    1. Dhillon NS, Buongiorno J, Varanasi KK. Critical heat flux maxima during boiling crisis on textured surfaces. Nat. Commun. 2015;6:1–12. doi: 10.1038/ncomms9247. - DOI - PMC - PubMed
    1. O’Hanley H, et al. Separate effects of surface roughness, wettability, and porosity on the boiling critical heat flux. App. Phy. Lett. 2013;103:024102. doi: 10.1063/1.4813450. - DOI
    1. Mudawar I. Assessment of high-heat-flux thermal management schemes. IEEE T. Compon. Pack. T. 2001;24:122–141. doi: 10.1109/6144.926375. - DOI
    1. Attinger D, et al. Surface engineering for phase change heat transfer: a review. MRS Energy & Sustainability. 2014;1:1–40. doi: 10.1557/mre.2014.9. - DOI

Publication types