

High-salt intake negatively regulates fat deposition in mouse
- PMID: 28515432
- PMCID: PMC5435674
- DOI: 10.1038/s41598-017-01560-3
High-salt intake negatively regulates fat deposition in mouse
Abstract
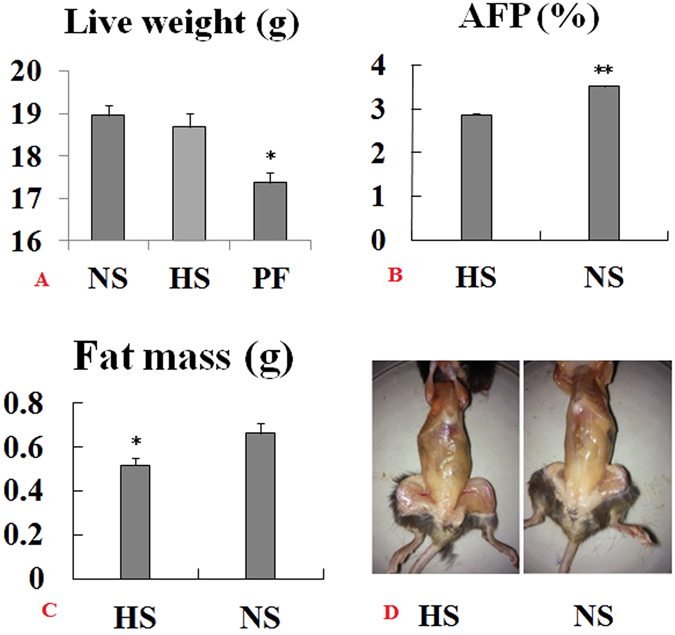
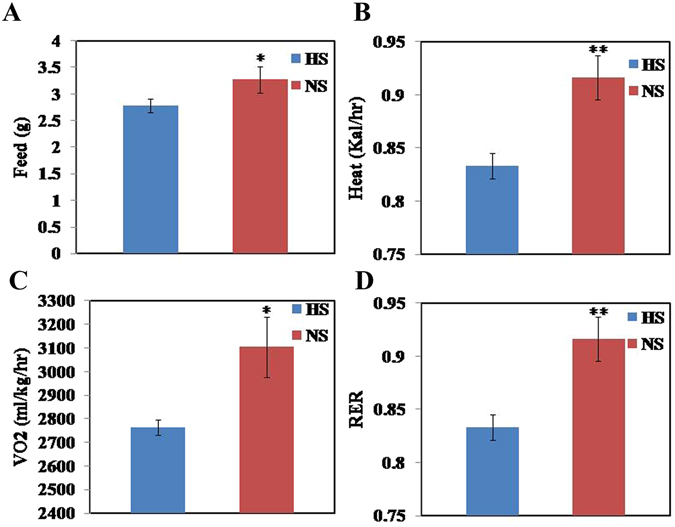
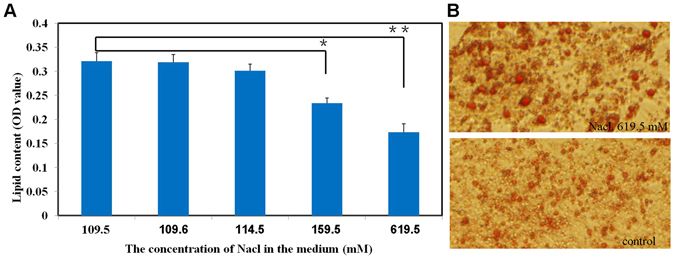
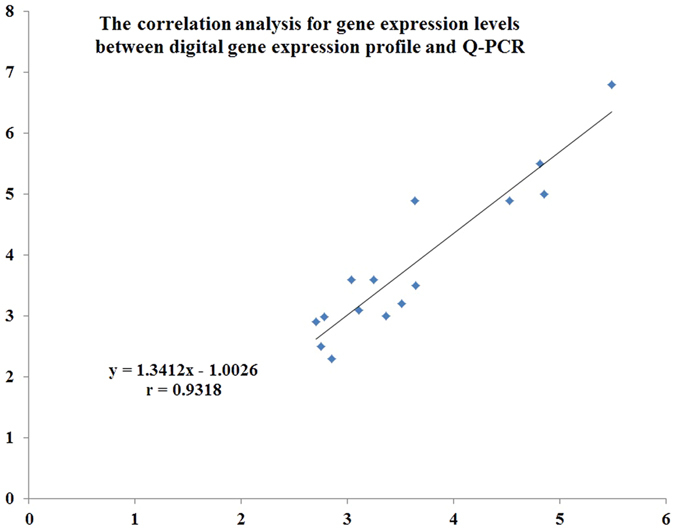
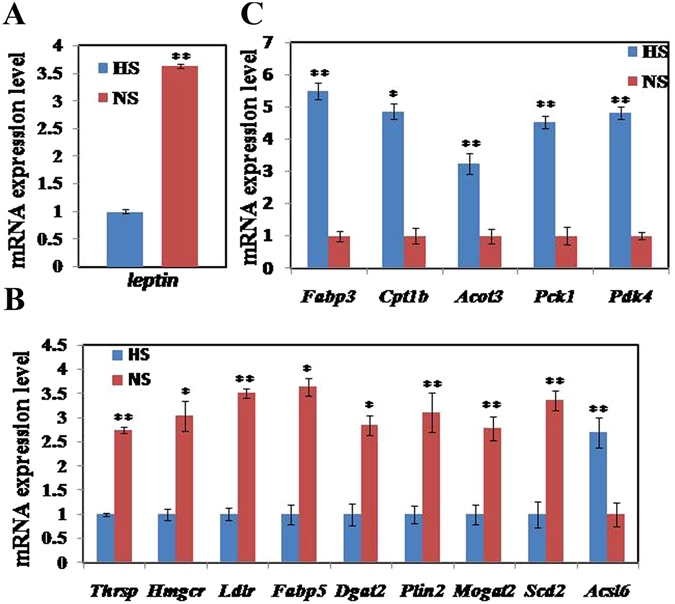
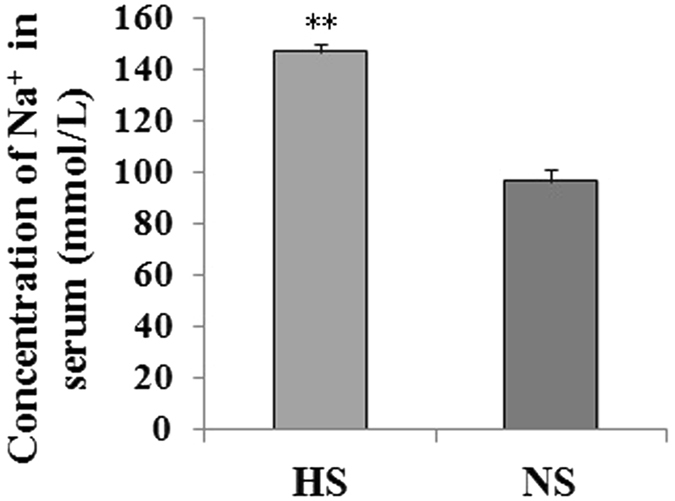
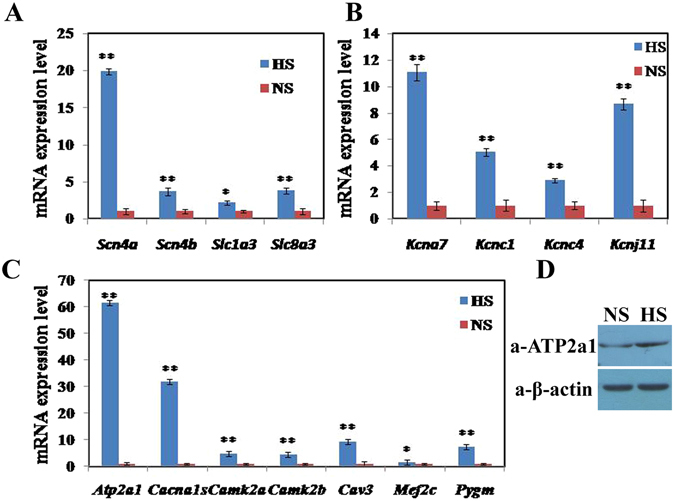
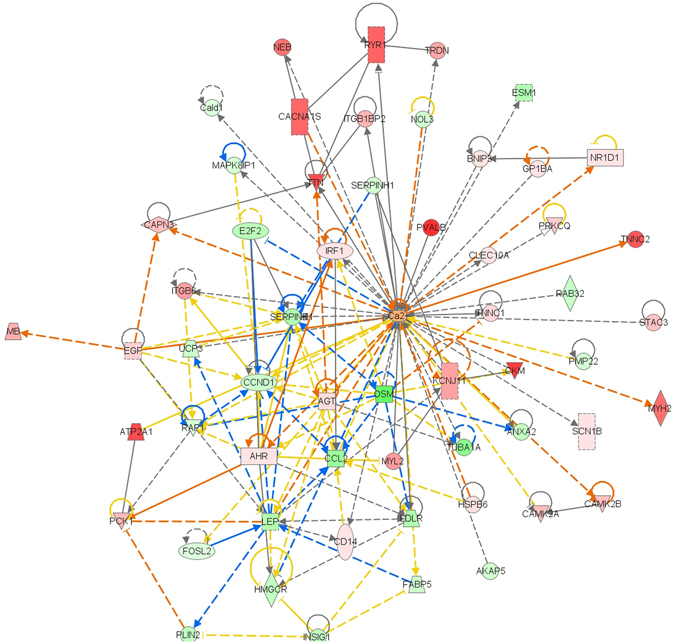
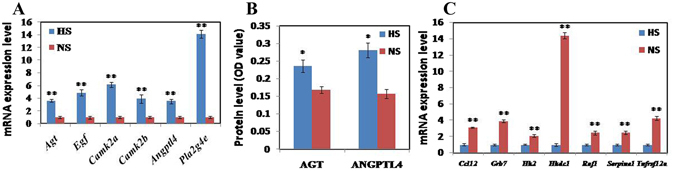
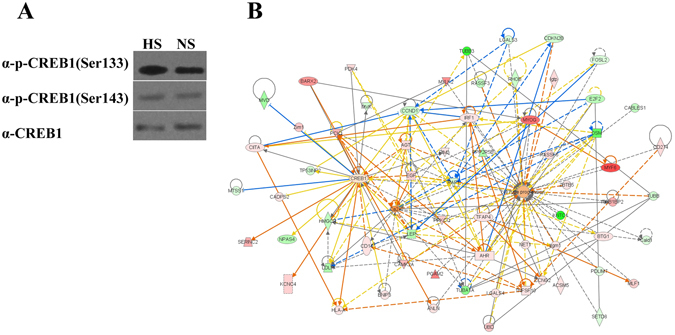
High-salt (HS) intake contributes to hypertension and cardiopathy, but the effect of HS on fat deposition is controversial. Feed intake, fat mass, the percentage of abdominal fat, heat production, rate of oxygen consumption and the respiratory exchange ratio of mice on a HS diet were significantly decreased (P < 0.01 or 0.05) compared with mice on a normal-salt (NS) diet. An in vitro experiment with differentiating pre-adipocytes showed reduced fat deposition in the presence of high concentrations of NaCl (>0.05 M). Abdominal fat mRNA profiles and protein measurements showed that 5 known genes involved in lipolysis were up-regulated significantly and 9 genes related to lipogenesis were down-regulated in HS mice. Abundant genes and some proteins (ATP2a1, AGT, and ANGPTL4) related to calcium ion metabolism or the renin-angiotensin system (RAS) were differentially expressed between HS and NS mice. Of special interest, CREB1 phosphorylation (S133 and S142), a key factor involved in calcium signaling and other pathways, was up-regulated in HS mice. By IPA analysis, a network mediated by calcium was established providing the molecular mechanisms underlying the negative effect of HS on fat deposition.
Conflict of interest statement
The authors declare that they have no competing interests.
Figures
Similar articles
-
High dietary protein decreases fat deposition induced by high-fat and high-sucrose diet in rats.Br J Nutr. 2015 Oct 28;114(8):1132-42. doi: 10.1017/S000711451500238X. Epub 2015 Aug 19. Br J Nutr. 2015. PMID: 26285832
-
[Up-regulation of intrarenal renin-angiotensin system contributes to renal damage in high-salt induced hypertension rats].Beijing Da Xue Xue Bao Yi Xue Ban. 2015 Feb 18;47(1):149-54. Beijing Da Xue Xue Bao Yi Xue Ban. 2015. PMID: 25686347 Chinese.
-
Up-regulation of intrarenal renin-agiotensin system contributes to renal damage in high-salt induced hypertension rats.Kidney Blood Press Res. 2014;39(6):526-35. doi: 10.1159/000368463. Epub 2014 Nov 29. Kidney Blood Press Res. 2014. PMID: 25531334
-
Low birth weight in response to salt restriction during pregnancy is not due to alterations in uterine-placental blood flow or the placental and peripheral renin-angiotensin system.Physiol Behav. 2008 Sep 3;95(1-2):145-51. doi: 10.1016/j.physbeh.2008.05.011. Epub 2008 May 21. Physiol Behav. 2008. PMID: 18572207
-
Effects of Renin-Angiotensin System Inhibitors on Renal Expression of Renalase in Sprague-Dawley Rats Fed With High Salt Diet.Kidney Blood Press Res. 2015;40(6):605-13. doi: 10.1159/000368536. Epub 2015 Nov 29. Kidney Blood Press Res. 2015. PMID: 26619289
Cited by
-
GWAS for Meat and Carcass Traits Using Imputed Sequence Level Genotypes in Pooled F2-Designs in Pigs.G3 (Bethesda). 2019 Sep 4;9(9):2823-2834. doi: 10.1534/g3.119.400452. G3 (Bethesda). 2019. PMID: 31296617 Free PMC article.
-
Alleviation of salt-induced exacerbation of cardiac, renal, and visceral fat pathology in rats with metabolic syndrome by surgical removal of subcutaneous fat.Nutr Diabetes. 2020 Aug 10;10(1):28. doi: 10.1038/s41387-020-00132-1. Nutr Diabetes. 2020. PMID: 32778644 Free PMC article.
-
The Effects of Gelatinized Wheat Starch and High Salt Diet on Gut Microbiota and Metabolic Disorder.Nutrients. 2020 Jan 22;12(2):301. doi: 10.3390/nu12020301. Nutrients. 2020. PMID: 31979147 Free PMC article.
-
Whole-Transcriptome Analysis Sheds Light on the Biological Contexts of Intramuscular Fat Deposition in Ningxiang Pigs.Genes (Basel). 2024 May 19;15(5):642. doi: 10.3390/genes15050642. Genes (Basel). 2024. PMID: 38790271 Free PMC article.
-
A novel model of cardiovascular-kidney-metabolic syndrome combining unilateral nephrectomy and high-salt-sugar-fat diet in mice.Lab Anim (NY). 2024 Nov;53(11):336-346. doi: 10.1038/s41684-024-01457-5. Epub 2024 Oct 22. Lab Anim (NY). 2024. PMID: 39438661 Free PMC article.
References
Publication types
MeSH terms
Substances
LinkOut - more resources
Full Text Sources
Other Literature Sources
Medical
Miscellaneous
