. 2017 May 17;7(1):2020.
doi: 10.1038/s41598-017-02104-5.

Ligand chain length drives activation of lipid G protein-coupled receptors

Affiliations

Ligand chain length drives activation of lipid G protein-coupled receptors

Anastassia Troupiotis-Tsaïlaki et al. Sci Rep. .

Abstract

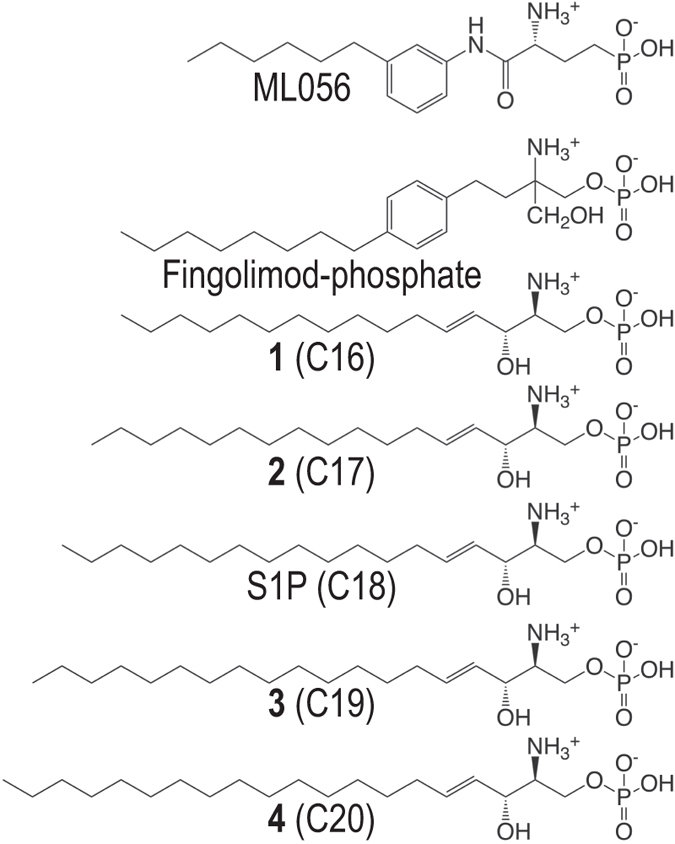
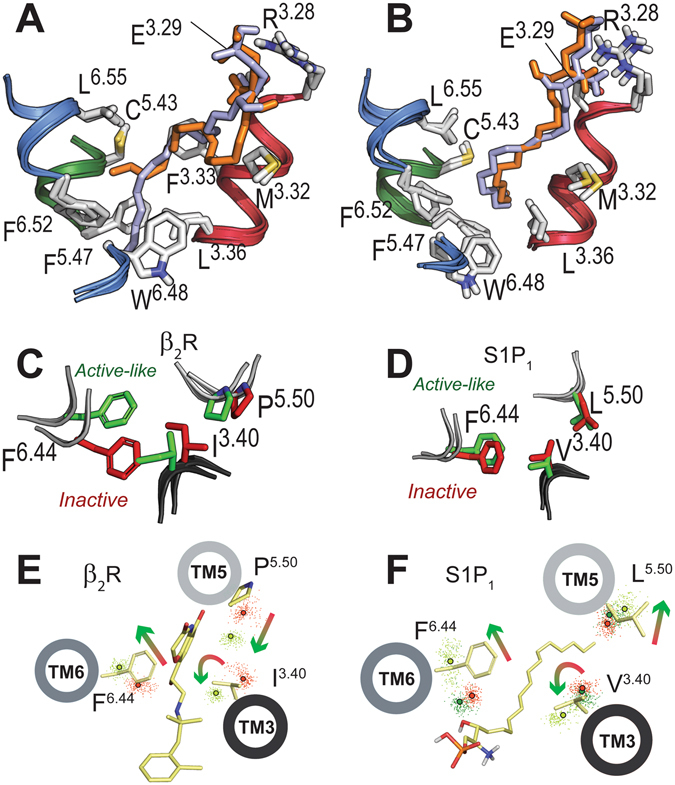
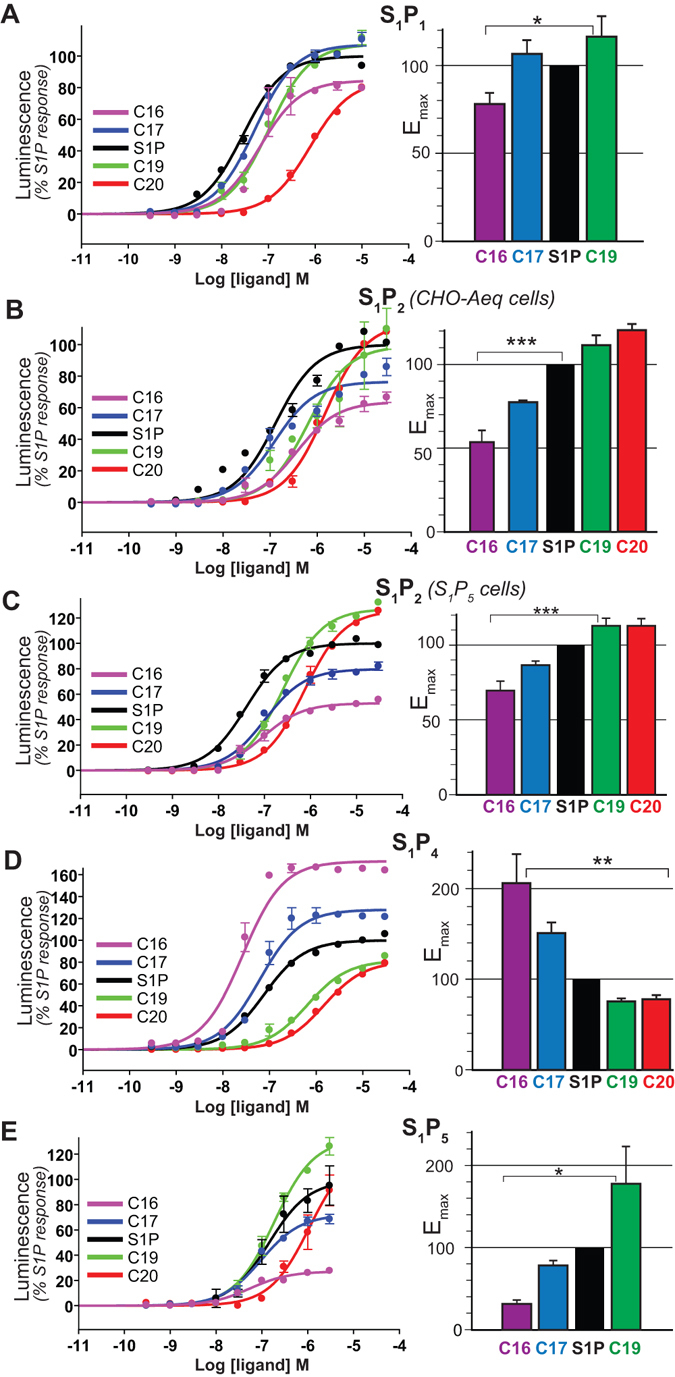
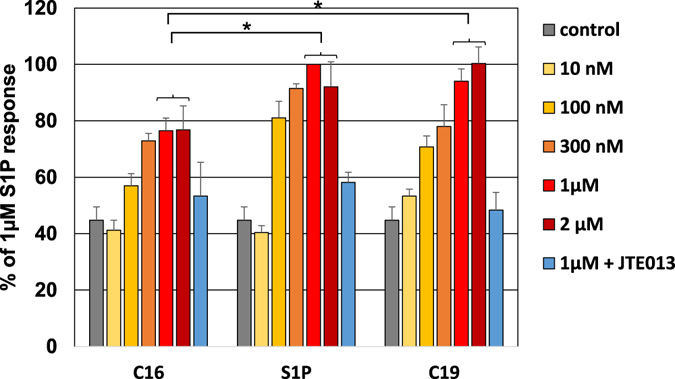
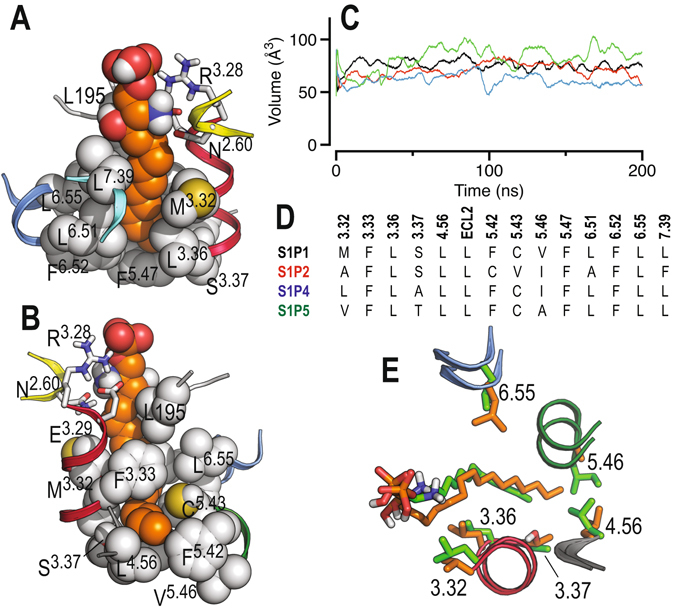
Sphingosine-1-phosphate (S1P) is a lipid mediator that can activate five cell membrane G protein-coupled receptors (GPCRs) which carry a variety of essential functions and are promising drug targets. S1P is composed of a polar zwitterionic head-group and a hydrophobic alkyl chain. This implies an activation mechanism of its cognate receptor that must be significantly different from what is known for prototypical GPCRs (ie receptor to small hydrophilic ligands). Here we aim to identify the structural features responsible for S1P agonism by combining molecular dynamics simulations and functional assays using S1P analogs of different alkyl chain lengths. We propose that high affinity binding involves polar interactions between the lipid head-group and receptor side chains while activation is due to hydrophobic interactions between the lipid tail and residues in a distinct binding site. We observe that ligand efficacy is directly related to alkyl chain length but also varies with receptor subtypes in correlation with the size of this binding pocket. Integrating experimental and computational data, we propose an activation mechanism for the S1P receptors involving agonist-induced conformational events that are conserved throughout class A GPCRs.


Conflict of interest statement

The authors declare that they have no competing interests.

Figures

Figure 1
Figure 1
Structure of ML056, Fingolimod-phosphate, S1P and synthetic derivatives 1–4 of variable chain length.
Figure 2
Figure 2
Mechanism of S1P-induced activation of S1P1. (A) Detailed view of the extracellular domain of the energy-minimized inactive-like and active-like models of S1P1. The initial binding pose of S1P used both in the inactive- and active-like MD simulation is shown in orange. A different conformation of the alkyl chain of S1P (in light blue) was also simulated for the active-like model of S1P1. (B) The final conformation, at 0.5 μs, obtained in the MD simulations of both starting conformations of S1P in complex with the active-like model of S1P1. (C,D) The starting positions of I1213.40, P2115.50 and F2826.44 (C) and V1323.40, L2135.50 and F2656.44 (D) (‘transmission switch’) used in the MD simulations of inactive- (in red) and active- (in green) conformations of the β2-adrenergic receptor (C) and S1P1 (D). Because the extracellular part of the active-like model of S1P1 is comparable to the inactive model (see Fig. 2A and Supplementary Fig. S2D), initial positions of these side chains, in the simulations, are similar and correspond to the inactive conformation. (E,F) Evolution of the Cβ atoms (dots) of I1213.40, P2115.50 and F2826.44 of β2- (E) and V1323.40, L2135.50 and F2656.44 of S1P1 (F) during the MD simulations (0.5 μs) of inactive- (in red) and active- (in light and dark green) like conformation of β2- in complex with the BI167107 agonist (light green, panel E) and S1P1 in complex with S1P (light green, panel F) and ligand-free (dark green, panel F). Centroids (calculated from 250 snapshots) of the Cβ atoms of these side chains are shown in red (inactive), dark green (ligand-free active conformation) and light green (agonist-bound active conformation) circles. Displayed helices, side chains, and agonists are shown for clarity. Arrows represent the observed movement of the helices during the MD simulations.
Figure 3
Figure 3
Functional response of S1P receptors to S1P synthetic analogs. Aequoscreen CHO-K1 cells expressing the different S1P receptors were subjected to stimulation with increasing concentrations of S1P-derived ligands and the resulting luminescence was measured. (A) S1P1, n = 4 (B) S1P2 from CHO-Aeq cells, n = 3 (C) S1P2 from S1P5 cells, n = 4 (D) S1P4, n = 4 (E) S1P5, n = 2. The corresponding dose-response curves for one representative experiment are shown, where each curve represents the mean ± S.E.M of duplicate data points. Luminescence intensities are normalized on maximal response to the natural agonist S1P. Histograms on the right show maximal efficacy (Emax) values calculated for each S1P analog at S1P receptors, based on the sigmoidal fitting of aequorin functional response. The data plotted represent the mean ± S.E.M and are expressed in % of maximal efficacy in response to stimulation by S1P. Statistical significance was assessed using one-way ANOVA with a Scheffe’s post hoc test: *p < 0.05, **p < 0.01, ***p < 0.001.
Figure 4
Figure 4
NF-κB activation via S1P2 in response to S1P analogs. Human BEAS-2B cells naturally expressing S1P2 receptor were subjected to stimulation with increasing concentrations (10 nM to 2 µM, from light yellow to dark red) of C16, S1P and C19 and resulting NF-κB activation was followed by luminescence (luciferase reporter). Untreated cells were used as a control (in grey) and 1 µM condition was also performed after pre-incubation with the selective S1P2 antagonist JTE013 (in blue). Histograms represent the mean values ± S.E.M. on 3 independent experiments for each condition, expressed as a percentage of 1 µM S1P response. Statistical significance between maximal activation levels (plateau at 1–2 µM) for different compounds was assessed using one-way ANOVA with a Scheffe’s post hoc test: *p < 0.05.
Figure 5
Figure 5
Molecular dynamics simulations of sphingosine-1-phosphate receptors. (A) Detailed view of the narrow channel of S1P1 where the alkyl tail of S1P (in orange) must expand. The end of the channel is delimited by the amino acids at positions 4.56, 5.42 and 5.46. The structure depicts the final conformation at 0.2 μs. (B) Same as in panel A but rotated 180°. (C) Volume of the channel in S1P1 (black), S1P2 (red), S1P4 (blue) and S1P5 (green) along the MD trajectories with the natural S1P agonist as calculated with POVME. (D) Sequence alignment, among sphingosine receptors, of the amino acids forming this channel. (E) The final conformation, at 0.2 μs, obtained in the MD simulations of S1P4 in complex with C16 (in green) and S1P5 in complex with C20 (in orange).

References

    1. Bockaert J, Pin JP. Molecular tinkering of G protein-coupled receptors: an evolutionary success. EMBO J. 1999;18:1723–1729. doi: 10.1093/emboj/18.7.1723. - DOI - PMC - PubMed
    1. Fredriksson R, Schiöth HB. The repertoire of G-protein-coupled receptors in fully sequenced genomes. Mol. Pharmacol. 2005;67:1414–1425. doi: 10.1124/mol.104.009001. - DOI - PubMed
    1. Gonzalez A, Cordomí A, Caltabiano G, Pardo L. Impact of Helix Irregularities on Sequence Alignment and Homology Modeling of G Protein-Coupled Receptors. ChemBioChem. 2012;13:1393–1399. doi: 10.1002/cbic.201200189. - DOI - PubMed
    1. Wu H, et al. Structure of a class C GPCR metabotropic glutamate receptor 1 bound to an allosteric modulator. Science. 2014;344:58–64. doi: 10.1126/science.1249489. - DOI - PMC - PubMed
    1. Im D-S. Discovery of new G protein-coupled receptors for lipid mediators. J. Lipid Res. 2004;45:410–418. doi: 10.1194/jlr.R300006-JLR200. - DOI - PubMed

Publication types

MeSH terms

LinkOut - more resources