. 2017 May 3:8:389.
doi: 10.3389/fimmu.2017.00389. eCollection 2017.

Different Somatic Hypermutation Levels among Antibody Subclasses Disclosed by a New Next-Generation Sequencing-Based Antibody Repertoire Analysis

Affiliations

Different Somatic Hypermutation Levels among Antibody Subclasses Disclosed by a New Next-Generation Sequencing-Based Antibody Repertoire Analysis

Kazutaka Kitaura et al. Front Immunol. .

Abstract

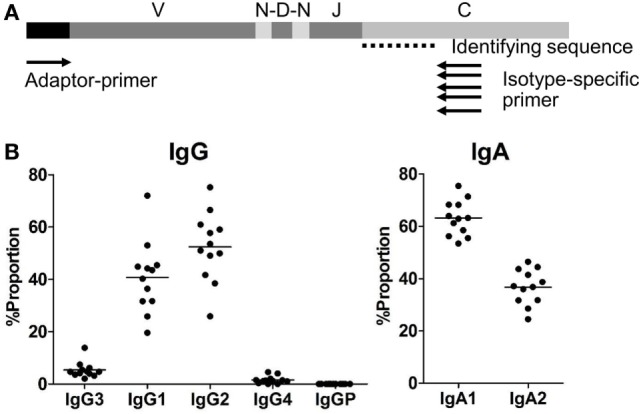
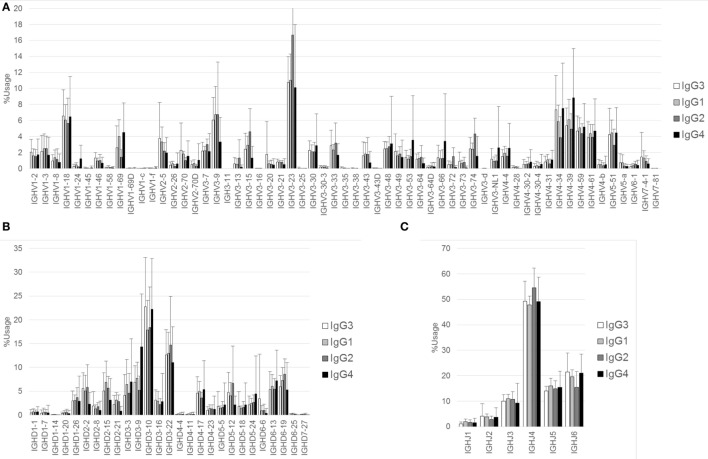
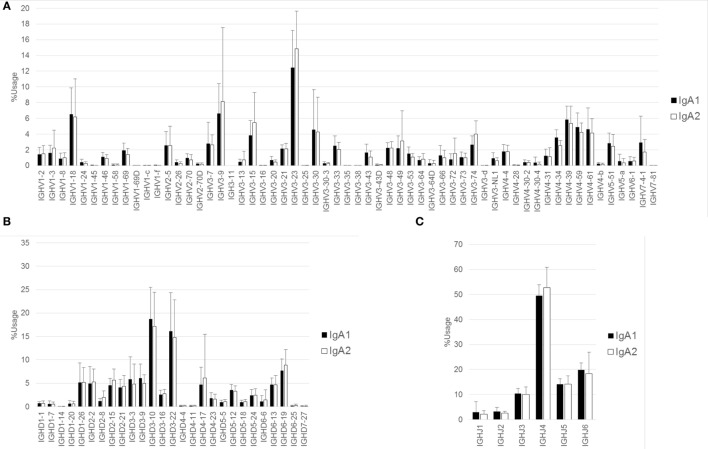
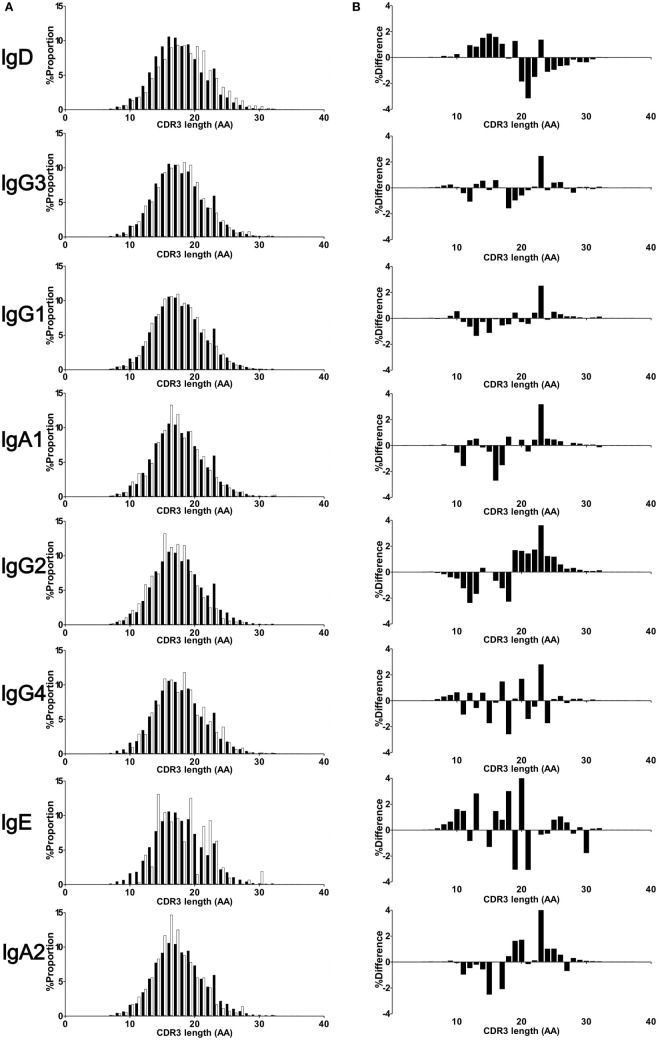
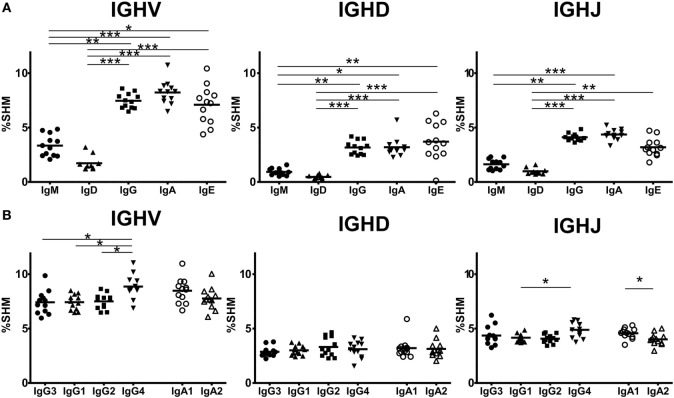
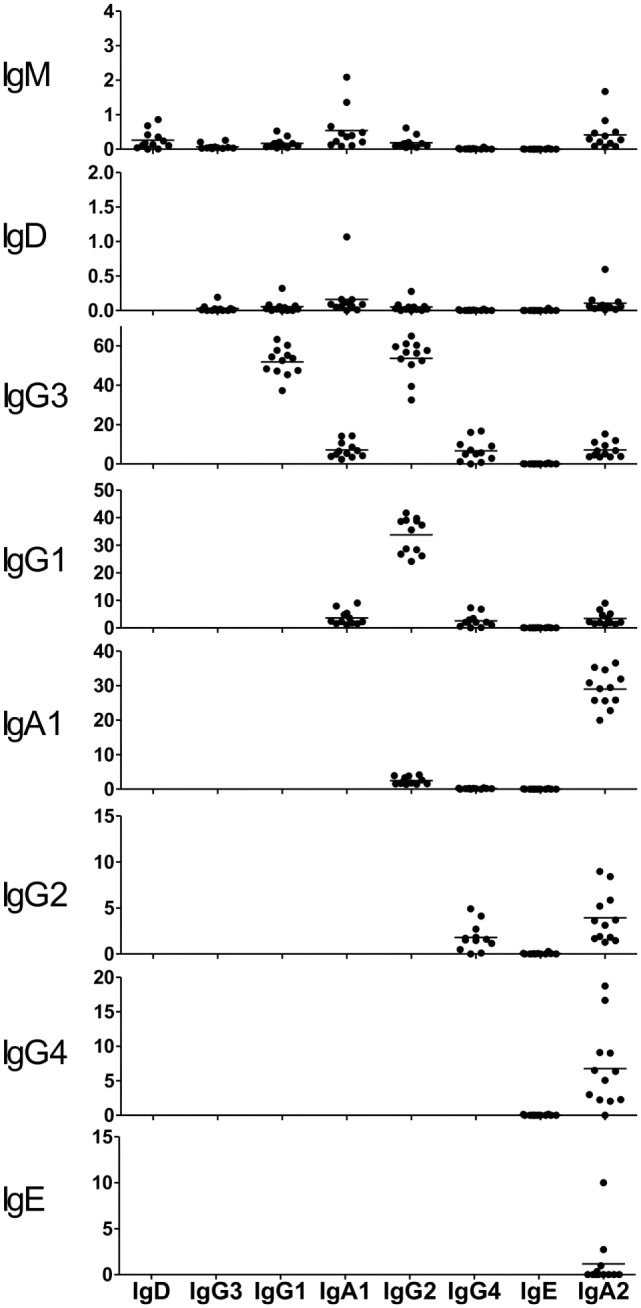
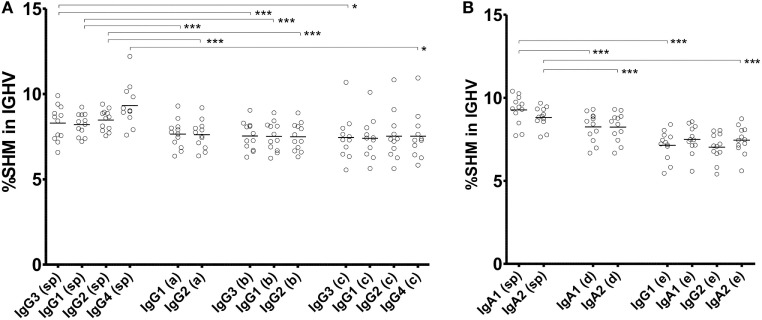
A diverse antibody repertoire is primarily generated by the rearrangement of V, D, and J genes and subsequent somatic hypermutation (SHM). Class-switch recombination (CSR) produces various isotypes and subclasses with different functional properties. Although antibody isotypes and subclasses are considered to be produced by both direct and sequential CSR, it is still not fully understood how SHMs accumulate during the process in which antibody subclasses are generated. Here, we developed a new next-generation sequencing (NGS)-based antibody repertoire analysis capable of identifying all antibody isotype and subclass genes and used it to examine the peripheral blood mononuclear cells of 12 healthy individuals. Using a total of 5,480,040 sequences, we compared percentage frequency of variable (V), junctional (J) sequence, and a combination of V and J, diversity, length, and amino acid compositions of CDR3, SHM, and shared clones in the IgM, IgD, IgG3, IgG1, IgG2, IgG4, IgA1, IgE, and IgA2 genes. The usage and diversity were similar among the immunoglobulin (Ig) subclasses. Clonally related sequences sharing identical V, D, J, and CDR3 amino acid sequences were frequently found within multiple Ig subclasses, especially between IgG1 and IgG2 or IgA1 and IgA2. SHM occurred most frequently in IgG4, while IgG3 genes were the least mutated among all IgG subclasses. The shared clones had almost the same SHM levels among Ig subclasses, while subclass-specific clones had different levels of SHM dependent on the genomic location. Given the sequential CSR, these results suggest that CSR occurs sequentially over multiple subclasses in the order corresponding to the genomic location of IGHCs, but CSR is likely to occur more quickly than SHMs accumulate within Ig genes under physiological conditions. NGS-based antibody repertoire analysis should provide critical information on how various antibodies are generated in the immune system.

Keywords: antibody; class switch recombination; repertoire; sequencing; somatic hypermutation.


Figures

Figure 1
Figure 1
(A) Adaptor-ligation PCR for next-generation sequencing-based antibody repertoire analysis. A universal primer specific for the isotype constant region (isotype-specific primer) and an adaptor primer were used for unbiased amplification of antibody genes. IgM-, IgD-, IgG-, IgA-, and IgE-specific primers were used for amplification of respective isotype genes. Amplified gene products were sequenced using an Illumina MiSeq sequencer, and each sequence read was classified into immunoglobulin subclasses by discrimination using the identifying sequence of the constant region. (B) Proportions of IgG and IgA subclasses in healthy individuals. Proportions of sequence reads of IgG subclasses (IgG3, IgG1, IgG2, IgG4, and IgGP) and IgA subclasses (IgA1 and IgA2) are indicated. Total sequence reads excluding unproductive reads (out-of-frame reads) were used for calculation. Each dot represents an individual and bars indicate mean frequencies (n = 12).
Figure 2
Figure 2
Comparison of usage of IGHV, IGHD, and IGHJ among IgG subclasses. Mean percentage usages of IGHV (A), IGHD (B), and IGHJ (C) in IgG3, IgG1, IgG2, and IgG4 are shown. Bars and error bars indicate mean percentage usage and its SD of 12 healthy individuals, respectively. Overall, there were several small differences in the usages of IGHV, IGHD, and IGHJ among IgG subclasses. For IGHV, significant differences were found in IgG3 vs. IgG2 (IGHV3–23, P < 0.01; IGHV4–34, P < 0.001), IgG3 vs. IgG4 (IGHV3–9, P < 0.01; IGHV4–39, P < 0.001), IgG1 vs. IgG2 (IGHV1–69, P < 0.05; IGHV3–23, P < 0.001), IgG1 vs. IgG4 (IGHV3–9, P < 0.001; IGHV3–53, P < 0.05; IGHV4–39, P < 0.01), and IgG2 vs. IgG4 (IGHV1–69, P < 0.001; IGHV3–9, P < 0.001; IGHV3–15, P < 0.001; IGHV3–23, P < 0.001; IGHV3–74, P < 0.01; IGHV4–34, P < 0.001; IGHV4–39, P < 0.001). For IGHD, significant differences were found in IgG3 vs. IgG1 (IGHD3–10, P < 0.05), IgG3 vs. IgG4 (IGHD3–9, P < 0.001), IgG1 vs. IgG4 (IGHD3–9, P < 0.001), and IgG2 vs. IgG4 (IGHD3–9, P < 0.001; IGHD5–12, P < 0.05). For IGHJ, significant differences were found in IgG3 vs. IgG2 (IGHJ4, P < 0.05; IGHJ6, P < 0.05), IgG1 vs. IgG2 (IGHJ4, P < 0.01), and IgG2 vs. IgG4 (IGHJ4, P < 0.05; IGHJ6, P < 0.05).
Figure 3
Figure 3
Comparison of usage of IGHV, IGHD, and IGHJ among IgA subclasses. Mean percentage usages of IGHV (A), IGHD (B), and IGHJ (C) were compared between IgA1 and IgA2. Bars and error bars indicate mean percentage usage and SD of 12 healthy individuals, respectively. There were significant differences in IGHV3–35 (P < 0.001), IGHV3–74 (P < 0.05), and IGHV4–34 (P < 0.01).
Figure 4
Figure 4
CDR3 length of isotypes and subclasses. Deduced amino acid sequence of CDR3 region of IgM, IgD, IgG3, IgG1, IgA1, IgG2, IgG4, IgE, and IgA2 were collected from 12 individuals. The CDR3 length was calculated based on amino acid sequence from conserved Cys104 to Trp118 or Phe118. Percentage frequencies of each CDR3 length were plotted by a bar plot (A). Closed bar indicates percentage frequencies in CDR3 length of IgM (control), while open bar indicates respective immunoglobulin subclasses. To compare difference in the CDR3 length between immature and mature B cells, difference in the percentage frequencies between IgM and either IgD, IgG, IgA, and IgE or IgM were plotted at each position (B). Negative values in the left half and positive values in right half indicate a shortening of CDR3 length in respective Igs compared with IgM.
Figure 5
Figure 5
Somatic hypermutation (SHM) levels in immunoglobulin isotypes and subclasses. Frequencies of SHM in isotypes (A) and IgG and IgA subclasses (B) are shown. Frequencies of SHM in variable region (IGHV), diversity region (IGHD), and joining region (IGHJ) were calculated by comparison of sequence reads with the reference sequence. Sequence data from in-frame IgM (1,338,009 reads), IgD (1,279,881), IgG3 (60,000), IgG1 (503,101), IgG2 (667,076), IgG4 (19,708), IgA1 (866,180), IgA2 (519,390), and IgE (87,474 reads) were used to calculate SHM. For IGHV and IGHD, the SHM levels of IgG, IgA, and IgE were significantly higher than those of IgM and IgD. Similarly, for IGHJ, the SHM levels of IgG and IgA were significantly higher than those of IgM and IgD and the SM levels of IgE were significantly higher than those of IgD. Regarding IgG and IgA subclasses, IgG4 had significantly higher SHM levels in IGHV regions than IgG3, IgG1, and IgG2 (P < 0.05). The SHM levels of IgG4 were significantly higher than those of IgG1. On the other hand, there were no significant differences in the SHM levels in both IGHV and IGHD between IgA1 and IgA2, but the SHM levels of IgA2 was significantly lower than those of IgA1. Significance: *P < 0.05, **P < 0.01, and ***P < 0.001.
Figure 6
Figure 6
Clone sharing among immunoglobulin (Ig) isotypes and subclasses. The proportions of clones shared between two subclasses are shown. Each dot represents an individual. Sequence reads sharing identical V, D, and J segments and identical amino acid sequences of CDR3 were considered as being from identical clonal lineages. The proportions were calculated by dividing the number of shared clones by the total number of ancestral Ig (upstream). Each Ig isotype and subclass is shown in the order corresponding to the genomic location of IGHC regions (22).
Figure 7
Figure 7
Somatic hypermutation (SHM) levels of subclass-specific and shared clones in IgG (A) and IgA (B) subclasses. The frequencies of SHM within the immunoglobulin (Ig) variable region (IGHV) in subclass-specific clones and clones shared among multiple subclasses are shown. Sequence reads found in only an Ig subclass were considered as subclass-specific clones (sp). SHM levels in sequence reads shared between IgG1 and IgG2 (double, a); among IgG3, IgG1 and IgG2 (triple, b); among IgG3, IgG1, IgG2, and IgG4 (quadruple, c); between IgA1 and IgA2 (double, d); and among IgG1, IgA1, IgG2, and IgA2 (quadruple, e) were compared. Statistical significance was tested by Wilcoxon rank-sum test (*P < 0.05, **P < 0.01, and ***P < 0.001).

References

    1. Vidarsson G, Dekkers G, Rispens T. IgG subclasses and allotypes: from structure to effector functions. Front Immunol (2014) 5:520.10.3389/fimmu.2014.00520 - DOI - PMC - PubMed
    1. Lutzker S, Rothman P, Pollock R, Coffman R, Alt FW. Mitogen- and IL-4-regulated expression of germ-line Ig gamma 2b transcripts: evidence for directed heavy chain class switching. Cell (1988) 53(2):177–84.10.1016/0092-8674(88)90379-0 - DOI - PubMed
    1. Briere F, Servet-Delprat C, Bridon JM, Saint-Remy JM, Banchereau J. Human interleukin 10 induces naive surface immunoglobulin D+ (sIgD+) B cells to secrete IgG1 and IgG3. J Exp Med (1994) 179(2):757–62.10.1084/jem.179.2.757 - DOI - PMC - PubMed
    1. Malisan F, Briere F, Bridon JM, Harindranath N, Mills FC, Max EE, et al. Interleukin-10 induces immunoglobulin G isotype switch recombination in human CD40-activated naive B lymphocytes. J Exp Med (1996) 183(3):937–47.10.1084/jem.183.3.937 - DOI - PMC - PubMed
    1. Lebman DA, Coffman RL. Interleukin 4 causes isotype switching to IgE in T cell-stimulated clonal B cell cultures. J Exp Med (1988) 168(3):853–62.10.1084/jem.168.3.853 - DOI - PMC - PubMed