. 2017 May 3:8:667.
doi: 10.3389/fpls.2017.00667. eCollection 2017.

Osmotic Stress Induced Cell Death in Wheat Is Alleviated by Tauroursodeoxycholic Acid and Involves Endoplasmic Reticulum Stress-Related Gene Expression

Affiliations

Osmotic Stress Induced Cell Death in Wheat Is Alleviated by Tauroursodeoxycholic Acid and Involves Endoplasmic Reticulum Stress-Related Gene Expression

Liting Zhang et al. Front Plant Sci. .

Abstract

Although, tauroursodeoxycholic acid (TUDCA) has been widely studied in mammalian cells because of its role in inhibiting apoptosis, its effects on plants remain almost unknown, especially in the case of crops such as wheat. In this study, we conducted a series of experiments to explore the effects and mechanisms of action of TUDCA on wheat growth and cell death induced by osmotic stress. Our results show that TUDCA: (1) ameliorates the impact of osmotic stress on wheat height, fresh weight, and water content; (2) alleviates the decrease in chlorophyll content as well as membrane damage caused by osmotic stress; (3) decreases the accumulation of reactive oxygen species (ROS) by increasing the activity of antioxidant enzymes under osmotic stress; and (4) to some extent alleviates osmotic stress-induced cell death probably by regulating endoplasmic reticulum (ER) stress-related gene expression, for example expression of the basic leucine zipper genes bZIP60B and bZIP60D, the binding proteins BiP1 and BiP2, the protein disulfide isomerase PDIL8-1, and the glucose-regulated protein GRP94. We also propose a model that illustrates how TUDCA alleviates osmotic stress-related wheat cell death, which provides an important theoretical basis for improving plant stress adaptation and elucidates the mechanisms of ER stress-related plant osmotic stress resistance.

Keywords: ER stress; ROS; TUDCA; cell death; osmotic stress.


Figures

Figure 1
Figure 1
Morphological changes in wheat seedlings under different treatments. (A) Seedling features of control, PEG, and PEG + TUDCA (100 μg/mL) treatment groups after 4 days; (B,C) Seedling fresh weight and biomass accumulation of the three treatment groups after PEG treatment for 4 days; (D) Individual seedling features of different treatment groups after 4 days; (E,F) Average seedling height and root length of different treatment groups after 4 days. Data are shown as mean ± SD (n = 4) of three independent experiments. Different letters (a, b, or c) indicate significant difference between the groups (P < 0.05).
Figure 2
Figure 2
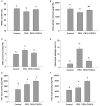
Physiological changes in wheat leaves under different treatments. (A,B) Leaf water content and chlorophyll content of control, PEG, and PEG + TUDCA (100 μg/mL) groups after 4 days of treatments; (C,D) MDA content and electrolyte leakage (%) in leaves after 8 days of treatments; (E,F) CAT and POD activities in leaves after 4 days of treatments. Data are shown as mean ± SD (n = 4). Different letters (a or b) indicate significant difference between the groups (P < 0.05).
Figure 3
Figure 3
ROS accumulation in wheat leaves under different treatments. (A,B) O2·- accumulation in wheat leaves under control, PEG, and PEG + TUDCA groups after 5 days of treatment. Measurements were conducted via NBT staining, and photographed using a camera and ×40 magnification. A higher number of blue spots reflects a higher accumulation of O2·- (C,D) H2O2 accumulation in wheat leaves under control, PEG, and PEG + TUDCA groups after 5 days of treatment. Levels were detected by DAB staining and photographed using a camera and ×40 magnification. A deeper brown spot color shows a higher accumulation of H2O2; (E,F) Comparison of O2·- production rate and H2O2 content in leaves of different groups after 5 days of treatment. Data are shown as mean ± SD (n = 3). Different letters (a, b, or c) indicate significant difference between the groups (P < 0.05).
Figure 4
Figure 4
ROS accumulation in wheat roots under different treatments. (A,B) O2·- accumulation in wheat roots under control, PEG, and PEG + TUDCA groups after 5 days of treatment. Levels were indicated via NBT staining and photographed using a microscope (A, × 40 magnification; B, × 100 magnification). A deeper blue color indicates a higher accumulation of O2·-; (C) H2O2 accumulation in wheat roots under control, PEG, and PEG + TUDCA groups after 5 days of treatment. Levels were indicated via DAB staining and photographed using a microscope (C, × 100 magnification). A deeper brown color indicates a higher accumulation of H2O2; (D,E) O2·- production rate and H2O2 content in wheat roots under different groups after 5 days of treatment. Data are shown as mean ± SD (n = 3). Different letters (a, b, or c) indicate significant difference between the groups (P < 0.05).
Figure 5
Figure 5
Status of cell death in wheat roots under different treatments. (A,B,D) Dead cells in wheat roots under control, PEG, and PEG + TUDCA groups after 5 days of treatment. Root tissues were stained with trypan blue solution and photographed with a camera (A), and microscope (B, ×40 magnification; D, ×100 magnification); (C) Comparison of cell death ratio in roots under three different treatments. Data are shown as mean ± SD (n = 3). Different letters (a, b, or c) indicate significant difference between the groups (P < 0.05).
Figure 6
Figure 6
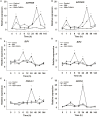
Relative expression of ER stress–related genes in wheat leaves under different treatments. (A,B) Relative expression of TabZIP60B and TabZIP60D, two typical early response wheat genes; (C,D) Relative expression of BiP1 and BiP2, two typical interim response wheat genes; (E,F) Relative expression of PDIL8-1 and GRP94, two typical late response wheat genes. Data are shown as mean ± SD (n = 3) of three independent experiments. Significant difference between the groups (P < 0.05) is indicated by an *.
Figure 7
Figure 7
Proposed ER stress–related pathway that leads to PCD in plants. Under osmotic stress, orderly protein folding in the ER lumen is disturbed and results in ER stress. In one scenario, this stress activates the C-terminal Ca2+ channel in TaBI61 and TaBI85 (homologous proteins to AtBI-1) and leads to calcium efflux from the ER to the mitochondria, which in turn leads to Cyt C increase, ROS accumulation, and cell death. This process is referred to here as the ER stress–ROS–PCD pathway. In an alternative scenario, ER stress is sensed by the receptors TabZIPB and TabZIPD (homologous proteins to AtbZIP17), which transport ER stress signals to the nucleus and regulate UPR-related genes including TaBiP1, TaBiP2, TaPDIL8-1, and TaGRP94. This process is referred to here as the ER stress–UPR–PCD pathway. Treatment with TUDCA could prevent, or alleviate, the occurrence of wheat cell death induced by osmotic stress via either of these two ER stress–related pathways.

References

    1. Aebi H. (1984). Catalase in vitro. Meth. Enzymol. 105, 121–126. - PubMed
    1. Brennan T., Frenkel C. (1977). Involvement of hydrogen peroxide in the regulation of senescence in pear. Plant Physiology. 59, 411–416. - PMC - PubMed
    1. Cai Y. M., Yu J., Gallois P. (2014). Endoplasmic reticulum stress-induced PCD and caspase-like activities involved. Front. Plant Sci. 5:41. 10.3389/fpls.2014.00041 - DOI - PMC - PubMed
    1. Cao S. S., Kaufman R. J. (2014). Endoplasmic reticulum stress and oxidative stress in cell fate decision and human disease. Antioxid. Redox Signal. 21, 396–413. 10.1089/ars.2014.5851 - DOI - PMC - PubMed
    1. Carvalho H. H., Silva P. A., Mendes G. C., Brustolini O. J. B., Pimenta M. R., Gouveia B. C., et al. . (2014). The endoplasmic reticulum binding protein BiP displays dual function in modulating cell death events. Plant Physiol. 164, 654–670. 10.1104/pp.113.231928 - DOI - PMC - PubMed

LinkOut - more resources