. 2017 May 18:8:15079.
doi: 10.1038/ncomms15079.

Lhx1/5 control dendritogenesis and spine morphogenesis of Purkinje cells via regulation of Espin

Affiliations

Lhx1/5 control dendritogenesis and spine morphogenesis of Purkinje cells via regulation of Espin

Nga Chu Lui et al. Nat Commun. .

Abstract

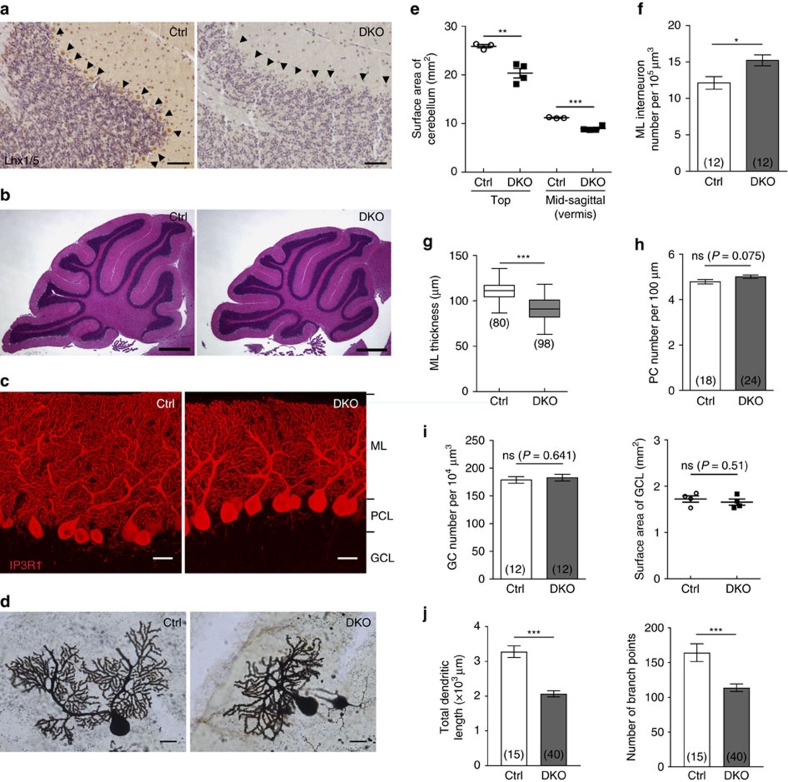
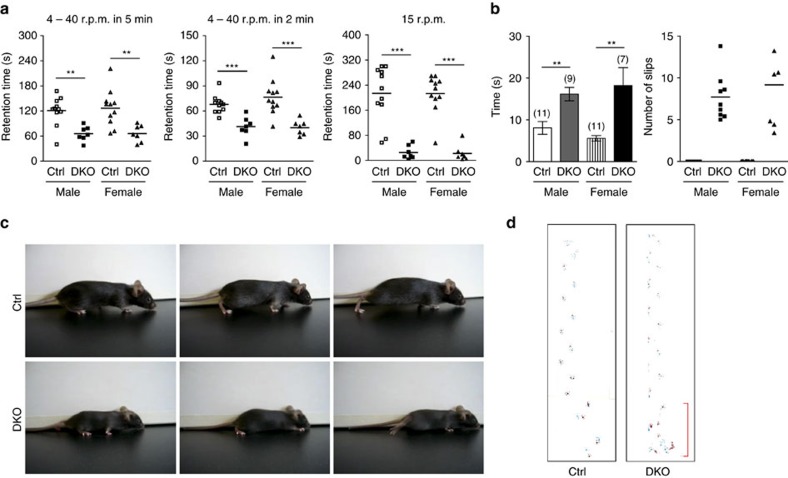
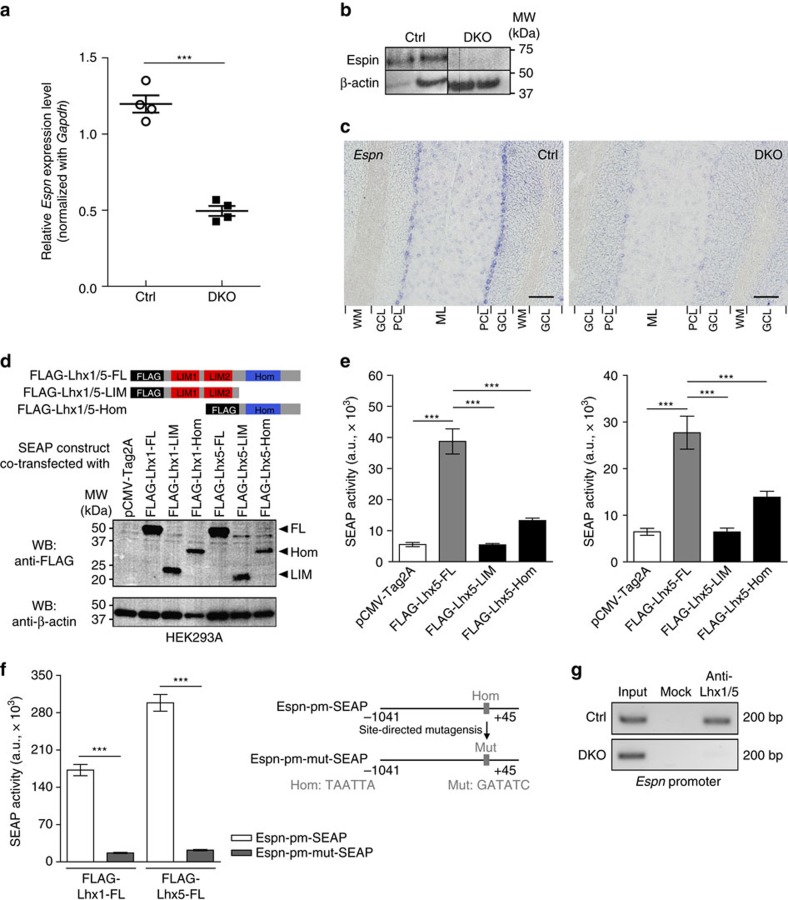
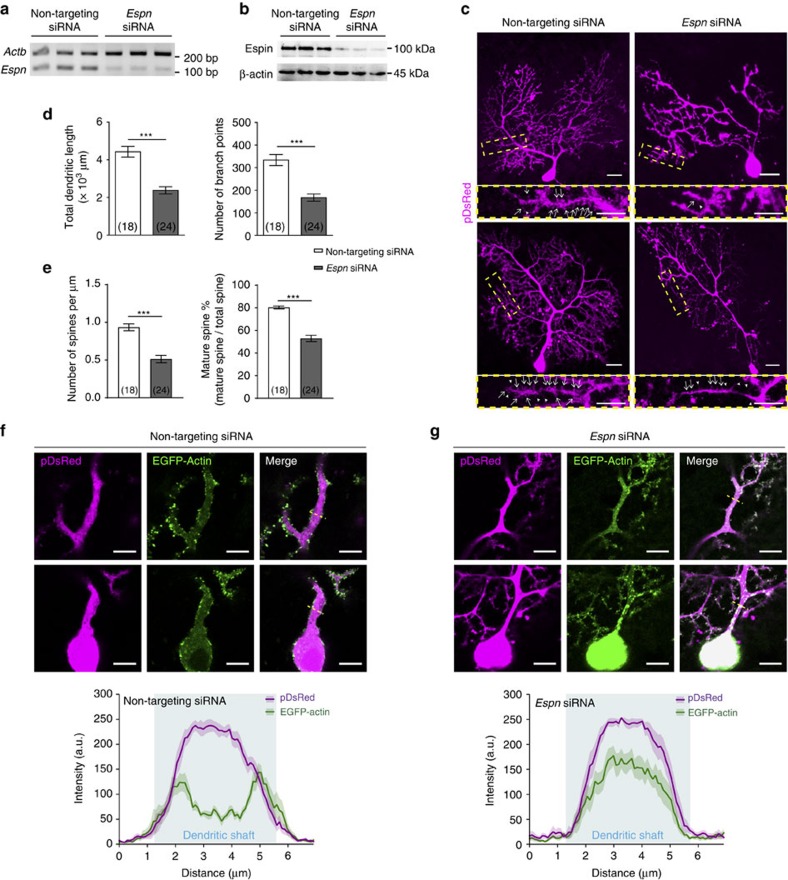
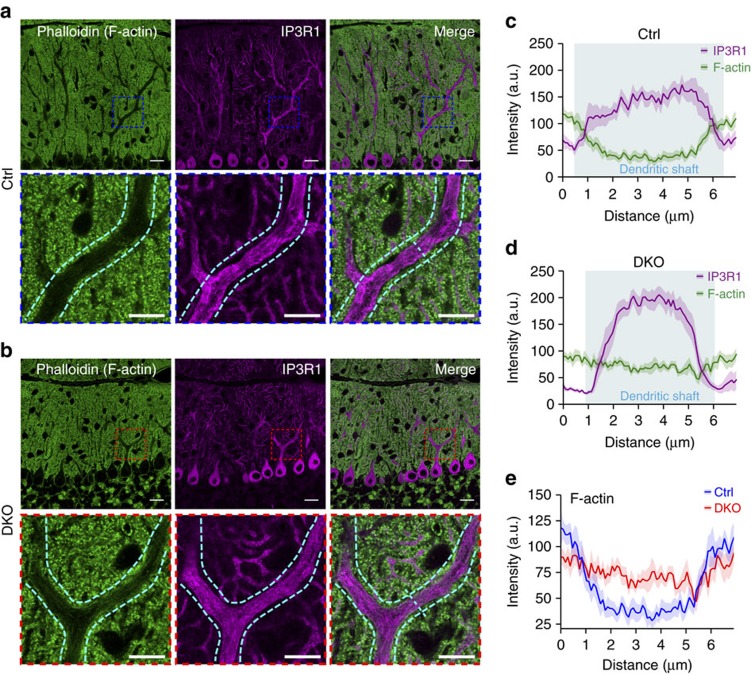
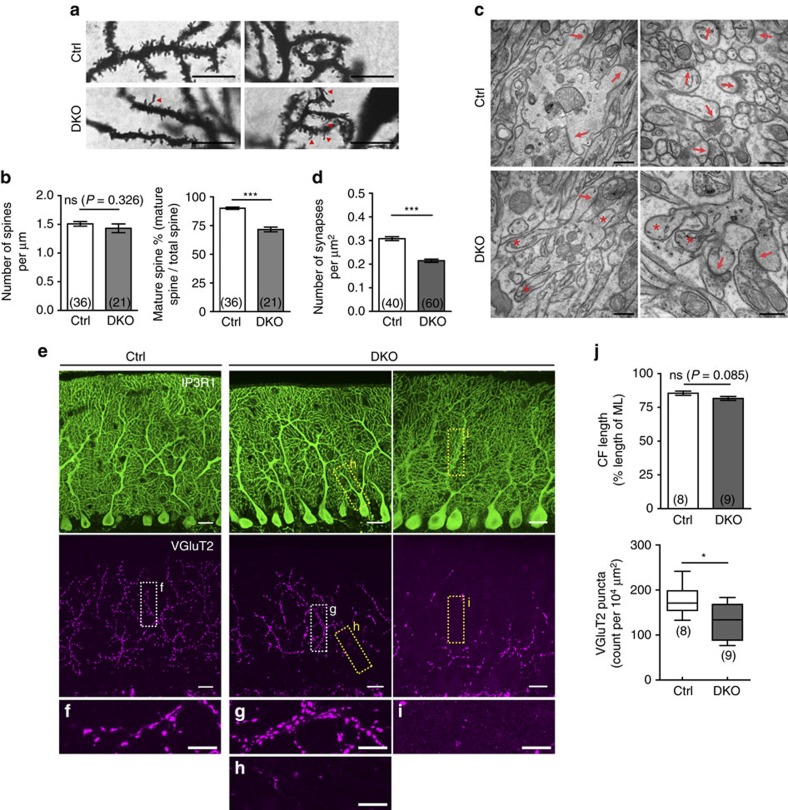
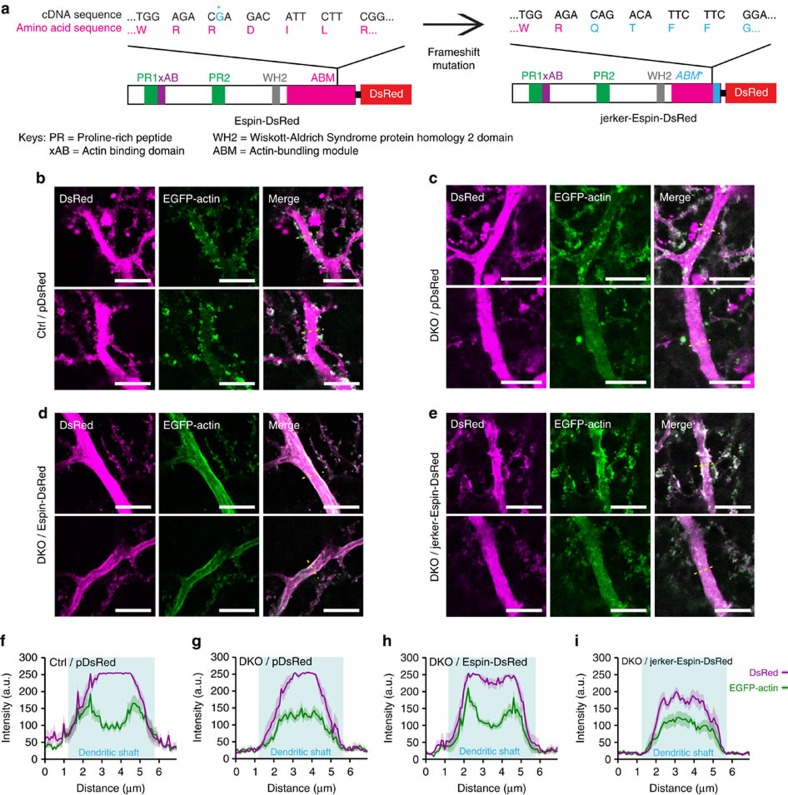
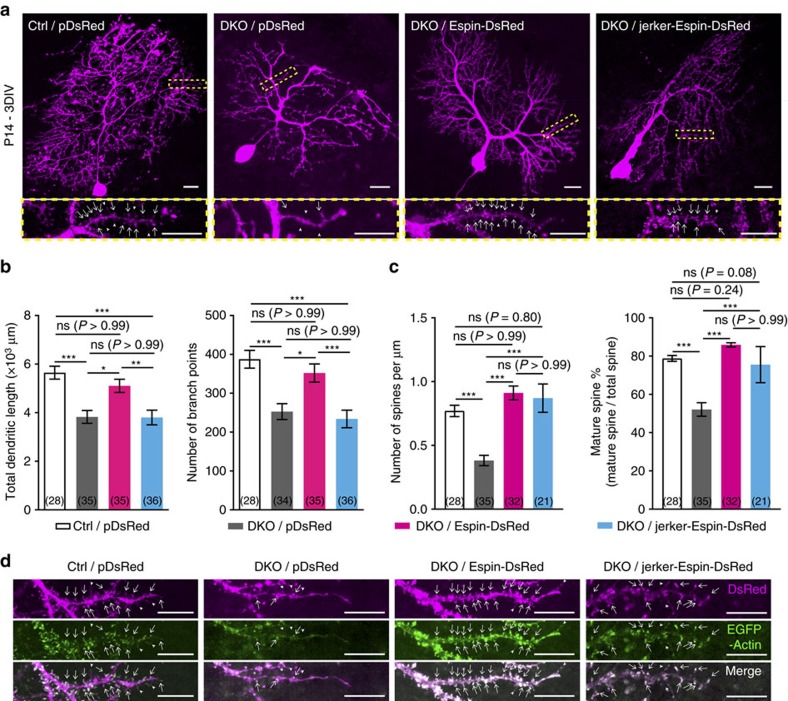
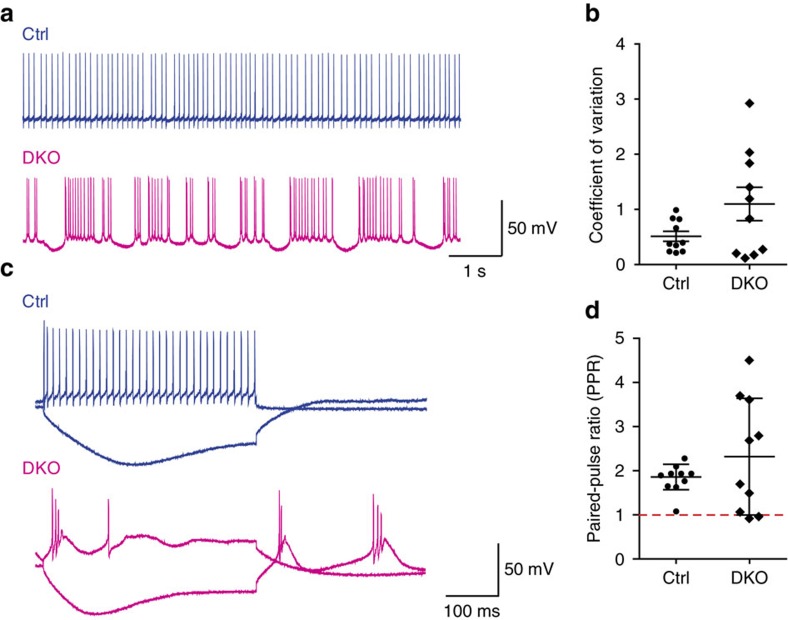
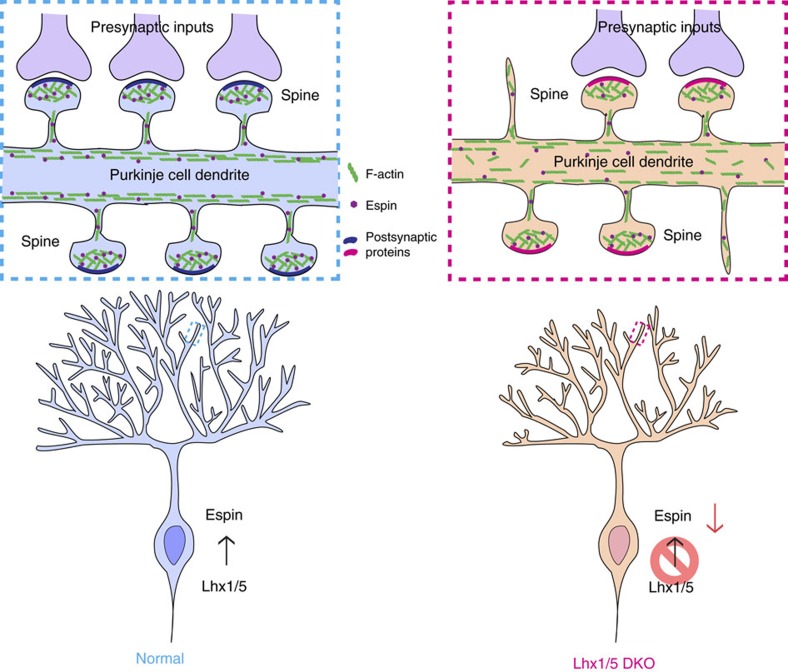
In the cerebellar cortex, Purkinje cells (PCs) receive signals from different inputs through their extensively branched dendrites and serve as an integration centre. Defects in the dendritic development of PCs thus disrupt cerebellar circuitry and cause ataxia. Here we report that specific inactivation of both Lhx1 and Lhx5 in postnatal PCs results in ataxic mutant mice with abnormal dendritic development. The PCs in the mutants have reduced expression of Espin, an F-actin cytoskeleton regulator. We show that Espin expression is transcriptionally activated by Lhx1/5. Downregulation of Espin leads to F-actin mislocalization, thereby impairing dendritogenesis and dendritic spine maturation in the PCs. The mutant PCs therefore fail to form proper synapses and show aberrant electrophysiological properties. By overexpressing Espin, we can successfully rescue the defects in the mutant PCs. Our findings suggest that Lhx1/5, through regulating Espin expression, control dendritogenesis and spine morphogenesis in postnatal PCs.


Conflict of interest statement

The authors declare no competing financial interests.

Figures

Figure 1
Figure 1. Normal cytoarchitecture of cerebellum but reduced length of PC dendrites in Lhx1/5 DKO mutants.
(a) Immunostaining of Lhx1/5 in the PCs (arrowheads) of the control (Ctrl) (left) and the DKO mutant (right). Scale bars, 50 μm. (b) Haematoxylin and eosin (H&E) staining showing the cytoarchitecture and foliation of the cerebellum of the control (left) and the DKO mutant (right). Scale bars, 500 μm. (c) Immunostaining of IP3R1 showing the PCs of the control (left) and the DKO mutant (right). ML, molecular layer; PCL, Purkinje cell layer; GCL, granule cell layer. Scale bars, 20 μm. All immunostaining or staining experiments were replicated at least three times with at least three mice per genotype. (d) Golgi-impregnated PCs of the control (Ctrl) (left) and the DKO mutant (right). Scale bars, 20 μm. (e) Scatter plot showing the size of cerebellum decreased in the DKO mutants (measured by the surface area of cerebellum at different views as shown in Supplementary Fig. 2b). (f) Bar graph showing that the density of interneurons in ML increased in the DKO mutants. (g) Box plot showing that the DKO mutant cerebella had reduced molecular layer thickness in lobule IV–V. Boxes indicate the mean (middle line) and 25 to 75% range, while whiskers indicate maximum and minimum values. (h) Bar graph showing the density of PCs was comparable between the mutants and the controls. (i) Bar graph (left) showing the density of GCs and scatter plot (right) showing the surface area of GCL (measured by the GCL area in H&E staining shown in (b)) was comparable between the mutants and the controls. (j) Bar graphs showing the total dendritic length (left) and the branching number (right) of the Golgi-impregnated PCs. Values in the brackets indicate the number of sections analysed. For all scatter plots, the bars indicate the mean values and each point represents a mouse cerebellum. For each measurement, at least three mice were analysed per group; t-test; ns, not significant; *P<0.05, **P<0.01 and ***P<0.001.
Figure 2
Figure 2. Lhx1/5 DKO mutants display motor deficits.
(a) Scatter plots showing differences in retention time before falling from an accelerating rotarod from 4 to 40 r.p.m. in 5 min (left) or 2 min (middle) and stationary rotarod at 15 r.p.m. (right) between the controls (n=22 mice) and the DKO mutants (n=14 mice). Bars in the scatter plots represent the mean values. (b) Graphs showing differences in time to complete running on an elevated balance beam (left) and number of missteps (right) between the controls and the DKO mutants. Brackets show the number of the control and the DKO mutant mice tested; t-test; **P<0.01 and ***P<0.001. (c) Representative photos showing the walking behaviour of a control (upper panels) and a DKO mutant (lower panels). At least three mice per group were tested for their walking behaviour. (d) Example of paw prints acquired during footprint analysis. The DKO mutant footprint showed some tottering steps (red bracket) during initiation of locomotion. In all, 21 control mice and 17 mutant mice were analysed.
Figure 3
Figure 3. Lhx1/5 transcriptionally regulate Espn.
(a) Real-time quantitative PCR showing the relative Espn expression level in the adult DKO mutant cerebellum when compared with the control cerebellum; n=4 mice per group; t-test; ***P<0.001. (b) Western blots showing the cerebella of the DKO mutants had lower Espin level than the controls. The experiment was repeated twice, seven mice for each genotype. (c) In situ hybridization for Espn transcripts showing the PCs of the DKO mutants (right) had a lower Espn expression than the controls (left). The experiment was repeated three times with three mice per genotype. ML, molecular layer; PCL, Purkinje cell layer; GCL, granule cell layer; WM, white matter. Scale bars, 100 μm. (d) Schematic illustrations showing different forms of FLAG-tagged Lhx1/5 proteins. Western blots showing the coexpression of Lhx1/5 proteins with SEAP. FL, full-length; LIM, LIM domains; Hom, homeodomain. (e) Bar graphs showing the differences in SEAP activity under the control of the Espn promoter (Espn-pm-SEAP) when different forms of Lhx1 (left) and Lhx5 (right) proteins were coexpressed. Analysis of variance (ANOVA); ***P<0.001. (f) Schematic illustrations showing the SEAP plasmid containing an Espn promoter with mutation (Mut) in the binding site of Lhx1/5 homeodomain (Hom). Bar graphs reveal the differences in the SEAP activity with and without the mutation in the Espn promoter. For all SEAP assays, at least three independent replications were performed and n=9 for each group of experiments; t-test; ***P<0.001. (g) Chromatin immunoprecipitation (ChIP)-PCR showing the in vivo binding of Lhx1/5 on Espn promoter in the controls (top) but not in the DKO mutants (bottom); n=2 mouse cerebella pooled for each group. The ChIP experiment was repeated three times, each with two different mouse cerebella per group.
Figure 4
Figure 4. Knockdown of Espn disrupts F-actin localization and dendritic development in PCs.
(a) Semiquantitative RT-PCR showing significant downregulation of Espn in cerebellar slice cultures after transfection of Espn siRNA; n=3 mice per group. (b) Western blots showing significant knockdown of Espin protein in stable HEK293A cells expressing Espin-DsRed after transfection with Espn siRNA; n=3 per group. (c) Representative PCs from P14 cerebellum slice cultures co-transfected with pDsRed and nontargeting siRNA (left panels) or Espn siRNA (right panels) and collected at 3 days in vitro (DIV). Zoom-in images of yellow boxed regions show the dendritic spines of the respective PCs. White arrows point to the mature spines while arrowheads point to the immature spines. Scale bars, 20 μm; 10 μm (zoom-in). (d) Bar graphs showing the total dendritic length (left) and the branching number (right) of PCs were significantly reduced after transfection of Espn siRNA. (e) Bar graphs showing the density of dendritic spines (left) and the percentage of mature spines (right) of PCs were significantly reduced after transfection of Espn siRNA. Brackets show the number of transfected PCs analysed. N=7–8 mice; t-test; ***P<0.001. (f,g) F-actin cytoskeleton was visualized by co-transfection of EGFP-Actin into P14 PCs transfected with nontargeting siRNA (f) or Espn siRNA (g). Only the central focal planes of the PC proximal dendrites were shown here. Scale bars, 10 μm. Fluorescence intensity profile plots (across the yellow doted lines) reveal the distribution of F-actin in the dendritic shafts of the proximal dendrites of the transfected PCs, respectively. Areas shaded in cyan represent the dendritic shafts. Each profile plot was sampled from 11 different PCs from 4 to 6 different mice and the curves represent the mean values with surrounding shaded regions as s.e.m. Note the shift of F-actin to the centre of the dendritic shafts in the PCs transfected with Espn siRNA.
Figure 5
Figure 5. Distorted F-actin localization in the PCs of DKO mutants in vivo.
(a,b) Immunostaining of IP3R1 (magenta) and phalloidin staining (green) in the cerebellum sections from the controls (a) and the DKO mutants (b). Phalloidin (green) stained the F-actin cytoskeleton while IP3R1 (magenta) marked PCs. Lower panels are the zoom-in images of boxed regions respective to the upper panels. Only the central focal planes of the PC proximal dendrites are shown here. Cyan dotted curves highlight the peripheries of the dendritic shafts of the proximal dendrites. Scale bars, 20 μm; 10 μm (zoom-in). (ce) Fluorescence intensity profile plots (across the dotted cyan lines) reveal the distribution of F-actin in the dendritic shafts of the proximal dendrites in the PCs from the controls (c) and the DKO mutants (d). Areas shaded in cyan represent the dendritic shafts. Each profile plot was sampled from 10 different PCs from 4 different mice and the curves represent mean±s.e.m. Note the altered distribution of F-actin in the centre of dendritic shafts in the PCs of the DKO mutants in vivo (e).
Figure 6
Figure 6. Defects in spine morphogenesis and synaptogenesis in the PCs of DKO mutants in vivo.
(a) High-magnification images of Golgi-impregnated PCs showed the morphology and arrangement of dendritic spines in the controls and the DKO mutants. Arrowheads point to immature filopodium-like dendritic spines. Scale bars, 10 μm. (b) Bar graphs showing dendritic spine density of the PCs (left) in the controls and the DKO mutants did not have significant differences but the percentage of mature spines (right) significantly decreased in the PCs of DKO mutant. Brackets show the number of PC dendrites analysed; N=3 mice per group. (c) Representative electron micrographs from cerebellum of the controls and the DKO mutants. Arrows point the PF-PC synapses and asterisks mark the PC dendritic spines that cannot form synapses. Scale bars, 500 nm. (d) Bar graph showing the density of the PF-PC synapses was significantly reduced in the DKO mutants. Brackets show the number of electron micrographs (at 15,000 × magnification) analysed; N=2–3 mice per group. (e) Immunostaining of IP3R1 (green) and VGluT2 (magenta) showing differences in CF-PC innervations between the controls and the DKO mutants. Zoom-in images of VGluT2 immunostaining (f,g) showing the normal distribution of CF inputs in the control (f) but abnormal clustering of CF inputs on the proximal dendrites of the mutant PCs (g). Some proximal dendrites of DKO mutant PCs (h,i) did not innervate with CFs. Scale bars, 20 μm; 10 μm for (fi). (j) Bar graphs showing the climbing height of CFs (top) and the density of VGluT2 puncta (bottom) in the cerebella from the controls and the DKO mutants. CF terminals significantly reduced in the mutants. Brackets indicate the number of sections analysed. At least three mice were analysed per group; t-test; ns, not significant; *P<0.05 and ***P<0.001.
Figure 7
Figure 7. C-terminus of actin-bundling module of Espin is required for proper F-actin localization.
(a) Schematic representation of Espin-DsRed and jerker-Espin-DsRed. The nucleotide in blue (marked by asterisk) was deleted and resulted in a frameshift mutation in C-terminus of jerker-Espin. The resulting jerker-Espin-DsRed had a shorter and mutated actin-bundling module (ABM*). (be) Central focal planes of the PC proximal dendrites from P14 control (b) or DKO mutant (ce) co-transfected with EGFP-Actin and pDsRed (b,c) or Espin-DsRed (d) or jerker-Espin-DsRed (e). Scale bars, 10 μm. (fi) Fluorescence intensity profile plots (across the yellow doted lines) reveal the distribution of F-actin in the dendritic shafts of the proximal dendrites of the transfected PCs, respectively. Areas shaded in cyan represent the dendritic shafts. Each profile plot was sampled from 10 different PCs from 4 to 5 different mice and the curves represent mean±s.e.m. Note that the F-actin localization in the mutant PCs restored to the controls' pattern after transfection of Espin-DsRed.
Figure 8
Figure 8. Overexpression of Espin rescues the dendritic defects in the PCs of the DKO mutants ex vivo.
(a) Representative PCs from P14 cerebellum slice cultures of the DKO mutants transfected with pDsRed or Espin-DsRed or jerker-Espin-DsRed and collected at 3 days in vitro (DIV). PCs from P14 control mice transfected with pDsRed served as the controls. Zoom-in images of yellow boxed regions show the dendritic spines of the respective PCs. Note that the dendritic trees of the mutant PCs transfected with Espin-DsRed were more extensive and had more mature spines. Scale bars, 20 μm; 10 μm (zoom-in). (b) Bar graphs showing the total dendritic length (left) and the branching number (right) of transfected PCs. The dendrite elongation and branching of the mutant PCs restored to the controls' level after transfection of Espin-DsRed. (c) Bar graphs showing the density of dendritic spines (left) and the percentage of mature spines (right). Spinogenesis and spine maturation of the mutant PCs significantly increased after transfection of Espin-DsRed or jerker-Espin-DsRed. Brackets show the number of transfected PCs analysed. N=4–9 mice. Kruskal–Wallis test; ns, not significant; *P<0.05, **P<0.01 and ***P<0.001. (d) Distal dendrites of PCs from the controls or the mutants co-transfected with EGFP-Actin and pDsRed or Espin-DsRed or jerker-Espin-DsRed. White arrows point to the mature spines while arrowheads point to the immature spines. Both normal Espin and jerker-Espin were highly colocalized with F-actin in the dendritic spines of the transfected PCs. Scale bars, 10 μm.
Figure 9
Figure 9. Aberrant electrophysiological properties in the PCs of Lhx1/5 DKO mutants.
(a) Typical traces of PC spontaneous firing showing differences in the firing patterns of spontaneous spike between the control PCs (top) and the mutant PCs (bottom). (b) Scatter plot showing the coefficient of variation (CV) of interspike intervals of the PCs from the controls or the DKO mutants. (c) Representative traces of PC firing in response to depolarizing and hyperpolarizing current injections. Regular repetitive firing and hyperpolarization with inward rectification are shown by the control PCs (top) but bursts of action potentials reminiscent of complex spikes during depolarization and at the termination of a hyperpolarizing response are shown in the mutant PCs (bottom). (d) Scatter plot showing the difference in paired-pulse ratio (PPR) between the control PCs and the mutant PCs after delivery of dual stimuli to PFs. Note the greater variability in PPRs in the PCs of the DKO mutants. Data points above the dotted line represent paired-pulse facilitation, while data points below the dotted line represent paired-pulse depression. For all scatter plots, the bars indicate the mean values and 10 PCs from 5 mice were analysed for each group.
Figure 10
Figure 10. Summary illustration of the role of Lhx1/5 in PC dendritogenesis and spine morphogenesis.
In normal mouse cerebellum, Lhx1/5 activate the expression of Espin that regulates the organization of F-actin in PC dendrites and thereby controls dendritogenesis and spine morphogenesis of PCs. The dendritic spines can maturate normally and form synapses with the presynaptic inputs. In Lhx1/5 DKO mutant cerebellum, Espin expression is downregulated due to inactivation of Lhx1/5. As a result, less Espin can be found in PC dendrites and thus F-actin becomes disorganized in PC dendrites. This disrupts dendritogenesis and the maturation of dendritic spines and results in loss of synapses with some presynaptic inputs.

Similar articles

Cited by

References

    1. Gao Z., van Beugen B. J. & De Zeeuw C. I. Distributed synergistic plasticity and cerebellar learning. Nat. Rev. Neurosci. 13, 619–635 (2012). - PubMed
    1. D'Angelo E. & Casali S. Seeking a unified framework for cerebellar function and dysfunction: from circuit operations to cognition. Front. Neural Circuits 6, 116 (2012). - PMC - PubMed
    1. DeZeeuw C. I. et al.. Spatiotemporal firing patterns in the cerebellum. Nat. Rev. Neurosci. 12, 327–344 (2011). - PubMed
    1. Person A. L. & Raman I. M. Purkinje neuron synchrony elicits time-locked spiking in the cerebellar nuclei. Nature 481, 502–505 (2012). - PMC - PubMed
    1. Person A. L. & Raman I. M. Synchrony and neural coding in cerebellar circuits. Front. Neural Circuits 6, 97 (2012). - PMC - PubMed

Publication types

MeSH terms

LinkOut - more resources