. 2017 May 18:8:15428.
doi: 10.1038/ncomms15428.

An optimized strategy to measure protein stability highlights differences between cold and hot unfolded states

Affiliations

An optimized strategy to measure protein stability highlights differences between cold and hot unfolded states

Caterina Alfano et al. Nat Commun. .

Abstract

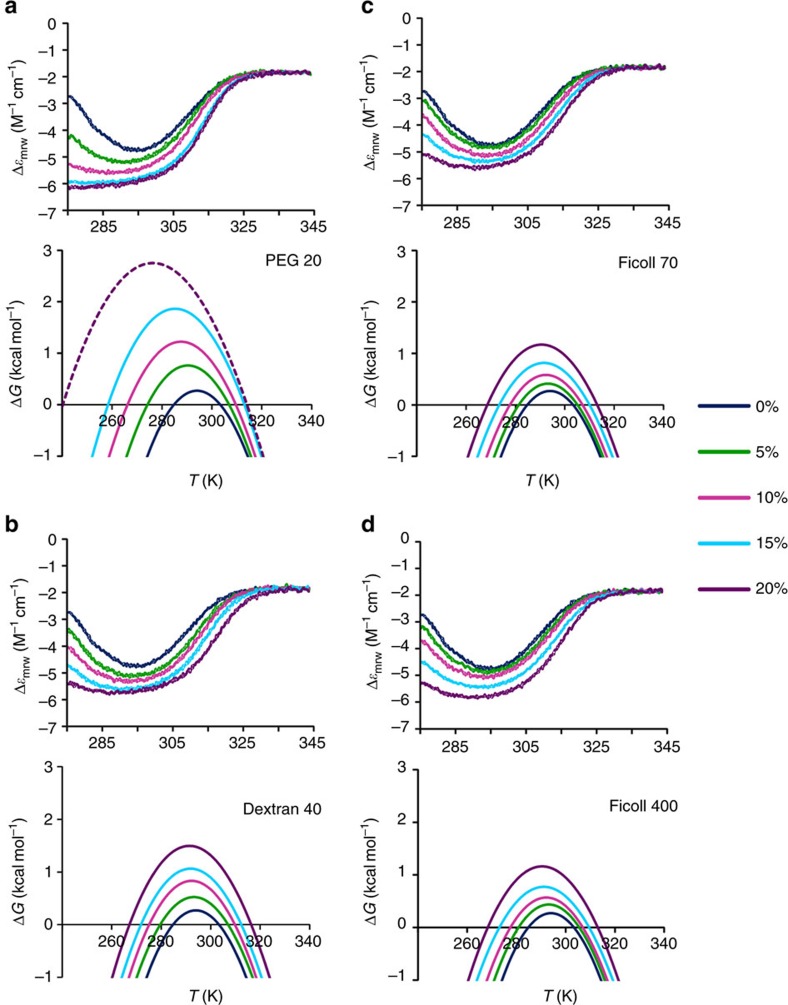
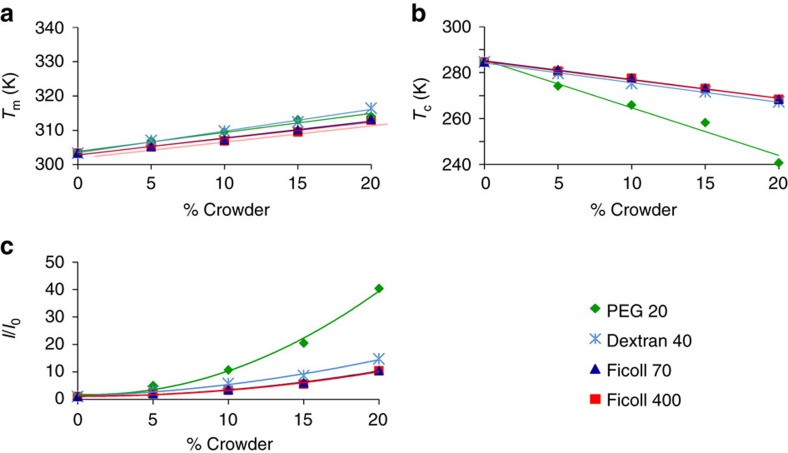
Macromolecular crowding ought to stabilize folded forms of proteins, through an excluded volume effect. This explanation has been questioned and observed effects attributed to weak interactions with other cell components. Here we show conclusively that protein stability is affected by volume exclusion and that the effect is more pronounced when the crowder's size is closer to that of the protein under study. Accurate evaluation of the volume exclusion effect is made possible by the choice of yeast frataxin, a protein that undergoes cold denaturation above zero degrees, because the unfolded form at low temperature is more expanded than the corresponding one at high temperature. To achieve optimum sensitivity to changes in stability we introduce an empirical parameter derived from the stability curve. The large effect of PEG 20 on cold denaturation can be explained by a change in water activity, according to Privalov's interpretation of cold denaturation.


Conflict of interest statement

The authors declare no competing financial interests.

Figures

Figure 1
Figure 1. Thermal denaturation of Yfh1 in the presence of crowders.
Thermograms (upper panels) in the presence of increasing concentrations of crowders: (a) PEG 20, (b) dextran 40, (c) Ficoll 70 and (d) Ficoll 400. All curves were obtained starting from solutions of 10 μM Yfh1 in a 10 mM HEPES buffer at pH 7.0 by monitoring the CD intensity at 220 nm as a function of temperature in the temperature range 275 K to 343 °C in the presence of varying concentrations of crowders. Stability curves (lower panels) of Yfh1 corresponding to the thermograms (upper panels): (a) PEG 20, (b) dextran 40, (c) Ficoll 70 and (d) Ficoll 400. The curve corresponding to 20% w/v PEG 20 is represented as a dashed line because the fitting was extrapolated from those at lower concentrations; this is due to the observation that the thermogram (upper (a) panel) shows only very upward curvature at low temperatures.
Figure 2
Figure 2. Neutrality of crowders.
Superposition of the 15N HSQC NMR spectrum of Yfh1 at 25 °C in 10 mM HEPES buffer pH 7.0 (black) and those in the presence of 5% w/v of: (a) PEG 20 (green), (b) dextran 40 (red), (c) Ficoll 70 (light blue) and (d) Ficoll 400 (orange).
Figure 3
Figure 3. Crowders and in-cell.
Superposition of the 15N HSQC NMR spectrum of Yfh1 at 25 °C in 10 mM HEPES buffer pH 7.0 (black) and those in the presence of (a) 10% w/v of PEG 20 (magenta) and (b) 20% w/v of PEG 20 (pale blue). (c) Comparison of the spectra of Yfh1 in the presence of 20% PEG 20 (black) and in E. coli (cyan).
Figure 4
Figure 4. Applications of the integral parameter.
(a) The stability curves of Sac7d (continuous line) and Metmyoglobin (dotted line) are characterized by very different values of ΔCp. (b) The stability curves of lysozyme in glycine buffer at pH 2.0 (dotted line) and in the same buffer with the addition of 5% v/v propanol (PrOH, continuous line). The curves were calculated from the thermodynamic data reported in McCrary et al. and in Velicelebi and Sturtevant for (a,b), respectively. (c) Plot of relative values of ΔG (squares) for selected hyperthermophile proteins. (d) Plot of the relative integrals (circles) for the same proteins of c.
Figure 5
Figure 5. Concentration dependence.
(a) Variation of Tm as a function of the concentration of different crowders. (b) Variation of Tc as a function of the concentration of different crowders. (c) Variation of the normalized area under the stability curve of Yfh1 as a function of the concentration of different crowders.

References

    1. Zimmerman S. B. & Trach S. O. Estimation of macromolecule concentrations and excluded volume effects for the cytoplasm of Escherichia coli. J. Mol. Biol. 222, 599–620 (1991). - PubMed
    1. Politou A. & Temussi P. A. Revisiting a dogma: the effect of volume exclusion in molecular crowding. Curr. Opin. Struct. Biol. 30, 1–6 (2015). - PubMed
    1. Hong J. & Gierasch L. M. Macromolecular crowding remodels the energy landscape of a protein by favoring a more compact unfolded state. J. Am. Chem. Soc. 132, 10445–10452 (2010). - PMC - PubMed
    1. Smith A. E., Zhang Z., Pielak G. J. & Li C. NMR studies of protein folding and binding in cells and cell-like environments. Curr. Opin. Struct. Biol. 30, 7–16 (2015). - PubMed
    1. Oshima H. & Kinoshita M. Effects of sugars on the thermal stability of a protein. J. Chem. Phys. 138, 245101 (2013). - PubMed

Publication types

MeSH terms

LinkOut - more resources