. 2017 May 18:8:15452.
doi: 10.1038/ncomms15452.

A complete tool set for molecular QTL discovery and analysis

Affiliations

A complete tool set for molecular QTL discovery and analysis

Olivier Delaneau et al. Nat Commun. .

Abstract

Population scale studies combining genetic information with molecular phenotypes (for example, gene expression) have become a standard to dissect the effects of genetic variants onto organismal phenotypes. These kinds of data sets require powerful, fast and versatile methods able to discover molecular Quantitative Trait Loci (molQTL). Here we propose such a solution, QTLtools, a modular framework that contains multiple new and well-established methods to prepare the data, to discover proximal and distal molQTLs and, finally, to integrate them with GWAS variants and functional annotations of the genome. We demonstrate its utility by performing a complete expression QTL study in a few easy-to-perform steps. QTLtools is open source and available at https://qtltools.github.io/qtltools/.


Conflict of interest statement

The authors declare no competing financial interests.

Figures
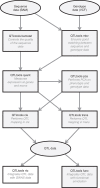
Figure 1
Figure 1. Flow chart of the main QTLtools functionalities.
This represents how the various functionalities of QTLtools can be combined to go from the raw sequence and genotype data to collections of molecular QTLs which can then be integrated with both GWAS data and functional annotations. Data is represented with ovals and tasks with boxes in which the name of the mode is shown in bold black with a short description of what it does.
Figure 2
Figure 2. Outcome of multiple key analyses on Geuvadis.
(a) The number of eGenes discovered (y axis) as a function of the number of Principal Components (x axis) used to correct for technical variance for three different ways of aggregating signal at multiple exons: at the quantification level (in blue) or at the QTL mapping level by using either the extended permutation scheme (in red) or PCA (in brown). (b) The numbers of eGenes (y axis) with a unique eQTL (solid lines) or multiple eQTLs (dotted lines) as a function of the number of principal components (x axis) used to correct for technical variance. This is shown for two approaches for aggregating the signal at multiple exons: at the quantification level (in blue) or at the QTL mapping level by using the extended permutation scheme (in red). (c) The number of eGenes on a log scale (y axis) as a function of the number of independent eQTLs discovered for those (x axis). This is again shown for two different approaches for aggregating the signal at multiple exons. (d) A Quantile–Quantile plot produced from a trans-QTL analysis on Geuvadis. Each green solid line compares the P values of associations of the original gene expression data to those obtained from a permuted data set. In total, 100 permutations have been performed, resulting in 100 green lines. (e) The density of transcription factor binding sites (TFBS) as their number per kb around the positions of two types of eQTLs shown in b (primary and secondary, gene-level quantification). (f) The enrichments of the four types of eQTLs shown in b (primary versus secondary, gene quantification versus phenotype grouping) within three types of functional annotations (Methods section). The odd ratios and the −log10 of the enrichment P values are shown on the x axis and y axis, respectively. The percentages of eQTLs falling within these annotations are shown next to the corresponding points.

Similar articles

Cited by

References

    1. Lappalainen T. et al.. Transcriptome and genome sequencing uncovers functional variation in humans. Nature 501, 506–511 (2013). - PMC - PubMed
    1. Westra H. J. et al.. Systematic identification of trans-eQTLs as putative drivers of known disease associations. Nat Genet. 45, 1238–1243 (2013). - PMC - PubMed
    1. Pickrell J. K. et al.. Understanding mechanisms underlying human gene expression variation with RNA sequencing. Nature 464, 768–772 (2010). - PMC - PubMed
    1. Picotti P. et al.. A complete mass-spectrometric map of the yeast proteome applied to quantitative trait analysis. Nature 494, 266–270 (2013). - PMC - PubMed
    1. Kraus W. E. et al.. Metabolomic Quantitative Trait Loci (mQTL) mapping implicates the ubiquitin proteasome system in cardiovascular disease pathogenesis. PLoS Genet. 11, e1005553 (2015). - PMC - PubMed

Publication types