. 2017 Oct;152(2):232-242.
doi: 10.1111/imm.12759. Epub 2017 Jun 29.

The Toll-like receptor 9 signalling pathway regulates MR1-mediated bacterial antigen presentation in B cells

Affiliations

The Toll-like receptor 9 signalling pathway regulates MR1-mediated bacterial antigen presentation in B cells

Jianyun Liu et al. Immunology. 2017 Oct.

Abstract

Mucosal-associated invariant T (MAIT) cells are conserved T cells that express a semi-invariant T-cell receptor (Vα7.2 in humans and Vα19 in mice). The development of MAIT cells requires the antigen-presenting MHC-related protein 1 (MR1), as well as commensal bacteria. The mechanisms that regulate the functional expression of MR1 molecules and their loading with bacterial antigen in antigen-presenting cells are largely unknown. We have found that treating B cells with the Toll-like receptor 9 (TLR9) agonist CpG increases MR1 surface expression. Interestingly, activation of TLR9 by CpG-A (but not CpG-B) enhances MR1 surface expression. This is limited to B cells and not other types of cells such as monocytes, T or natural killer cells. Knocking-down TLR9 expression by short hairpin RNA reduces MR1 surface expression and MR1-mediated bacterial antigen presentation. CpG-A triggers early endosomal TLR9 activation, whereas CpG-B is responsible for late endosomal/lysosomal activation of TLR9. Consistently, blocking endoplasmic reticulum to Golgi protein transport, rather than lysosomal acidification, suppressed MR1 antigen presentation. Overall, our results indicate that early endosomal TLR9 activation is important for MR1-mediated bacterial antigen presentation.

Keywords: B cells; Toll-like receptors; antigen presentation/processing; bacterial; signal transduction.


Figures

Figure 1
Figure 1
Toll‐like receptor 9 (TLR9) activation increases MR1 surface expression in B cells. (a) B‐LCL cells were treated overnight with a human TLR 1–9 agonist kit and ODN2216 (TLR9), using 10‐fold serial dilutions of the stock solutions as indicated in the Materials and methods section. Fixed Escherichia coli (MOI 300) and 6‐formylpterin (50 μm) were included as positive controls. The cells were stained with an allophycocyanin‐conjugated anti‐MR1 antibody and analysed by flow cytometry. Data from three independent experiments are summarized and the relative mean fluorescent intensity (MFI, Vehicle = 1) is shown. Data from agonist‐treated cells were compared with vehicle‐treated cells. *, < 0·05. (b) B‐LCL cells were treated with fixed E. coli, the TLR9 agonist CpG ODN2216 or control ODN overnight. The cells were stained with an allophycyanin‐conjugated anti‐MR1 antibody. (c) To determine whether CpG increases the level of total cellular MR1, the cells were fixed, permeabilized and stained with allophycocyanin‐conjugated anti‐MR1. (d) B‐LCL cells were treated overnight with fixed E. coli and stained for surface or total MR1 expression. (e) B‐LCL cells were treated overnight with the TLR9 agonist CpG ODN2216 alone, or in the presence of the TLR9 antagonist ODN TTAGGG. The cells were stained with an allophycocyanin‐conjugated anti‐MR1. (f) Human peripheral blood mononuclear cells were treated with fixed E. coli or the TLR9 agonist CpG ODN2216 overnight. The cells were stained with a phycoerythrin‐Cy7‐conjugated anti‐CD19 and allophycocyanin‐conjugated anti‐MR1 monoclonal antibody. MR1 surface expression on CD19+ peripheral blood mononuclear cells is shown. The data shown are representative of at least three independent experiments.
Figure 2
Figure 2
CpG‐A (but not CpG‐B) induces MR1 surface expression in B cells. (a) B‐LCL cells were treated CpG‐A (ODN2216) or CpG‐B (ODN2006) overnight. The cells were stained with an allophycocyanin‐conjugated anti‐MR1 Ab. (b) Human peripheral blood mononuclear cells were treated CpG‐A or CpG‐B overnight. The cells were stained with a phycocyanin/Cy7‐conjugated anti‐CD19 and allophycocyanin‐conjugated anti‐MR1 monoclonal antibody. The mean MFI of MR1 surface expression on CD19+‐gated peripheral blood mononuclear cells from three different donors is shown in (c). The data shown are representative of at least three independent experiments. *, < 0·05.
Figure 3
Figure 3
Toll‐like receptor 9 (TLR9) agonists have different effects on MR1 surface expression in other cell types. (a, b, c) Human peripheral blood mononuclear cells (PBMCs) were treated with 5 μm of CpG‐A or CpG‐B, or fixed Escherichia coli (MOI = 100) overnight (solid line). Vehicle‐treated PBMCs were used as controls (grey filled histogram). The cells were co‐stained with an allophycocyanin‐conjugated anti‐MR1 monoclonal antibody (mAb), AlexaFluor488‐conjugated anti‐human CD3, V450‐conjugated anti‐human CD16 or AlexaFluor700‐conjugated anti‐human CD14 mAbs. MR1 expression on T cells (CD3+‐gated, a), natural killer cells (CD16+‐gated, b) and monocytes (CD14+‐gated, c) is shown. The bar graphs quantify MR1's MFI on each cell type when treated with various concentrations of CpG DNA or fixed E. coli (MOI = 100) as indicated. The MFI of MR1 surface expression on T cells, natural killer cells and monocytes from three different healthy donors is displayed relative to vehicle‐treated cells (vehicle = 1). (d) Human PBMCs and THP‐1 cells were stained with an AlexaFluor700‐conjugated anti‐CD14 and allophycocyanin‐conjugated anti‐MR1 mAb. MR1 expression on CD14+‐gated cells is shown. (e) Human PBMCs and THP‐1 cells were treated with CpG‐A, CpG‐B or fixed E. coli overnight. The cells were stained with an AlexaFluor700‐conjugated anti‐CD14 and allophycocyanin‐conjugated anti‐MR1 mAb. The MFI of MR1 expression is shown. (f) THP‐1 cells were treated with a human TLR1–9 agonist kit and ODN2216 (TLR9), using 10‐fold serial dilutions of the stock solutions as indicated. The cells were stained with an allophycocyanin‐conjugated anti‐MR1 mAb. The data shown are representative of at least two independent experiments. *, < 0·05; ***, < 0·001.
Figure 4
Figure 4
Toll‐like recptor 9 (TLR9) is required for MR1 surface expression. (a) Western blots to confirm reduced TLR9 in B‐LCL cells expressing TLR9 short hairpin RNA (shRNA) or a negative control (NC). The bands were quantified using imageJ and the data shown in (b). (c) TLR9‐specific shRNA and NC cells were treated with CpG‐A overnight. Surface expression of MR1 is shown in the histograms. The relative MFI (NC = 1) of MR1 is shown in (d). (e) TLR9 shRNA and NC cells were treated with fixed Escherichia coli overnight. Surface expression of MR1 is displayed relative to the control (NC = 1). (f) TLR9 shRNA and NC cells were treated with either 2× concentrated CpG‐A conditioned medium (CM) or CpG‐A overnight. The cells were stained with an allophycocyanin‐conjugated anti‐MR1 antibody. The relative MFI of MR1 compared with the control is shown (NC = 1). The data are representative of at least two independent experiments.
Figure 5
Figure 5
Reduced bacterial antigen presentation in Toll‐like receptor 9 (TLR9) ‐deficient cells. (a) Human Vα7.2+ CD161+ T (MAIT) cells isolated from human peripheral blood mononuclear cells were sorted by flow cytometry. The cells were co‐cultured with B‐LCL cells in the presence or absence of CpG or fixed Escherichia coli for 3 days. An MR1‐specific or isotype control antibody was added to block MAIT cell activation. Supernatants were harvested and interleron‐γ was measured by ELISA. (b) B‐LCL cells expressing NC and TLR9 short hairpin RNA were treated with fixed E. coli overnight. The cells were fixed and co‐cultured with MAIT cells for 3 days. MAIT cell activation was measured by interferon‐γ production into the supernatants. Each bar is the mean of triplicate samples ±SD. *< 0·05; **< 0·01. **** P < 0·0001 The data are representative of at least three independent experiments.
Figure 6
Figure 6
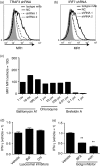
Early endosomal Toll‐like receptor 9 (TLR9) signalling by CpG‐A enhances MR1 surface expression and antigen presentation. (a) TRAF3 short hairpin RNA (shRNA) and NC cells were treated with CpG‐A overnight. The cells were stained with an allophycocyanin‐conjugated anti‐MR1 monoclonal antibody (mAb) and analysed by flow cytometry. (b) Interferon regulatory factor 7 (IRF7) shRNA and NC cells were treated with CpG‐A overnight. The cells were stained with an allophycocyanin‐conjugated anti‐MR1 mAb for MR1 cell surface expression analysis by flow cytometry. (c) B‐LCL cells were treated with fixed Escherichia coli in the presence of the indicated concentrations of bafilomycin A, chloroquine or brefeldin A overnight. The cells were stained with an allophycocyanin‐conjugated anti‐MR1 mAb and surface MR1 was analysed by flow cytometry. The relative MFI of MR1 expression compared with the control is shown (vehicle = 100). (d) B‐LCL cells were treated with bafilomycin A1 (Baf) or chloroquine (Chl) overnight, fixed and co‐cultured with MAIT cells in the presence of fixed E. coli for 3 days. (e) B‐LCL cells were treated with brefeldin A (BFA) or monensin (Mon) overnight, fixed, and co‐cultured with MAIT cells in the presence of fixed E. coli for 3 days. Activation of MAIT cells was measured by interferon‐γ production into the supernatants. Each bar is the mean of duplicate samples ±SD. **< 0·01. Representative data from three independent experiments are shown.
Figure 7
Figure 7
Illustration showing early endosomal Toll‐like receptor 9 (TLR9)‐dependent signalling in the control of MR1‐mediated bacterial antigen presentation in antigen‐presenting cells. Upon a bacterial infection, activation of the TLR9 early endosomal signalling pathway enhances the endocytic trafficking of MR1 to the cell surface and thereby regulates MR1‐mediated bacterial antigen presentation. EE: early endosomes; ER: endoplasmic reticulum. [Colour figure can be viewed at wileyonlinelibrary.com]

Similar articles

Cited by

References

    1. Le Bourhis L, Guerri L, Dusseaux M, Martin E, Soudais C, Lantz O. Mucosal‐associated invariant T cells: unconventional development and function. Trends Immunol 2011; 32:212–8. - PubMed
    1. Le Bourhis L, Martin E, Peguillet I, Guihot A, Froux N, Core M et al Antimicrobial activity of mucosal‐associated invariant T cells. Nat Immunol 2010; 11:701–8. - PubMed
    1. Napier RJ, Adams EJ, Gold MC, Lewinsohn DM. The role of mucosal associated invariant T cells in antimicrobial immunity. Front Immunol 2015; 6:344. - PMC - PubMed
    1. Eberhard JM, Hartjen P, Kummer S, Schmidt RE, Bockhorn M, Lehmann C et al CD161+ MAIT cells are severely reduced in peripheral blood and lymph nodes of HIV‐infected individuals independently of disease progression. PLoS One 2014; 9:e111323. - PMC - PubMed
    1. Le Bourhis L, Dusseaux M, Bohineust A, Bessoles S, Martin E, Premel V et al MAIT cells detect and efficiently lyse bacterially‐infected epithelial cells. PLoS Pathog 2013; 9:e1003681. - PMC - PubMed

Publication types

MeSH terms

LinkOut - more resources