. 2017 Aug;65(8):1302-1316.
doi: 10.1002/glia.23163. Epub 2017 May 18.

Reduced gliotransmitter release from astrocytes mediates tau-induced synaptic dysfunction in cultured hippocampal neurons

Affiliations

Reduced gliotransmitter release from astrocytes mediates tau-induced synaptic dysfunction in cultured hippocampal neurons

Roberto Piacentini et al. Glia. 2017 Aug.

Abstract

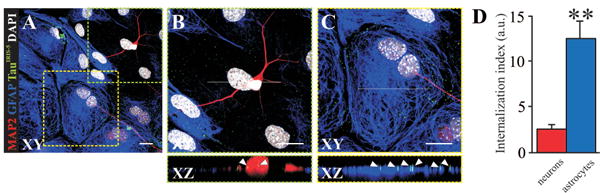
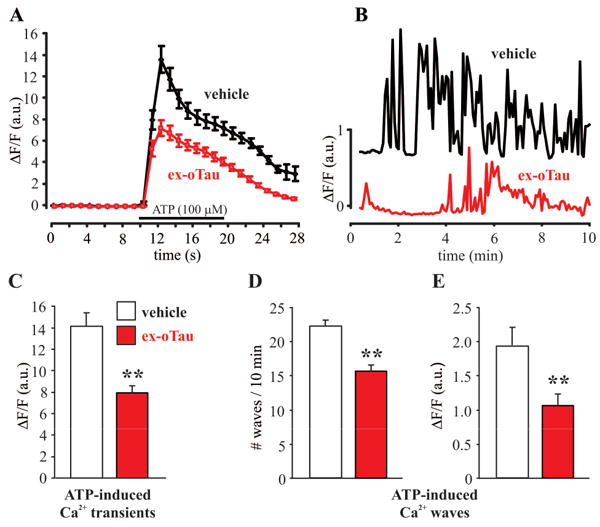
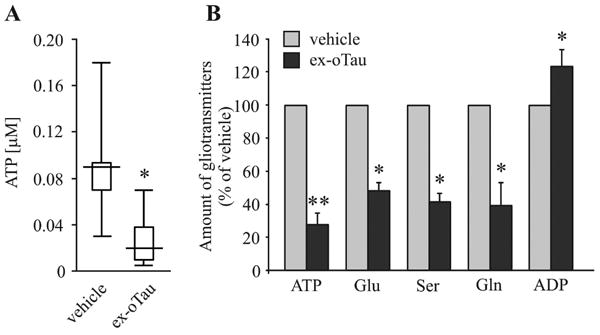
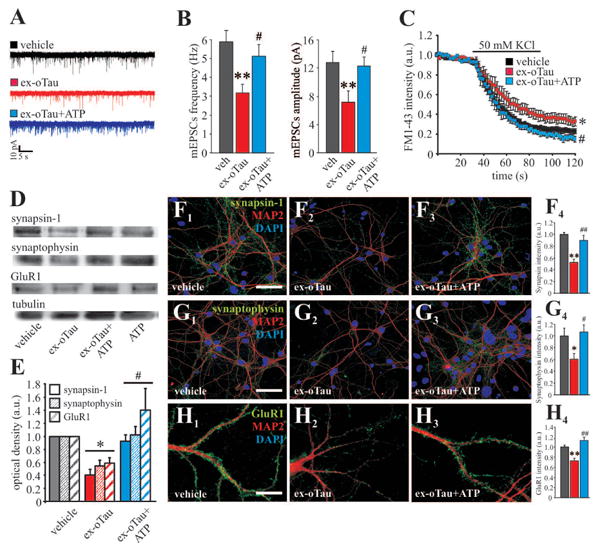
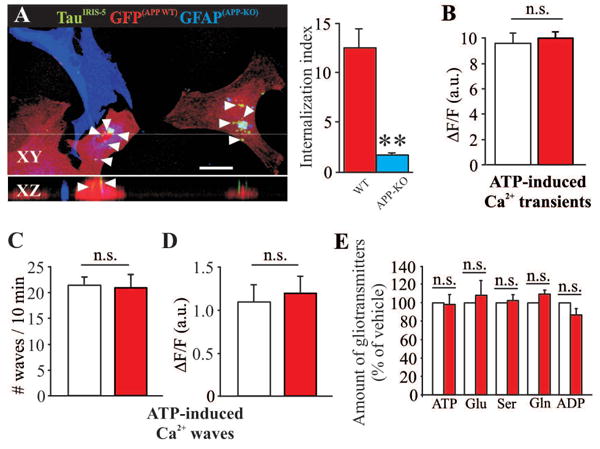
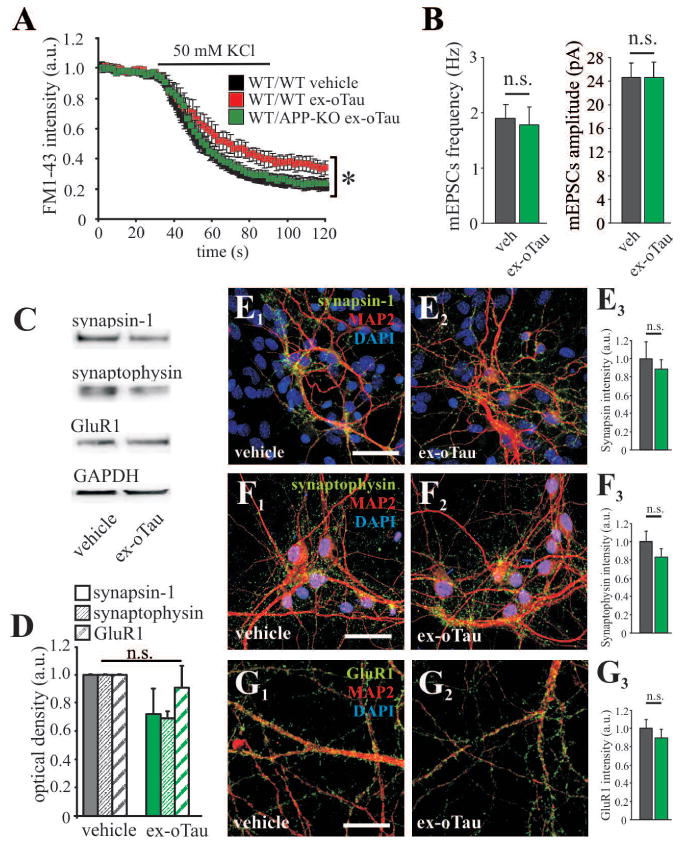
Tau is a microtubule-associated protein exerting several physiological functions in neurons. In Alzheimer's disease (AD) misfolded tau accumulates intraneuronally and leads to axonal degeneration. However, tau has also been found in the extracellular medium. Recent studies indicated that extracellular tau uploaded from neurons causes synaptic dysfunction and contributes to tau pathology propagation. Here we report novel evidence that extracellular tau oligomers are abundantly and rapidly accumulated in astrocytes where they disrupt intracellular Ca2+ signaling and Ca2+ -dependent release of gliotransmitters, especially ATP. Consequently, synaptic vesicle release, the expression of pre- and postsynaptic proteins, and mEPSC frequency and amplitude were reduced in neighboring neurons. Notably, we found that tau uploading from astrocytes required the amyloid precursor protein, APP. Collectively, our findings suggests that astrocytes play a critical role in the synaptotoxic effects of tau via reduced gliotransmitter availability, and that astrocytes are major determinants of tau pathology in AD.

Keywords: APP; synaptic proteins; synaptic transmission; tauopathy; tripartite synapse.


Figures

Figure 1
Figure 1. ex-oTau enters astrocytes more efficiently than neurons in vitro
(A) Representative example of tau accumulation in cultured hippocampal astrocytes and neurons. Tau (100 nM) was labelled with IRIS-5 ester dye at the N-terminus (here visualized in green to increase contrast) and then applied to the culture medium for 1 hour. Neurons were recognized by their immunoreactivity for the microtubule associated protein 2 (MAP2, visualized in red) and astrocytes were recognized by their immunoreactivity for Glial Fibrillary Acidic Protein (GFAP, visualized in blue). DAPI (shown in white) was used to identify cell nuclei. (B, C) Enlargements of dotted boxes outlined in (A) showing tau accumulation in a neuron (B) and an astrocyte (C). Bottom images represent XZ cross-sections from the Z-stack acquisitions showing internalization of tau in MAP2- and GFAP-positive cells (DAPI signal has been removed to allow tau quantification). Scale bars: 10 μm. (D) Bar graph showing the “internalization index” evaluated in neurons (MAP2) and astrocytes (GFAP) from the same cultures ** P<0.0001 vs. neurons.
Figure 2
Figure 2. Ex-oTau treatment affects intracellular Ca2+ signals in cultured astrocytes
(A) Mean time-course of ATP-induced intracellular Ca2+ transients in Fluo-4-loaded mouse cultured astrocytes treated with either vehicle or ex-oTau (100 nM) for 1 hour. (B) Representative examples of ATP-elicited Ca2+ waves in astrocytes treated as in (A). (C) Bar graph showing the mean peak amplitude of ATP-induced Ca2+ transients. (D,E) Bar graphs showing the mean frequency and amplitude of Ca2+ waves in vehicle- and oTau-treated cultured astrocytes. ** P<0.001
Figure 3
Figure 3. Ex-oTau treatment affects gliotransmitter release from cultured astrocytes
(A) Bar graphs quantifying the amount of ATP released extracellularly from cultured astrocytes during 1-hour treatment with either vehicle or ex-oTau (100 nM) and evaluated by HPLC. Data are presented as median with interquartile range; whiskers are the minimum and maximum. (B) Bar graphs summarizing the amount of various gliotransmitters released in the culture medium of astrocytes following 1-hour treatment with either vehicle or ex-oTau (100 nM). Values are normalized with respect to vehicle. * P<0.05 and ** P<0.001 vs. vehicle.
Figure 4
Figure 4. Exogenous ATP reverts the synaptic effects of ex-oTau
(A) Representative examples of miniature excitatory post-synaptic currents (mEPSCs) recorded from neurons treated with vehicle, 100 nM ex-oTau or ex-oTau+ATP (10 μM) for 1 hour. (B) Bar graphs showing the mean frequencies and amplitudes of mEPSCs recorded from neurons treated with vehicle [n=20], 100 nM ex-oTau [n=18], or ex-oTau+ATP (10 μM) [n=17] for 1 hour. (C) Mean time course of FM1-43 intensity following 50 mM KCl stimulation in neurons treated as in (A, B) [n=10 for vehicle and 7 for both ex-oTau and ex-oTau]. (D) Representative Western blot analysis of synapsin-1, synaptophysin and GluR1 performed on lysates of neuronal cultures treated for 1 hour with vehicle, 100 nM ex-oTau or ex-oTau+ATP (10 μM). Tubulin was used as loading control. (E) Densitometric analysis of three independent Western blot experiments carried out as in D. (F-H) Representative examples of confocal images of neuronal cultures treated with vehicle, 100 nM oTau or oTau+ATP (10 μM) for 1 hour and immunostained for the neuronal marker MAP2 and the presynaptic proteins synapsin-1 (F), synaptophysin (G), and the postsynaptic protein GluR1 (H). Bar graphs showing mean fluorescence intensity of synapsin-1 (F4) synaptophysin (G4) and GluR1 (H4) in the panels F1-3-H1-3. Scale bar 20 μm. * P<0.05 vs. vehicle; ** P<0.005 vs. vehicle; # P<0.05 vs. tau,## P<0.005 vs. tau. Statistical significance was assessed by one-way ANOVA followed by Student-Newman-Keuls' test.
Figure 5
Figure 5. APP-KO astrocytes do not internalize tau and are unaffected by ex-oTau application
(A) Example of co-culture of APP-KO astrocytes (immunostained with anti-GFAP and visualized in blue) and WT-eGFP astrocytes (visualized in red) treated for 7 hours with IRIS-5-labelled tau (visualized in green). Arrowheads indicate tau spots that are present in WT-eGFP astrocytes only. Bottom image represents XZ cross-sections from the Z-stack acquisitions showing internalization of tau in GFP-positive astrocytes. Bar graph on the right shows the “internalization index” evaluated in APP-WT (red) and APP-KO (blue) astrocytes ** P<0.005 KO vs. WT. Scale bar: 10 μm. (B) Bar graph showing the mean peak amplitudes of ATP-induced Ca2+ transients. In this and the other panels white bars referred to vehicle whereas red ones referred to ex-oTau. (C,D) Bar graphs showing the mean frequency and amplitude of Ca2+ waves in vehicle- and ex-oTau-treated cultured APP-KO astrocytes. (E) Bar graphs indicating the amount of gliotransmitters released from astrocytes following 1-hour treatment with either vehicle or ex-oTau (100 nM) and measured by HPLC. Values are normalized with respect to vehicle. “n.s.” means not statistically significant difference.
Figure 6
Figure 6. Synaptic function in WT hippocampal neurons plated on APP-KO astrocytes is not affected by ex-oTau
(A) Time course of FM1-43 intensity following 1-hour ex-oTau (100 nM) treatment of hippocampal WT neurons plated on a layer of either WT astrocytes (WT/WT tau; red trace) or APP-KO astrocytes (WT/APP-KO tau; green trace), compared with that of WT neurons plated on a layer of WT astrocytes exposed to vehicle (WT/WT vehicle). Vesicular release was induced by depolarizing neurons with 50 mM KCl. (B) Bar graphs showing the mean frequencies and amplitudes of mEPSCs recorded from WT neurons plated on APP-KO astrocytes and treated with either vehicle [n=14] or 100 nM ex-oTau [n=25] for 1 hour. (C) Representative Western blot analysis of synapsin-1, synaptophysin and GluR1 performed on lysates hippocampal WT neurons plated on a layer of APP-KO astrocytes and treated with either vehicle or 100 nM ex-oTau. GAPDH was used as loading control. (D) Densitometric analysis of three independent western blot experiments carried out as in C. (E-G) Representative examples of WT hippocampal neurons immunostained for the neuronal marker MAP2 and the synaptic proteins synapsin-1, synaptophysin and GluR1. Bar graphs quantifying synapsin-1 (E3), synaptophysin (F3) and GluR1 (G3) after treatment with vehicle or ex-oTau. Scale bars: 20 μm for panels E,F; 10 μm for panel G; *P<0.05.

Similar articles

Cited by

References

    1. Amorini AM, Giorlandino C, Longo S, D'Urso S, Mesoraca A, Santoro ML, Picardi M, Gullotta S, Cignini P, Lazzarino D, Lazzarino G, Tavazzi B. Metabolic profile of amniotic fluid as a biochemical tool to screen for inborn errors of metabolism and fetal anomalies. Mol Cell Biochem. 2012;359:205–216. - PubMed
    1. Amorini AM, Lazzarino G, Di Pietro V, Signoretti S, Lazzarino G, Belli A, Tavazzi B. Severity of experimental traumatic brain injury modulates changes in concentration of cerebral free amino acids. J Cell Mol Med. 2016 doi: 10.11/jcmm.12998. In press. - DOI - PMC - PubMed
    1. Araque A, Sanzgiri RP, Parpura V, Haydon PG. Calcium elevation in astrocytes causes an NMDA receptor-dependent increase in the frequency of miniature synaptic currents in cultured hippocampal neurons. J Neurosci. 1998;18:6822–6829. - PMC - PubMed
    1. Asai H, Ikezu S, Tsunoda S, Medalla M, Luebke J, Haydar T, Wolozin B, Butovsky O, Kügler S, Ikezu T. Depletion of microglia and inhibition of exosome synthesis halt tau propagation. Nat neurosci. 2015;18:1584–1593. - PMC - PubMed
    1. Bolós M, Llorens-Martín M, Jurado-Arjona J, Hernández F, Rábano A, Avila J. Direct Evidence of Internalization of Tau by Microglia In Vitro and In Vivo. J Alzheimers Dis. 2016;50:77–87. - PubMed

MeSH terms

LinkOut - more resources