

Comment
doi: 10.1371/journal.pone.0175535.
eCollection 2017.
On the slope of the regression between stem cell divisions and cancer risk, and the lack of correlation between stem cell divisions and environmental factors-associated cancer risk
Affiliations
- PMID: 28520721
- PMCID: PMC5433839
- DOI: 10.1371/journal.pone.0175535
Item in Clipboard
Comment
On the slope of the regression between stem cell divisions and cancer risk, and the lack of correlation between stem cell divisions and environmental factors-associated cancer risk
PLoS One.
.
No abstract available
Conflict of interest statement
Figures
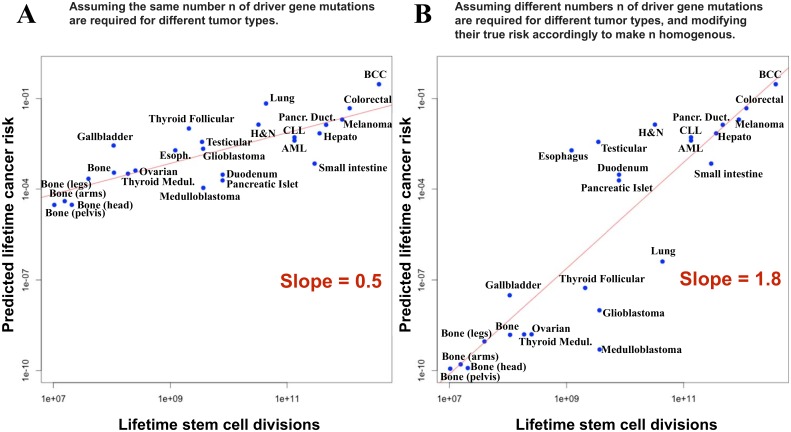
(A) Regression line (red), for predicted cancer risk if it is assumed that all cancer types require exactly the same number of driver gene mutations, n, as assumed by Little et al. [1]. The slope of the regression line is 0.5. (B) Regression line (red), for predicted cancer risk if it is assumed that different cancer types require different numbers n of driver gene mutations (two in bone, ovarian, thyroid, gallbladder, brain, and lung cancer, and three drivers in all other cancer types.) To make the data points homogeneous in n, in order to regress on them, their risk was modified according to an Armitage and Doll model, for simplicity, with a mutation rate u = 5x10⁻⁷ per gene per cell division. All other variables were identical to those in A. The slope of the regression line is 1.8.
Comment on
-
Lack of Correlation between Stem-Cell Proliferation and Radiation- or Smoking-Associated Cancer Risk.PLoS One. 2016 Mar 31;11(3):e0150335. doi: 10.1371/journal.pone.0150335. eCollection 2016. PLoS One. 2016. PMID: 27031507 Free PMC article.
Similar articles
-
Lack of Correlation between Stem-Cell Proliferation and Radiation- or Smoking-Associated Cancer Risk.PLoS One. 2016 Mar 31;11(3):e0150335. doi: 10.1371/journal.pone.0150335. eCollection 2016. PLoS One. 2016. PMID: 27031507 Free PMC article.
-
Decreased p53 is associated with a decline in asymmetric stem cell self-renewal in aged human epidermis.Aging Cell. 2021 Feb;20(2):e13310. doi: 10.1111/acel.13310. Epub 2021 Feb 1. Aging Cell. 2021. PMID: 33524216 Free PMC article.
-
Quantifying substantial carcinogenesis of genetic and environmental factors from measurement error in the number of stem cell divisions.BMC Cancer. 2022 Nov 19;22(1):1194. doi: 10.1186/s12885-022-10219-w. BMC Cancer. 2022. PMID: 36402971 Free PMC article.
-
Self-renewal molecular mechanisms of colorectal cancer stem cells.Int J Mol Med. 2017 Jan;39(1):9-20. doi: 10.3892/ijmm.2016.2815. Epub 2016 Nov 30. Int J Mol Med. 2017. PMID: 27909729 Free PMC article. Review.
-
Metabolism and the Control of Cell Fate Decisions and Stem Cell Renewal.Annu Rev Cell Dev Biol. 2016 Oct 6;32:399-409. doi: 10.1146/annurev-cellbio-111315-125134. Epub 2016 Aug 1. Annu Rev Cell Dev Biol. 2016. PMID: 27482603 Free PMC article. Review.
Cited by
-
A Simple 3-Parameter Model for Cancer Incidences.Sci Rep. 2018 Feb 21;8(1):3388. doi: 10.1038/s41598-018-21734-x. Sci Rep. 2018. PMID: 29467476 Free PMC article.
-
A Randomized, Double-Blind, Placebo-Controlled Investigation of Selenium Supplementation in Women at Elevated Risk for Breast Cancer: Lessons for Re-Emergent Interest in Selenium and Cancer.Biomedicines. 2022 Dec 25;11(1):49. doi: 10.3390/biomedicines11010049. Biomedicines. 2022. PMID: 36672557 Free PMC article.
-
Therapeutic Effectiveness of Anticancer Agents Targeting Different Signaling Molecules Involved in Asymmetric Division of Cancer Stem Cell.Stem Cell Rev Rep. 2023 Jul;19(5):1283-1306. doi: 10.1007/s12015-023-10523-3. Epub 2023 Mar 23. Stem Cell Rev Rep. 2023. PMID: 36952080 Review.
-
Osmolyte Induced Tumorigenesis and Metastasis: Interactions With Intrinsically Disordered Proteins.Front Oncol. 2018 Aug 28;8:353. doi: 10.3389/fonc.2018.00353. eCollection 2018. Front Oncol. 2018. PMID: 30234016 Free PMC article.
-
Spatiotemporal switching signals for cancer stem cell activation in pediatric origins of adulthood cancer: Towards a watch-and-wait lifetime strategy for cancer treatment.World J Stem Cells. 2018 Feb 26;10(2):15-22. doi: 10.4252/wjsc.v10.i2.15. World J Stem Cells. 2018. PMID: 29531638 Free PMC article. Review.
References
-
- Tomasetti C, Marchionni L, Nowak MA, Parmigiani G, Vogelstein B. Only three driver gene mutations are required for the development of lung and colorectal cancers. Proceedings of the National Academy of Sciences of the United States of America. 2015;112(1):118–23. 10.1073/pnas.1421839112 - DOI - PMC - PubMed
Publication types
MeSH terms
Grants and funding
LinkOut - more resources
Full Text Sources
Other Literature Sources
