

Comparative accuracy of CT perfusion in diagnosing acute ischemic stroke: A systematic review of 27 trials
- PMID: 28520753
- PMCID: PMC5435168
- DOI: 10.1371/journal.pone.0176622
Comparative accuracy of CT perfusion in diagnosing acute ischemic stroke: A systematic review of 27 trials
Abstract
Objective: To systematically evaluate and compare the diagnostic accuracy of CT perfusion (CTP), non-enhanced computed tomography (NCCT) and computed tomography angiography (CTA) in detecting acute ischemic stroke.
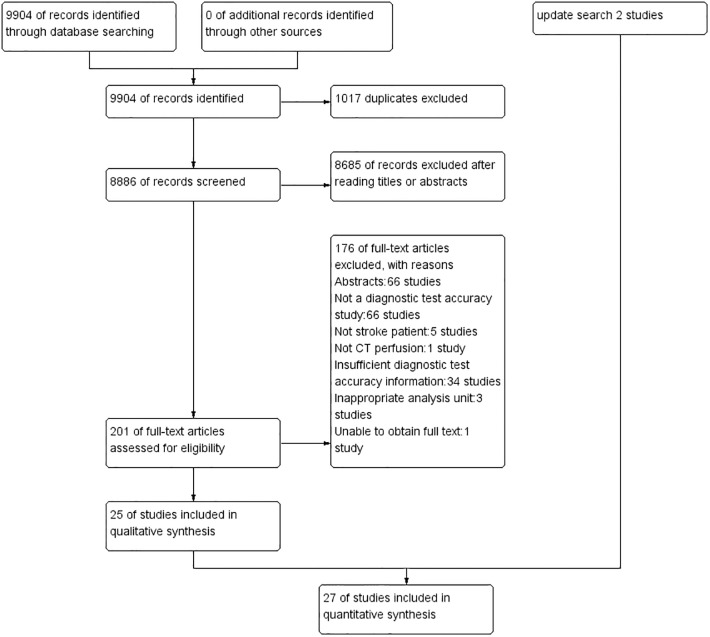
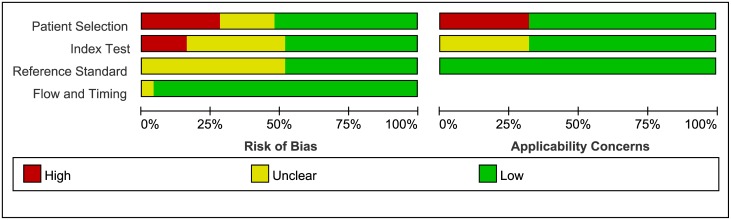
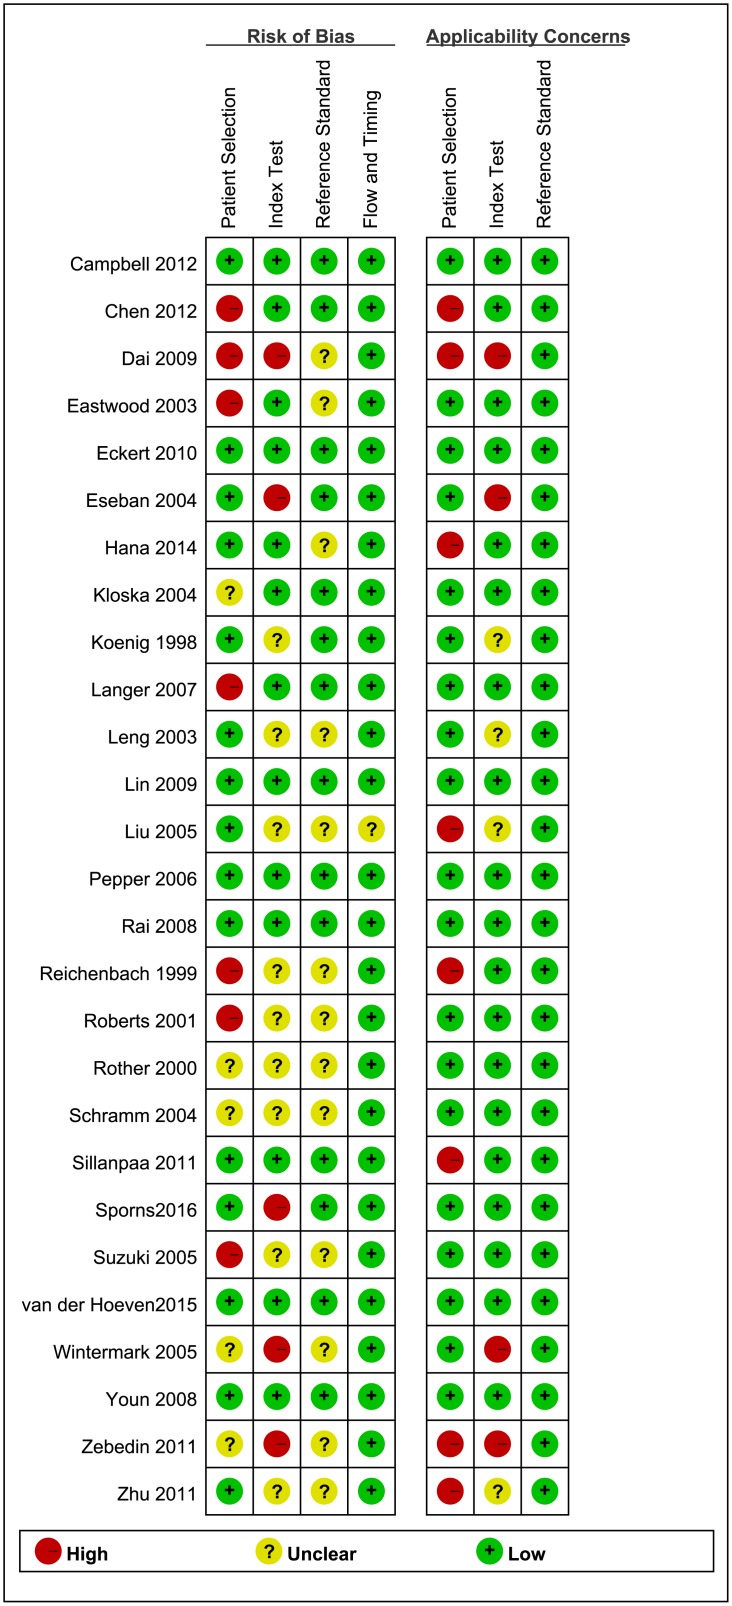
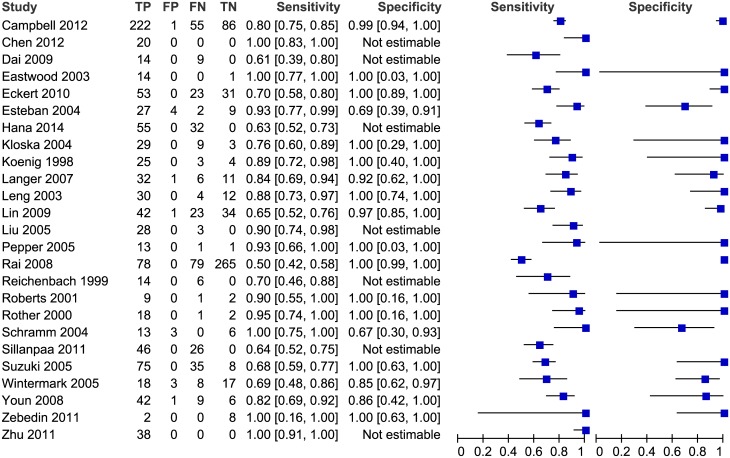
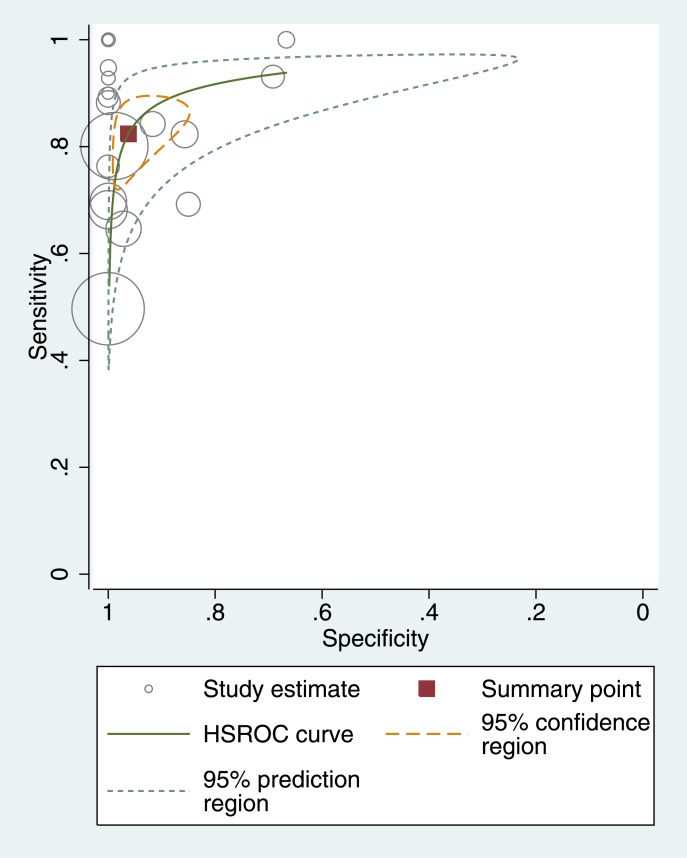
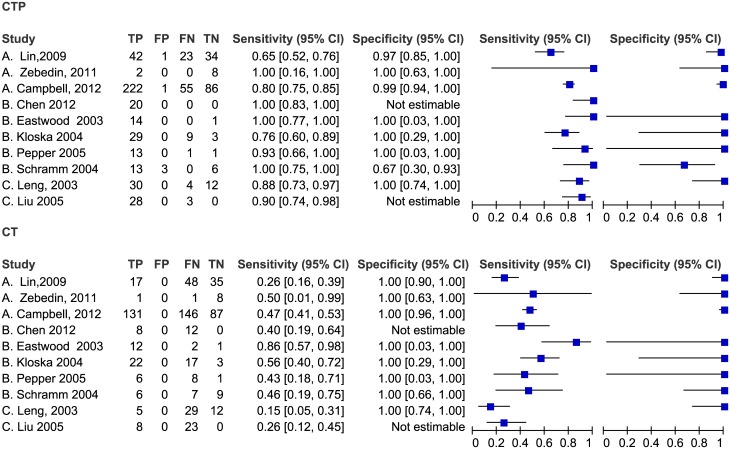
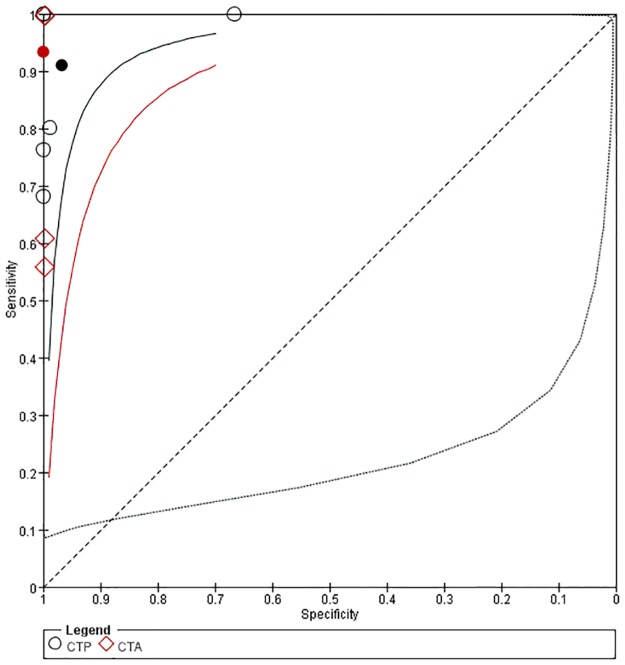
Methods: We searched seven databases and screened the reference lists of the included studies. The risk of bias in the study quality was assessed using QUADASII. We produced paired forest plots in RevMan to show the variation of the sensitivity and specificity estimates together with their 95% CI. We used a hierarchical summary ROC model to summarize the sensitivity and specificity of CTP in detecting ischemic stroke.
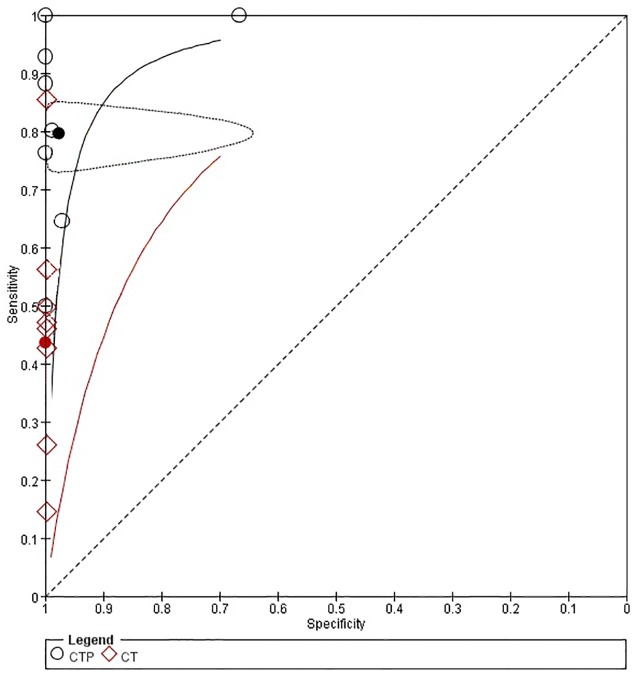
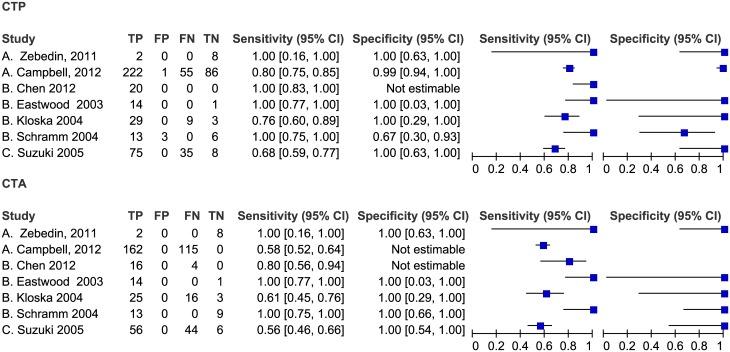
Results: We identified 27 studies with a total of 2168 patients. The pooled sensitivity of CTP for acute ischemic stroke was 82% (95% CI 75-88%), and the specificity was 96% (95% CI 89-99%). CTP was more sensitive than NCCT and had a similar accuracy with CTA. There were no statistically significant differences in the sensitivity and specificity between patients who underwent CTP within 6 hours of symptom onset and beyond 6 hours after symptom onset. No adverse events were reported in the included studies.
Conclusions: CTP is more accurate than NCCT and has similar accuracy to CTA in detecting acute ischemic stroke. However, the evidence is not strong. There is potential benefit of using CTP to select stroke patients for treatment, but more high-quality evidence is needed to confirm this result.
Conflict of interest statement
Figures
Similar articles
-
Duplex ultrasound for diagnosing symptomatic carotid stenosis in the extracranial segments.Cochrane Database Syst Rev. 2022 Jul 11;7(7):CD013172. doi: 10.1002/14651858.CD013172.pub2. Cochrane Database Syst Rev. 2022. PMID: 35815652 Free PMC article.
-
Thoracic imaging tests for the diagnosis of COVID-19.Cochrane Database Syst Rev. 2022 May 16;5(5):CD013639. doi: 10.1002/14651858.CD013639.pub5. Cochrane Database Syst Rev. 2022. PMID: 35575286 Free PMC article.
-
Three-dimensional saline infusion sonography compared to two-dimensional saline infusion sonography for the diagnosis of focal intracavitary lesions.Cochrane Database Syst Rev. 2017 May 5;5(5):CD011126. doi: 10.1002/14651858.CD011126.pub2. Cochrane Database Syst Rev. 2017. PMID: 28472862 Free PMC article.
-
Computed tomography for the diagnosis of hepatocellular carcinoma in adults with chronic liver disease.Cochrane Database Syst Rev. 2021 Oct 6;10(10):CD013362. doi: 10.1002/14651858.CD013362.pub2. Cochrane Database Syst Rev. 2021. PMID: 34611889 Free PMC article.
-
Signs and symptoms to determine if a patient presenting in primary care or hospital outpatient settings has COVID-19.Cochrane Database Syst Rev. 2022 May 20;5(5):CD013665. doi: 10.1002/14651858.CD013665.pub3. Cochrane Database Syst Rev. 2022. PMID: 35593186 Free PMC article.
Cited by
-
Dual-energy computed tomography in acute ischemic stroke: state-of-the-art.Eur Radiol. 2021 Jun;31(6):4138-4147. doi: 10.1007/s00330-020-07543-9. Epub 2020 Dec 14. Eur Radiol. 2021. PMID: 33319330 Free PMC article. Review.
-
Characteristics of cerebral perfusion and diffusion associated with crossed cerebellar diaschisis after acute ischemic stroke.Jpn J Radiol. 2020 Feb;38(2):126-134. doi: 10.1007/s11604-019-00898-0. Epub 2019 Nov 13. Jpn J Radiol. 2020. PMID: 31720951
-
Enhancing Stroke Recognition: A Comparative Analysis of Balance and Eyes-Face, Arms, Speech, Time (BE-FAST) and Face, Arms, Speech, Time (FAST) in Identifying Posterior Circulation Strokes.J Clin Med. 2024 Oct 3;13(19):5912. doi: 10.3390/jcm13195912. J Clin Med. 2024. PMID: 39407971 Free PMC article.
-
Perfluorocarbon Enhanced Glasgow Oxygen Level Dependent (GOLD) Magnetic Resonance Metabolic Imaging Identifies the Penumbra Following Acute Ischemic Stroke.Theranostics. 2018 Feb 12;8(6):1706-1722. doi: 10.7150/thno.21685. eCollection 2018. Theranostics. 2018. PMID: 29556351 Free PMC article.
-
Study on Model Iterative Reconstruction Algorithm vs. Filter Back Projection Algorithm for Diagnosis of Acute Cerebral Infarction Using CT Images.J Healthc Eng. 2021 Aug 5;2021:5000102. doi: 10.1155/2021/5000102. eCollection 2021. J Healthc Eng. 2021. PMID: 34394893 Free PMC article.
References
-
- Lozano R, Naghavi M, Foreman K, Lim S, Shibuya K, Aboyans V, et al. Global and regional mortality from 235 causes of death for 20 age groups in 1990 and 2010: a systematic analysis for the Global Burden of Disease Study 2010. Lancet. 2012; 380: 2095–2128 10.1016/S0140-6736(12)61728-0 - DOI - PMC - PubMed
-
- Murray CJ, Vos T, Lozano R, Naghavi M, Flaxman AD, Michaud C, et al. Disability-adjusted life years (DALYs) for 291 diseases and injuries in 21 regions, 1990–2010: a systematic analysis for the Global Burden of Disease Study 2010. Lancet. 2012; 380: 2197–2223 10.1016/S0140-6736(12)61689-4 - DOI - PubMed
-
- Krishnamurthi RV, Feigin VL, Forouzanfar MH, Mensah GA, Connor M, Bennett DA, et al. Global and regional burden of first-ever ischaemic and haemorrhagic stroke during 1990–2010: findings from the Global Burden of Disease Study 2010. Lancet Glob Health. 2013; 1: e259–281 10.1016/S2214-109X(13)70089-5 - DOI - PMC - PubMed
Publication types
MeSH terms
LinkOut - more resources
Full Text Sources
Other Literature Sources
Medical
