

In vitro analysis of the segmental flexibility of the thoracic spine
- PMID: 28520819
- PMCID: PMC5433776
- DOI: 10.1371/journal.pone.0177823
In vitro analysis of the segmental flexibility of the thoracic spine
Abstract
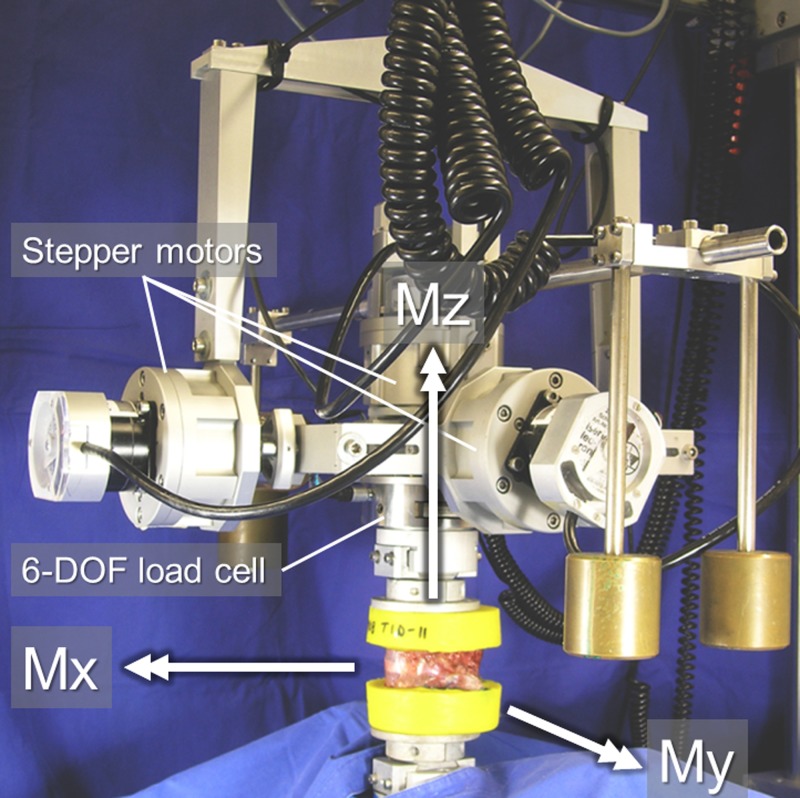
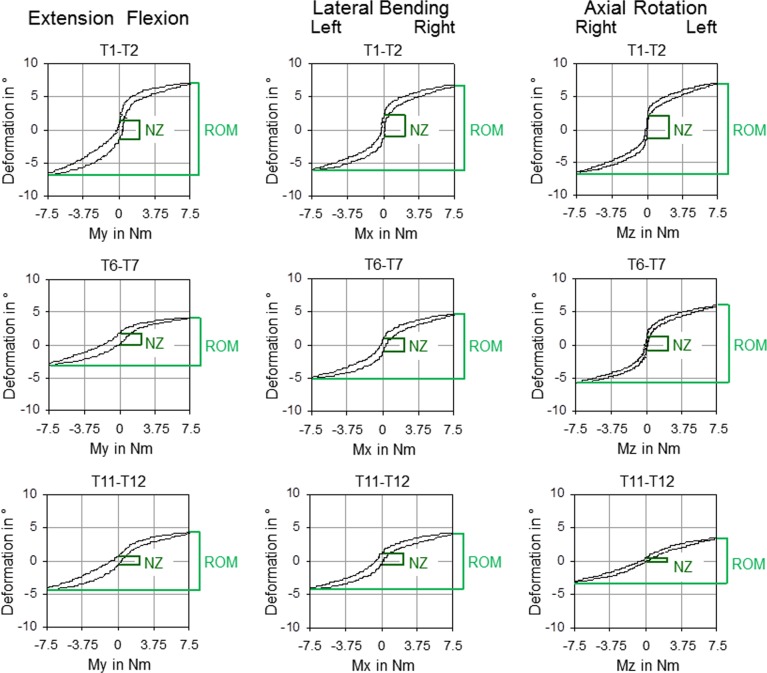
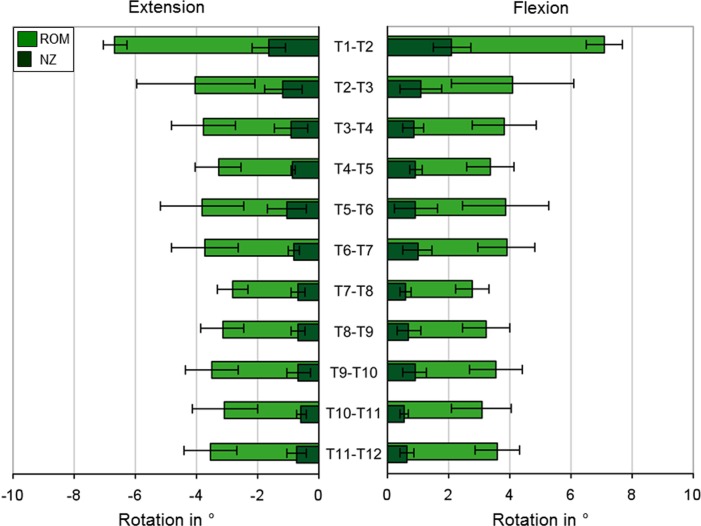
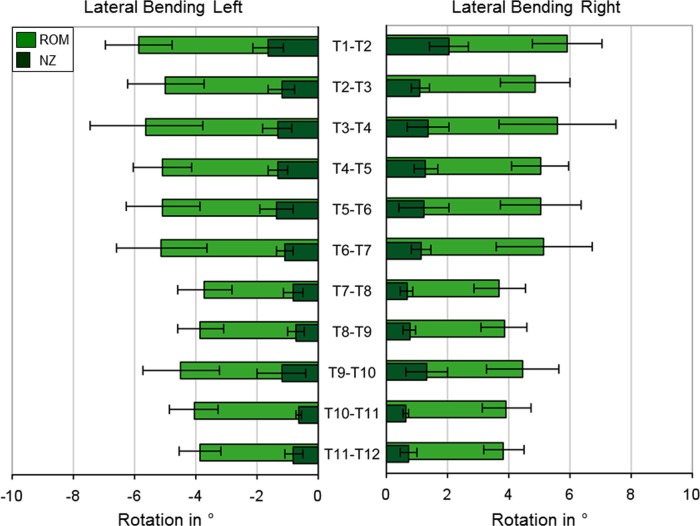
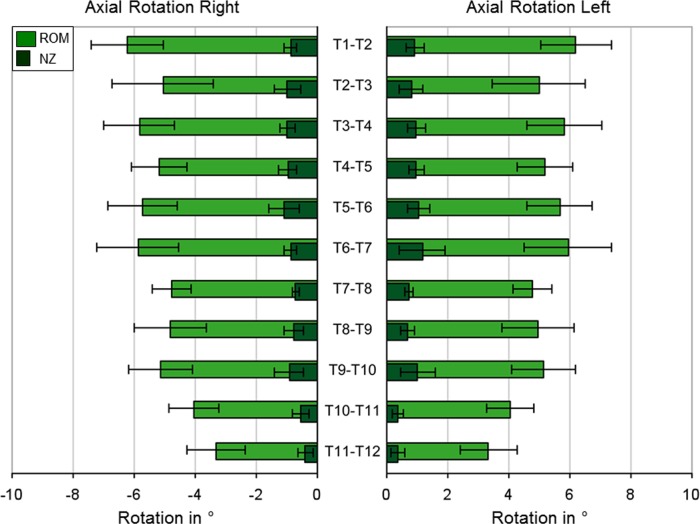
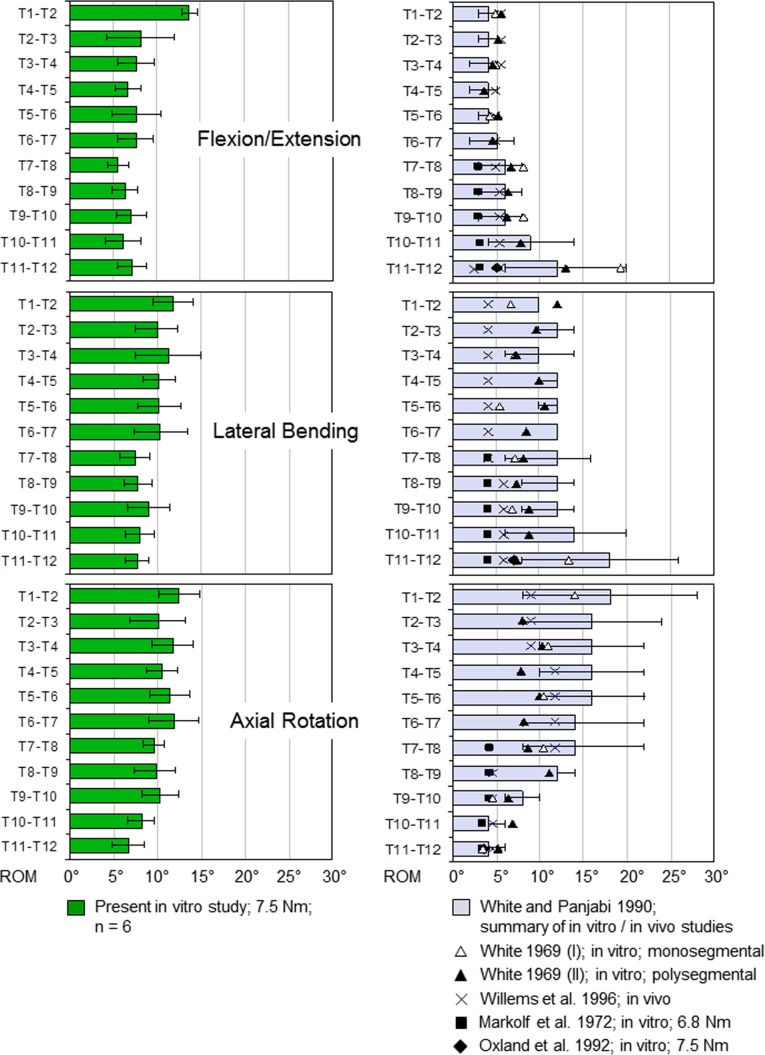
Basic knowledge about the thoracic spinal flexibility is limited and to the authors' knowledge, no in vitro studies have examined the flexibility of every thoracic spinal segment under standardized experimental conditions using pure moments. In our in vitro study, 68 human thoracic functional spinal units including the costovertebral joints (at least n = 6 functional spinal units per segment from T1-T2 to T11-T12) were loaded with pure moments of ±7.5 Nm in flexion/extension, lateral bending, and axial rotation in a custom-built spine tester to analyze range of motion (ROM) and neutral zone (NZ). ROM and NZ showed symmetric motion behavior in all loading planes. In each loading direction, the segment T1-T2 exhibited the highest ROM. In flexion/extension, the whole thoracic region, with exception of T1-T2 (14°), had an average ROM between 6° and 8°. In lateral bending, the upper thoracic region (T1-T7) was, with an average ROM between 10° and 12°, more flexible than the lower thoracic region (T7-T12) with an average ROM between 8° and 9°. In axial rotation, the thoracic region offered the highest overall flexibility with an average ROM between 10° and 12° in the upper and middle thoracic spine (T1-T10) and between 7° and 8° in the lower thoracic spine (T10-T12), while a trend of continuous decrease of ROM could be observed in the lower thoracic region (T7-T12). Comparing these ROM values with those in literature, they agree that ROM is lowest in flexion/extension and highest in axial rotation, as well as decreasing in the lower segments in axial rotation. Differences were found in flexion/extension and lateral bending in the lower segments, where, in contrast to the literature, no increase of the ROM from superior to inferior segments was found. The data of this in vitro study could be used for the validation of numerical models and the design of further in vitro studies of the thoracic spine without the rib cage, the verification of animal models, as well as the interpretation of already published human in vitro data.
Conflict of interest statement
Figures
References
-
- Goel VK, Goyal S, Clark C, Nishiyama K, Nye T. Kinematics of the Whole Lumbar Spine: Effect of Discectomy. Spine. 1985; 10(6),543–54. - PubMed
-
- Panjabi MM, Oxland TR, Yamamoto I, Crisco JJ. Mechanical behavior of the human lumbar and lumbosacral spine as shown by three-dimensional load-displacement curves. J Bone Joint Surg. 1994; 76(3),413–24. - PubMed
-
- Wilke HJ, Wolf S, Claes LE, Arand M, Wiesend A. Stability Increase of the Lumbar Spine With Different Muscle Groups: A Biomechanical In Vitro Study. Spine. 1995; 20(2),192–7. - PubMed
-
- Yamamoto I, Panjabi MM, Crisco T, Oxland T. Three-dimensional movements of the whole lumbar spine and lumbosacral joint. Spine. 1989; 14(11),1256–60. - PubMed
-
- Goel VK, Clark CR, Harris KG, Schulte KR. Kinematics of the cervical spine: effects of multiple total laminectomy and facet wiring. J Orthop Res. 1988; 6(4),611–19. doi: 10.1002/jor.1100060419 - DOI - PubMed
MeSH terms
LinkOut - more resources
Full Text Sources
Other Literature Sources
Research Materials
