

Geographic Information Systems Mapping of Diabetic Retinopathy in an Ocular Telemedicine Network
- PMID: 28520876
- PMCID: PMC5710206
- DOI: 10.1001/jamaophthalmol.2017.1153
Geographic Information Systems Mapping of Diabetic Retinopathy in an Ocular Telemedicine Network
Abstract
Importance: Minimal information exists on the use of geographic information systems mapping for visualizing access barriers to eye care for patients with diabetes.
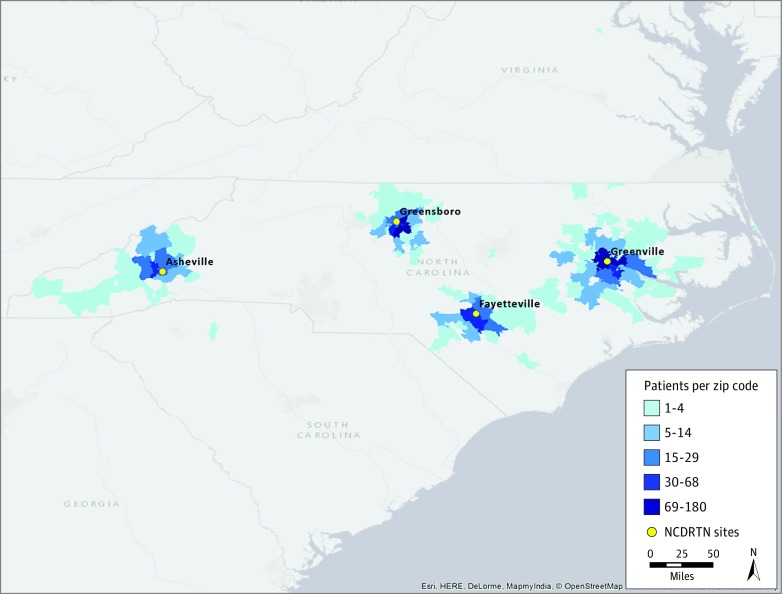
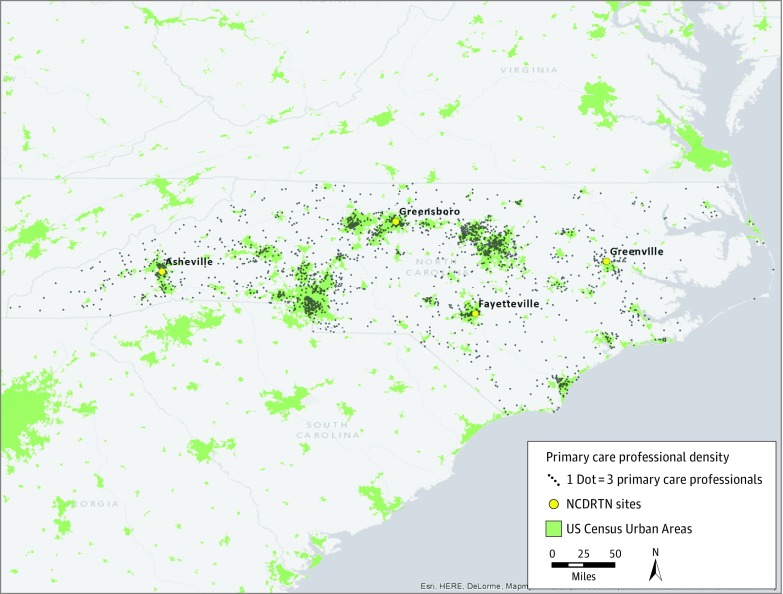
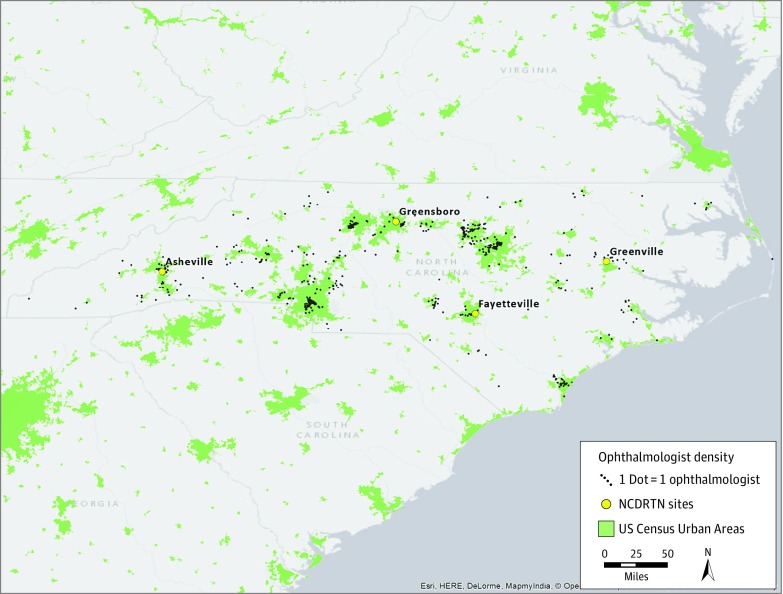
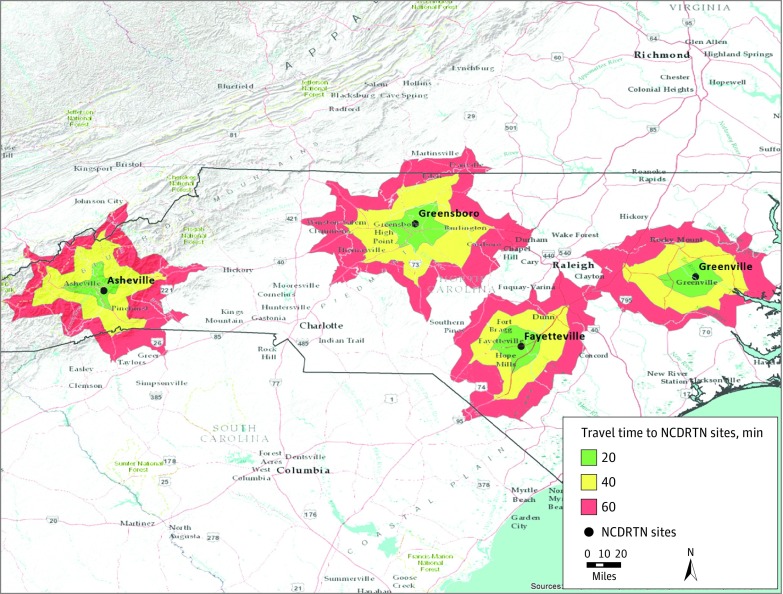
Objective: To use geographic information systems mapping techniques to visualize (1) the locations of patients participating in the North Carolina Diabetic Retinopathy Telemedicine Network, (2) the locations of primary care clinicians and ophthalmologists across the state, and (3) the travel times associated with traveling to the 5 primary care clinics in our study.
Design, setting, and participants: Cross-sectional study conducted from January 6, 2014, to November 1, 2015, at 5 Area Health Education Center primary care clinics that serve rural and underserved populations in North Carolina. In total, 1787 patients with diabetes received retinal screening photographs with remote expert interpretation to determine the presence and severity of diabetic retinopathy. Participants included patients 18 years or older with type 1 or type 2 diabetes who presented to these 5 clinics for their routine diabetes care.
Main outcomes and measures: Development of qualitative maps illustrating the density of patients with diabetes and their distribution around the 5 North Carolina Diabetic Retinopathy Telemedicine Network sites by zip code and the density of ophthalmologists and primary care clinicians by zip code relative to US Census Urban Areas. A travel time map was also created using road network analysis to determine all areas that can be reached by car in a user-specified amount of time.
Results: Mean (SD) age of patients was 55.4 (12.7) years. Women made up 62.7% of the study population. The study included more African American patients (55.4%) compared with white (35.5%) and Hispanic (5.8%) patients. The mean (SD) hemoglobin A1c level was 7.8% (2.4%) (to convert to proportion of total hemoglobin, multiply by 0.01), and the mean (SD) duration of diabetes was 9.2 (8.2) years. Whereas the clinics located in Greensboro, Asheville, and Fayetteville screened patients from more immediate surrounding areas, the Greenville site had the widest distribution of zip codes, suggesting that patients travel from greater distances to reach this facility. Primary care clinicians were spread somewhat uniformly across the state, whereas ophthalmologists were concentrated around urban centers. Also, the number and type of surface roads surrounding the clinics determined the distance and time patients must travel to receive care.
Conclusions and relevance: Geographic information systems mapping is a useful technique for visualizing geographic access barriers to eye care for patients with diabetes and may help to identify underserved areas that would benefit from the expansion of retinal screening programs via telemedicine.
Conflict of interest statement
Figures
Comment in
References
-
- Centers for Disease Control and Prevention National diabetes fact sheet: national estimates and general information on diabetes and prediabetes in the United States, 2011. http://www.cdc.gov/diabetes/pubs/pdf/ndfs_2011.pdf. Published 2011. Accessed March 22, 2017.
-
- Saaddine JB, Honeycutt AA, Narayan KMV, Zhang X, Klein R, Boyle JP. Projection of diabetic retinopathy and other major eye diseases among people with diabetes mellitus: United States, 2005-2050. Arch Ophthalmol. 2008;126(12):1740-1747. - PubMed
-
- Diabetes 2025: US, state, and metropolitan trends. http://www.altfutures.org/diabetes2025/. Accessed March 22, 2017.
-
- North Carolina State Center for Health Statistics Data for percentage of adults with diabetes North Carolina vs HNC 2020 Target. http://healthstats.publichealth.nc.gov/indicator/view_numbers/Diabetes.H.... Published 2012. Accessed March 22, 2017.
Publication types
MeSH terms
LinkOut - more resources
Full Text Sources
Other Literature Sources
Medical
