Review
. 2018 Mar 5;57(11):2768-2798.
doi: 10.1002/anie.201700171. Epub 2018 Feb 1.

Optochemical Control of Biological Processes in Cells and Animals

Affiliations
Review

Optochemical Control of Biological Processes in Cells and Animals

Nicholas Ankenbruck et al. Angew Chem Int Ed Engl. .

Abstract

Biological processes are naturally regulated with high spatial and temporal control, as is perhaps most evident in metazoan embryogenesis. Chemical tools have been extensively utilized in cell and developmental biology to investigate cellular processes, and conditional control methods have expanded applications of these technologies toward resolving complex biological questions. Light represents an excellent external trigger since it can be controlled with very high spatial and temporal precision. To this end, several optically regulated tools have been developed and applied to living systems. In this review we discuss recent developments of optochemical tools, including small molecules, peptides, proteins, and nucleic acids that can be irreversibly or reversibly controlled through light irradiation, with a focus on applications in cells and animals.

Keywords: caged compounds; chemical biology; optochemical tools; photochemistry; photoswitches.


Conflict of interest statement

Conflict of interest

The authors declare no conflict of interest.

Figures
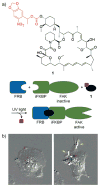
Figure 1
Figure 1
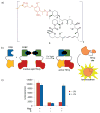
a) The structure of 1 is shown with the caging group in red. In this system, FAK activity was monitored in the presence of 1 with and without UV exposure. b) Cells treated with 1 alone did not display active FAK (left); however, UV irradiation led to activation of FAK and subsequent cell ruffling (right). Adapted with permission from Ref. [7]. Copyright 2011 American Chemical Society.
Figure 2
Figure 2
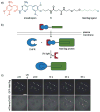
a) The complex of 2 and streptavidin is unable to enter cells and does not induce protein dimerization until UV irradiation generates 3. b) Rac-FKBP was used together with membrane localized FRB. In the absence of UV light, cells displayed normal cell edges (left); however, upon irradiation and Rac localization, cell ruffling is apparent (right). Adapted with permission from Ref. [10]. Copyright 2011 American Chemical Society.
Figure 3
Figure 3
a) The structure of 4 is shown with the caging group highlighted in red. b,c) The caged rapamycin dimer 4 was applied to a split TEV protease system consisting of FRB-TEVp (N-terminus) and FKBP-TEVp (C-terminus) to demonstrate optical control. In the presence of 4, no protease activity is detected. However, after UV irradiation and dimerization of split TEV, a luciferase reporter is proteolytically cleaved and luminescence is generated. Adapted with permission from Ref. [12]. Copyright 2015 Royal Society of Chemistry.
Figure 4
Figure 4
a) The structure of 5 is shown with the photolabile group highlighted in red, the trimethoprim group that interacts with DHFR is shown in blue, and the alkyl chloride is shown in green. b) Compound 5 enters cells and covalently labels HaloTag protein fusions. The removal of the caging group with UV light allows dimerization with the DHFR protein fusion. c) Recruitment of mCherry to centromere-localized GFP following 387 nm light exposure. Adapted with permission from Ref. [13a]. Copyright 2014 Nature Publishing Group.
Figure 5
Figure 5
a) The structure of 6 is shown with the SNAP-tag reactive region in blue, the caging group in red, and the HaloTag ligand in green. b) Upon addition of 6 to cells, the SNAP-tag and HaloTag moieties react with their respective protein binding partners, thus dimerizing the two proteins. Upon UV irradiation, the linker is cleaved to generate free proteins again. c) Hela cells co-expressing NLS-CFP-SNAP and Halo-RFP-giantin show nuclear and mitochondrial localized CFP and RFP, respectively in the absence of 6 (row 1). Following addition of 6, the SNAP-tag and HaloTag ligands react with their protein partners to form a covalent complex, which results in export of NLS-CFP-SNAP from the nucleus to the Golgi (row 2). Upon UV irradiation, nuclear localization of NLS-CFP-SNAP is obtained again (row 3). Adapted with permission from Ref. [15]. Copyright 2014 Wiley-VCH.
Figure 6
Figure 6
a) Isosteres of azobenzene (“azosteres”), for example stilbenes and arylamides, are common structural motifs found in existing pharmaceutical compounds. b) An example of azologization is shown wherein an arylamide is replaced with an azobenzene. c) Replacement of the morpholine ring in ciprofloxacin with an azobenzene functionality demonstrates an “azoextension approach.
Figure 7
Figure 7
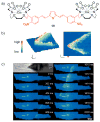
a) The structures of 7 and 8 are shown with the pharmacophore indicated in blue (left). Replacement of the stilbene moiety in combrestatin A-4 with an azobenzene group produces cis-9 which can be reversibly converted into trans-9. b) MDA-MB-231 cells treated with 9 (1.5 μM) and maintained in the dark (predominantly containing the thermodynamically more stable trans isomer) exhibit no microtubule inhibition as seen from the tubulin (green) and DNA (blue) staining. However, upon irradiation and formation of the cis isomer, microtubule inhibition is observed. Adapted with permission from Ref. [30]. Copyright 2015 Elsevier Inc.
Figure 8
Figure 8
a) The structures of 10, trans-11, and cis-11 are shown. b) Hela cells were transfected with C1-GFP, then treated with trans-11. Treatment with trans-11 does not induce membrane recruitment; however, following UV-induced conversion to cis-11, C1-GFP rapidly localizes to the membrane. Adapted with permission from Ref. [34]. Copyright 2016 Nature Publishing Group.
Figure 9
Figure 9
The caged lysophosphatidic acid 12 was used in A375M cells to demonstrate optotaxis through cell movement toward an LPA gradient established by repetitive, localized decaging. Adapted with permission from Ref. [38]. Copyright 2016 Elsevier Inc.
Figure 10
Figure 10
a) The structures of 1316 are shown, with caging groups indicated in red. b) Plates containing both caged antibiotics in the dark allowed growth of both strains. Plates subjected to visible and 312 nm light show no bacterial growth, whereas individual strains were able to grow in the presence of only one light exposure. Adapted with permission from Ref. [41]. Copyright 2014 American Chemical Society.
Figure 11
Figure 11
a) The monoclonal antibody (mAb) panitumumab is shown in blue with the photocleavable cyanine linker in red conjugated to 8 in green. b) The decaging mechanism of the cyanine dye is shown in an abbreviated form. c) Mice were implanted with A431 cells on both sides of the dorsal region. They were then injected with panitumumab-8, which localized to the developed tumors. The top tumor was irradiated with 690 nm light, while the bottom one was shielded from light. Only the tumor treated with light showed a decrease in fluorescence, which is indicative of the release of 8. The bar graph indicates that tumors maintained in the dark show minimal change in fluorescence (black bars), while the irradiated sample shows a light-dependent decrease in fluorescence (red bars). Adapted with permission from Ref. [50]. Copyright 2015 Wiley-VCH.
Figure 12
Figure 12
a) The structure of 17 is shown with the SNAP-tag ligand highlighted in blue and the caging group in red. b) U2OS cells expressing cytoplasmic SNAP-MEK1 were fixed and treated with 17. UV irradiation leads to photoactivation of 17. c) The structure of 18 is shown with the HaloTag ligand in green and the photoactivatable azide in red. d) Fixed BS-C-1 cells expressing HaloTag-α-tubulin, were treated with 18 and then subjected to diffraction-limited imaging (left) or super-resolution imaging (right). Fluorophore activation occurred under ambient light. Adapted with permission from Ref. [54] (Copyright 2011 American Chemical Society) and Ref. [55] (Copyright 2010 American Chemical Society).
Figure 13
Figure 13
a) The structure of the light-triggered chelator 19 is shown. b) Myocytes containing a fluorescent reporter for calcium were treated with 19 and then irradiated with 810 nm light at the point indicated in red, which propagated a wave of calcium in both directions from the spot of illumination. c) A similar experiment was conducted as in (b); however, a 405 nm light source was used. Adapted with permission from Ref. [59]. Copyright 2016 American Chemical Society.
Figure 14
Figure 14
a) Structure of photocaged lysine 20 with the caging group shown in red. b) Caging of a conserved lysine in the MEK1 active site blocks ATP binding and renders it inactive. c) Nuclear translocation of EGFP-ERK2 following phosphorylation after photoactivation of caged MEK1 depicted as normalized F(n/c) (ratio of nuclear to cytoplasmic EGFP fluorescence signal) as a function of time after photoactivation. The gray line represents normalized F(n/c) observed when cells are induced with EGF. d) Schematic representation of the sub-network and phosphorylation/dephosphorylation of ERK downstream of MEK. Adapted with permission from Ref. [73]. Copyright 2011 American Chemical Society.
Figure 15
Figure 15
a) Photoactivation of caged Cas9 (K866→20 mutant) affords optochemical control of gene editing. Site-specific incorporation of a nitrobenzyl caging group at the critical lysine residue K866 renders Cas9 inactive until the caging group is removed by illumination, which generates wild-type Cas9 and rescues gene-editing functions, such as non-homologous end-joining (NHEJ) or homology-directed repair (HR). b) Activation of EGFP expression in a dual-reporter assay by Cas9 following irradiation, showed gene-editing levels similar to wild-type Cas9. c) Spatial control of Cas9 gene editing through patterned illumination through a mask. Adapted with permission from Ref. [81]. Copyright 2015 American Chemical Society.
Figure 16
Figure 16
a) Scheme depicting inactivation of VEGFR2 with a ruthenium-conjugated, bound peptoid. Binding of the peptoid to VEGFR2 followed by illumination results in localized generation of singlet-oxygen (1O2) species and inactivation of VEGFR2. b) Dose-dependent inhibition of VEGF-induced autophosphorylation of VEGFR2 following irradiation for 10 min. Adapted with permission from Ref. [95]. Copyright 2010 Nature Publishing Group.
Figure 17
Figure 17
a) Structures of genetically incorporated photoswitchable azobenzene amino acids. b) Genetic encoding of 23 enables bridge formation through proximity-induced reaction with a nearby cysteine residue. Illumination with green or blue light allows photoswitching between the cis/trans isomers and leads to significant conformational changes in the protein structure.
Figure 18
Figure 18
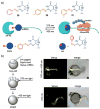
a) Reversible optical control of the zebrafish larvae fast escape response. b) Structure of a PORTL comprised of a glutamate ligand (green) connected to an azobenzene (red), a flexible PEG linker (blue), and a benzylguanine (orange). c) Scheme depicting the mechanism of PORTL-mediated reversible photocontrol of a SNAP-mGluR2 receptor using two different wavelengths of light. The ligand binding domain (LBD) binds to glutamate. d) Dual optical control of mGluR2 and LiGluR in HEK239T cells enables independent activation of receptors, as demonstrated by a whole-cell patch-clamp electrophysiology assay. Adapted with permission from Ref. [118] (Copyright 2015 American Chemical Society) and Ref. [117] (Copyright 2007 Elsevier Inc).
Figure 19
Figure 19
a) General scheme of photo-BOLT for reversible toggling of protein activity using light. Following incubation of target proteins with tetrazine-modified ligand, protein activity is inhibited. Due to the presence of a photoswitchable linker, illumination at 360 nm induces photoisomerization (cis state) and rescues protein activity. Additional illumination at 440 nm or thermal relaxation results in reversion back to the original state (trans state). b) Graphical representation of the sequential illuminations conducted in (c). c) HEK293T cells expressing wild-type MEK1 (E′–I′) or mutant MEK1 (EI) were incubated with the tetrazine-modified inhibitor to achieve state E (inactive MEK1). Illumination at 360 nm results in state F (active MEK1). Subsequent illumination at 440 nm achieves state G (inactive MEK1). Further illumination (360 nm) achieves state H (active MEK1). Finally, incubation for 3 h without illumination induces thermal relaxation to state I (inactive MEK1). d) Structures of the strained alkyne-modified UAA 24 and the azobenzene-tetrazine-modified MEK1 inhibitor 25. Adapted with permission from Ref. [120]. Copyright 2015 Nature Publishing Group.
Figure 20
Figure 20
a) Schematic representation of the kinase activity profiling technique using a photoactivated peptide biosensor and single-cell capillary electrophoresis. b) The native substrate is modified with a nitrobenzyl caging group to generate the photocaged substrate 26, which upon illumination is decaged to 27 and subsequently phosphorylated to 28 by Akt. c) Single-cell Akt activity measured by CE, with the peaks 2628 corresponding to structures 2628. STND =standard solution of peptides, Basal =serum starved PANC-1 cells, TNF-α=cells stimulated with TNF-α. Proteolytic products of 26 are labeled as i–viii. Adapted with permission from Ref. [124]. Copyright 2016 Wiley-VCH.
Figure 21
Figure 21
Approaches to the regulation of oligonucleotide hybridization using light-cleavable groups. a) An oligonucleotide sequence containing a photocleavable linker is able to bind its target sequence, inhibiting activity, until light-induced cleavage. b) Hairpin formation of a short inhibitory strand mediated by a photocleavable linker blocks oligonucleotide function until irradiation. c) Formation of a cyclic oligonucleotide via a photocleavable linker inhibits function due to induced curvature until light exposure. d) Caged nucleobases inhibit oligonucleotide function until photo-deprotection. e) Deprotection of caged nucleobases results in hairpin formation, which inhibits oligonucleotide activity. Adapted with permission from Ref. [1f]. Copyright 2013 American Chemical Society.
Figure 22
Figure 22
a) Structures of vitamin E (purple) and the photocleavable linker (red). b) siRNA duplexes targeting GFP were modified at the 5′ terminus on the sense (blue) strand with a photocleavable linker and a vitamin E moiety. This modification blocks loading into RISC until irradiation with UV light. c) Spatial control was demonstrated in HEK293T cells using an EGFP reporter. Adapted with permission from Ref. [156]. Copyright 2016 Wiley-VCH.
Figure 23
Figure 23
a) Sequential activation of cMOs targeting the genes flh (purple) or spt (blue). Structures of the NB (red) and DEACM (orange) caging groups are shown. b) Representative images of myod1 expression patterns from control (wildtype), flh knockdown (aberrant expression), and spt knockdown (no expression) phenotypes after irradiation. c) Quantification of phenotypes is shown for embryos injected with the cMOs and irradiation conditions denoted in the graphs. Adapted with permission from Ref. [48]. Copyright 2014 Wiley-VCH.
Figure 24
Figure 24
a) Control of both Watson–Crick base pairing and Hoogsteen base pairing through photolysis of nucleobase-caged thymidines. b) Optical activation of a triplex-forming oligonucleotide (TFO; yellow) through nucleobase decaging and resulting DNA triplex formation through Hoogsteen base pairing. The TFO blocks binding of the transcription factor (brown) to the promoter region (blue/green), thereby inhibiting gene expression. Photoactivation of the caged TFO led to reduction in luminescence similar to a non-caged TFO. c) Optical activation of a DNA decoy through light-induced dumbbell formation, leading to sequestration of the transcription factor targeting the decoy promoter region and inhibition of gene expression. UV irradiation of the caged DNA decoy led to a decrease in luciferase activity similar to that of a non-caged decoy. Adapted with permission from Ref. [150c] (Copyright 2012 American Chemical Society) and Ref. [150d] (Copyright 2011 American Chemical Society).
Figure 25
Figure 25
a) Optical control of transcription using a caged promoter. EGFP is only expressed following removal of the nitrobenzyl caging group (red) upon irradiation with UV light. Three caged thymidine residues (underlined) were incorporated into the TATA box sequence (blue) of the CMV promoter. b) Optical activation of EGFP expression in zebrafish embryos. Following injection of the caged plasmid at the one-cell stage, embryos were either irradiated with 365 nm light or left in the dark. EGFP fluorescence and brightfield (BF)-merge micrographs are shown. Adapted with permission from Ref. [176]. Copyright 2014 American Chemical Society.
Figure 26
Figure 26
a) Light-activated site-directed RNA editing. Irradiation with UV light removes the photolabile group (red), exposing the benzylguanine moiety (purple) for conjugation to the SNAP-ADAR1 protein. Once the RNA–protein conjugate forms, site-specific editing is performed. b) The RNA–protein conjugate activates EGFP fluorescence in worms only after UV irradiation. RNA sequencing indicated an increase in editing yield from 10% to 60% after irradiation as shown in the chromatogram. Adapted with permission from Ref. [178]. Copyright 2015 American Chemical Society.
Figure 27
Figure 27
a) Structure of the photocaged backbone for optical control of gRNA function and gene editing. b) Caged complementary ssDNA protectors hybridize to the gRNA to prevent binding to the DNA target. Following UV irradiation, the photolabile groups are removed from the protector, which allows subsequent Cas9 cleavage. c) Percentage of non-cleaved DNA targeted in vitro by a corresponding gRNA. Irradiation with UV light results in simultaneous Cas9-mediated DNA cleavage. Adapted with permission from Ref. [85]. Copyright 2016 Wiley-VCH.
Figure 28
Figure 28
a) Schematic showing optical control of the TIVA-tag for single-cell transcriptome analysis. b) Decaging of the TIVA-tag in single cells in live hippocampal slices from mice. Neuron ii was irradiated, leading to activation of the TIVA-tag in a single cell but not in adjacent cells. The fluorescence signal of Cy5 at 647–704 nm generated from exciting Cy3 at 514 nm was recorded in the two neurons outlined by dotted white lines and labeled “i” and “ii”. Adapted with permission from Ref. [203]. Copyright 2014 Nature Publishing Group.
Figure 29
Figure 29
a) Structures of caging groups used for two-photon-triggered decaging of DNA. DEACM (yellow box) and ANBP (red box) were incorporated into DNA1 and DNA2, respectively. b) Caging groups prevent DNA duplex formation until irradiation and subsequent toehold-mediated displacement of a quencher-modified strand. c) Schematic of decaging strategies and their expected DNA duplex outcomes for the demonstration of spatial control. d) Images of the irradiated area of the hydrogel after decaging. The ATTO 565 channel is shown in blue and the ATTO Rho14 channel in pink. Selective activation of either DNA1 or DNA2 results in the images on the left and center, respectively. The picture on the right is an overlay of the other two images. Adapted with permission from Ref. [205]. Copyright 2016 Wiley-VCH.
Figure 30
Figure 30
a) Structures of the 2-phenylazo caps 29, 30, and 31 are shown with the nucleobase in blue and the photoswitchable groups in red. In the trans form, the 2-phenylazo caps inhibit binding of elF4E and translation; however, upon photoisomerization (370 nm) to the cis form, elF4E can bind and initiate protein expression. b) mRNAs capped with 31 were injected into zebrafish embryos at the one-cell stage and irradiated at the 8-cell and shield stages with 370 nm or 430 nm light, respectively. After photoswitching, development of a second midline with head structures was observed. Adapted with permission from Ref. [213]. Copyright 2017 American Chemical Society.
Figure 31
Figure 31
a) The vitamin B12 core structure with the photocleavable group as R1 and the antenna/fluorophore as R2. b) The dialkoxyanthracene reacts with singlet oxygen to form an endoperoxide intermediate that rapidly fragments into an anthraquinone, thereby releasing R3 and R4 as alcohols. Adapted with permission from Ref. [218] (Copyright 2015 American Chemical Society) and Ref. [222] (Copyright 2011 American Chemical Society).
Figure 32
Figure 32
Structures of the caging groups 32 and 33. Examples of caged molecules include cyclic-AMP (R1) and γ-aminobutyric acid (R2).

References

    1. Brieke C, Rohrbach F, Gottschalk A, Mayer G, Heckel A. Angew Chem Int Ed. 2012;51:8446–8476. - PubMed
    2. Angew Chem. 2012;124:8572–8604.
    3. Mayer G, Heckel A. Angew Chem Int Ed. 2006;45:4900–4921. - PubMed
    4. Angew Chem. 2006;118:5020–5042.
    5. Lee HM, Larson DR, Lawrence DS. ACS Chem Biol. 2009;4:409–427. - PMC - PubMed
    6. Gautier A, Gauron C, Volovitch M, Bensimon D, Jullien L, Vriz S. Nat Chem Biol. 2014;10:533–541. - PubMed
    7. Klán P, Šolomek T, Bochet CG, Blanc A, Givens R, Rubina M, Popik V, Kostikov A, Wirz J. Chem Rev. 2013;113:119–191. - PMC - PubMed
    8. Liu Q, Deiters A. Acc Chem Res. 2014;47:45. - PMC - PubMed
    9. Mart RJ, Allemann RK. Chem Commun. 2016;52:12262–12277. - PubMed
    10. Ouyang X, Chen JK. Chem Biol. 2010;17:590–606. - PMC - PubMed
    1. Niu J, Johny MB, Dick IE, Inoue T. Biophys J. 2016;111:1132–1140. - PMC - PubMed
    2. Zhang K, Cui B. Trends Biotechnol. 2015;33:92–100. - PMC - PubMed
    3. Deisseroth K. Nat Neurosci. 2015;18:1213–1225. - PMC - PubMed
    4. Weitzman M, Hahn KM. Curr Opin Cell Biol. 2014;30:112–120. - PMC - PubMed
    5. Pathak GP, Vrana JD, Tucker CL. Biol Cell. 2013;105:59–72. - PMC - PubMed
    6. Repina N, Rosenbloom A, Mukherjee A, Schaffer DV, Kane RS. Annu Rev Chem Biomol Eg. 2017;8(1):13–39. - PMC - PubMed
    1. Putyrski M, Schultz C. FEBS Lett. 2012;586:2097–2105. - PubMed
    2. Voss S, Klewer L, Wu YW. Curr Opin Chem Biol. 2015;28:194–201. - PubMed
    3. Fegan A, White B, Carlson JC, Wagner CR. Chem Rev. 2010;110:3315–3336. - PubMed
    4. DeRose R, Miyamoto T, Inoue T. Pflugers Archiv: Eur J Physiol. 2013;465:409–417. - PMC - PubMed
    1. Pecot MY, Malhotra V. Cell. 2004;116:99–107. - PubMed
    1. Zoncu R, Perera RM, Balkin DM, Pirruccello M, Toomre D, De Camilli P. Cell. 2009;136:1110–1121. - PMC - PubMed

Publication types

MeSH terms