. 2017 May 17;94(4):891-907.e6.
doi: 10.1016/j.neuron.2017.04.017.

Global Representations of Goal-Directed Behavior in Distinct Cell Types of Mouse Neocortex

Affiliations

Global Representations of Goal-Directed Behavior in Distinct Cell Types of Mouse Neocortex

William E Allen et al. Neuron. .

Abstract

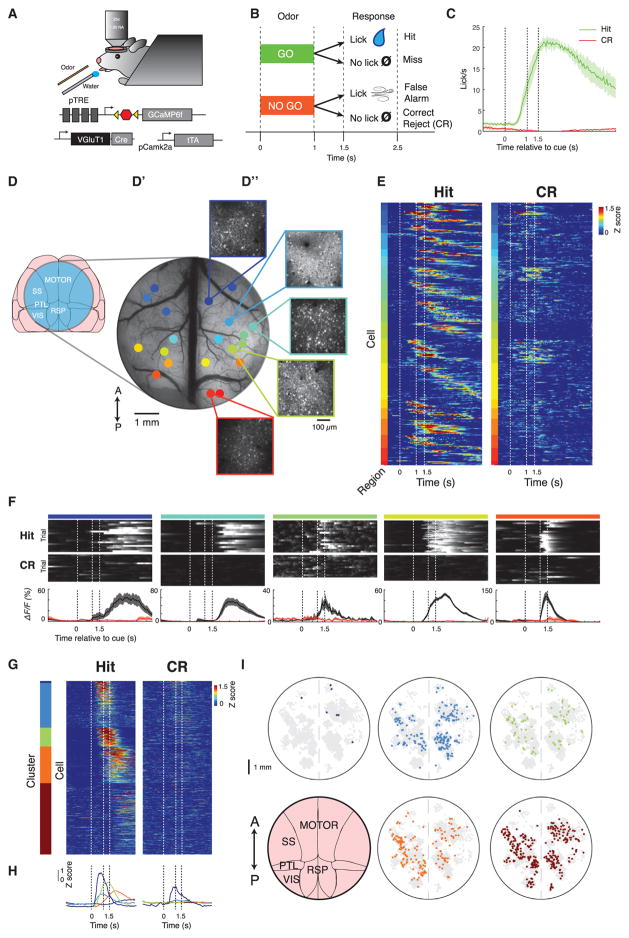
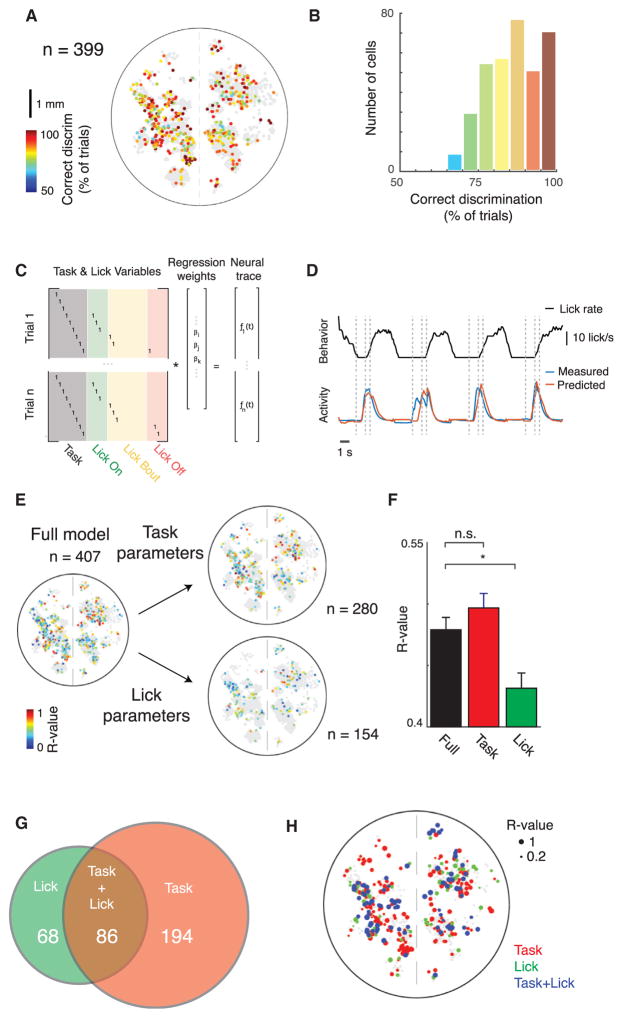
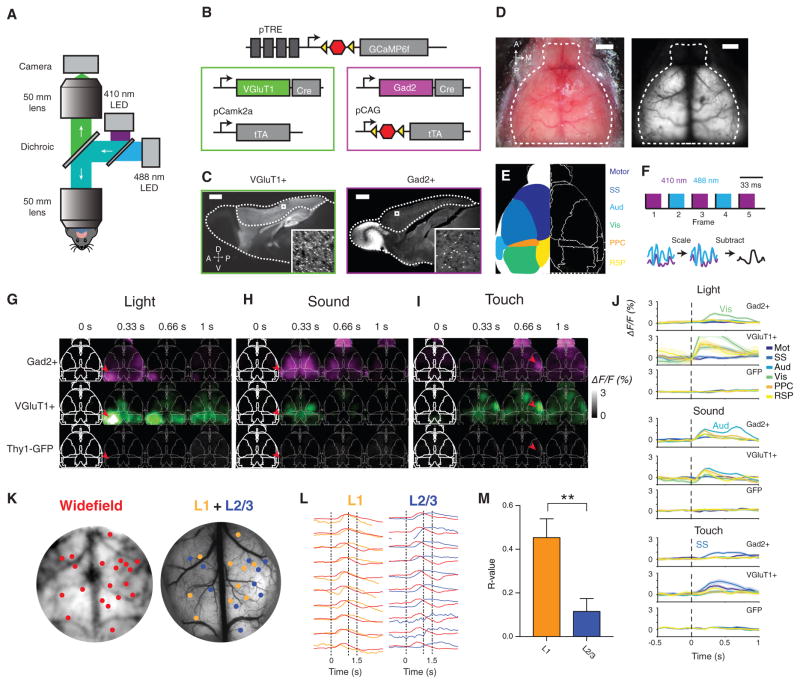
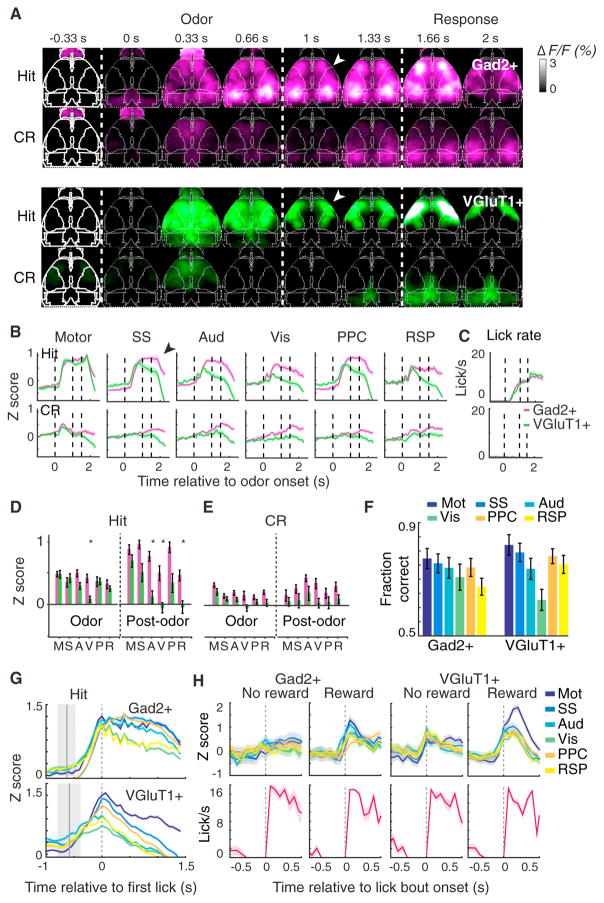
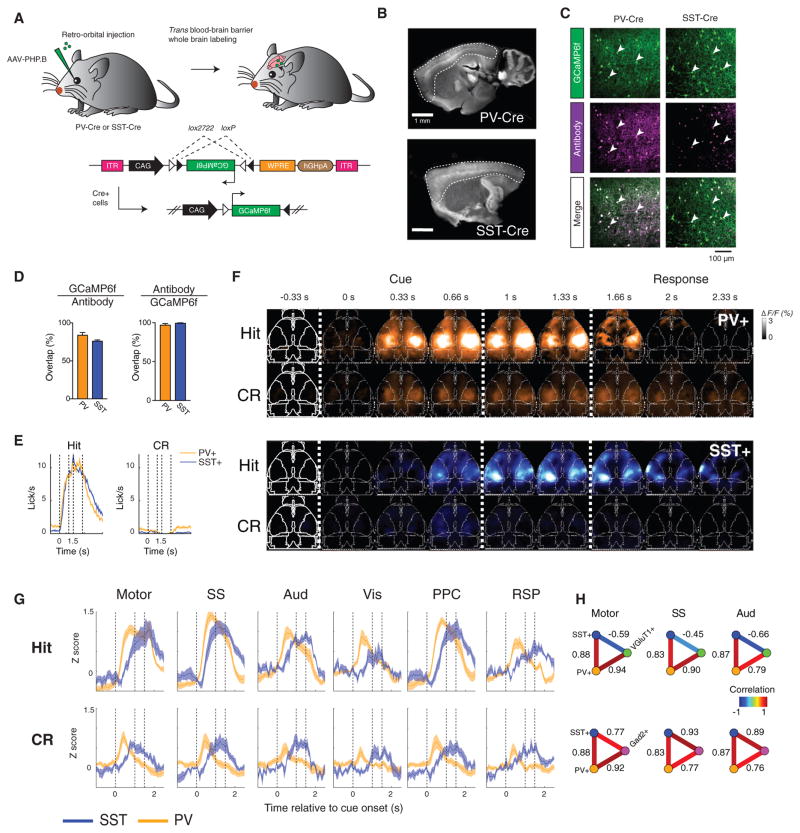
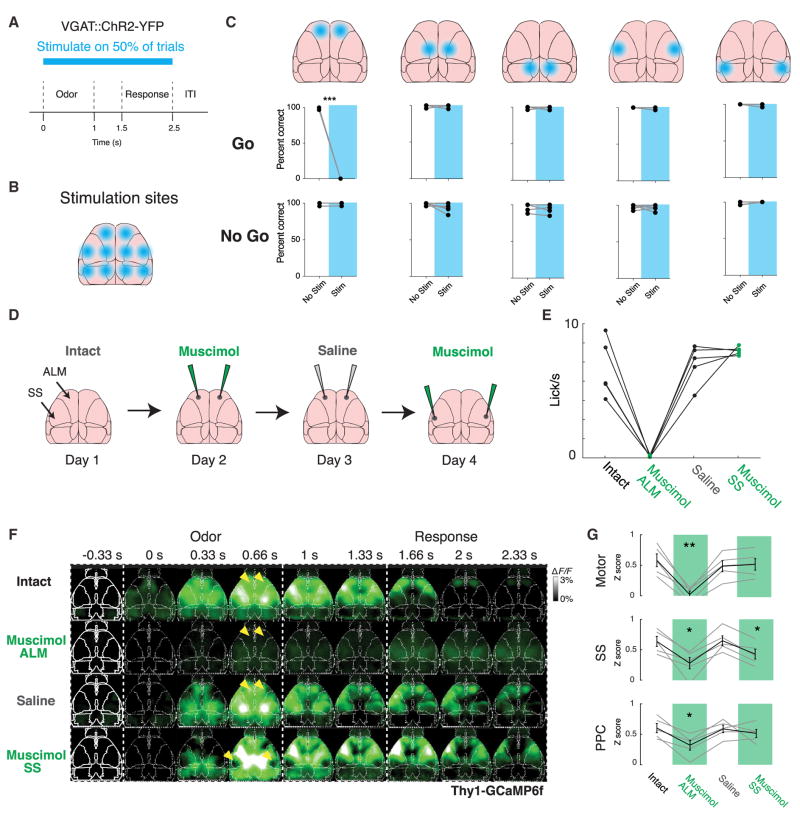
The successful planning and execution of adaptive behaviors in mammals may require long-range coordination of neural networks throughout cerebral cortex. The neuronal implementation of signals that could orchestrate cortex-wide activity remains unclear. Here, we develop and apply methods for cortex-wide Ca2+ imaging in mice performing decision-making behavior and identify a global cortical representation of task engagement encoded in the activity dynamics of both single cells and superficial neuropil distributed across the majority of dorsal cortex. The activity of multiple molecularly defined cell types was found to reflect this representation with type-specific dynamics. Focal optogenetic inhibition tiled across cortex revealed a crucial role for frontal cortex in triggering this cortex-wide phenomenon; local inhibition of this region blocked both the cortex-wide response to task-initiating cues and the voluntary behavior. These findings reveal cell-type-specific processes in cortex for globally representing goal-directed behavior and identify a major cortical node that gates the global broadcast of task-related information.

Keywords: calcium imaging; cell type; cortex; goal-directed behavior; optogenetics; widefield.


Figures

Figure 1
Figure 1. Distributed Cellular Representation of Goal-Directed Behavior
(A) Diagram of two-photon imaging and behavioral setup and triple-transgenic strategy for tTA-amplified expression of GCaMP6f in VGluT1+ excitatory neurons throughout the brain. (B) Diagram of olfactory discrimination task structure. Odor is delivered for 1 s, followed by 0.5 s of no stimulus, then a 1 s response window. (C) Average licking behavior during task performance across n = 4 mice on hit (green) and correct reject (CR) (red) trials. (D) Surgical preparation to record single-cell activity from across cortex. (D′) Wide-field fluorescent image through a 7 mm window that is used to expose the dorsal cortex for two-photon imaging. Different colored dots represent different fields of view acquired sequentially in different sessions (~30 trials/session). (D″) Insets show the maximum projection of fluorescence from single fields of view in layer 2/3 within the window, acquired with two-photon microscopy. (E) The average, Z-scored activity of single task-modulated neurons throughout multiple fields of view in a single mouse, ordered first according to anterior/posterior position of the field of view, then according to peak timing within each field of view. Dashed lines indicate trial events. (F) Examples of single neurons in fields of view ordered from anterior to posterior exhibiting reliable task-related activity on go trials. Top two rows: fluorescence of each neuron on single hit or CR trials (using scale from bottom row). Scale is same as bottom row from black to white. Bottom row: average fluorescence across hit (black) or CR (red) trials. Dashed lines indicate trial events. Mean ± SEM. (G) Unsupervised clustering of average single-cell activity throughout cortex: average Z-scored fluorescence from n = 731 task-modulated neurons, combining cells from n = 4 animals, clustered into five groups. (H) Average traces of each cluster in (G) on hit and CR, color-coded according to cluster identity. (I) Spatial distribution throughout cortex of cells with different activity profiles: the spatial location of cells from all sessions, co-registered into a common reference space and colored according to cluster identity given the clustering in (G). Spots that are gray are cells not in that cluster.
Figure 2
Figure 2. Widespread Single-Trial Encoding of Behavioral Choice throughout Neocortex
(A) Decoding of trial type on a trial-by-trial basis: spatial distribution of single cells (n = 399) colored according to the percentage correctly distinguished single trials, as determined using ROC analysis. Non-gray cells can distinguish trial types significantly better than chance (p < 0.05, permutation test with chance level determined by shuf-fling trial labels). (B) Histogram of data in (A). (C) Structure of a generalized linear model (GLM) for separating task- and lick-related elements of neural activity. Task variables are consistent across multiple trials, whereas lick variables vary on a trial-by-trial basis. (D) Example behavior trace (licking) and measured and GLM-predicted neural activity traces for example cell, on held out test data of four trials. Dashed lines indicated task events. (E) Correlation of predicted and measured activity for single cells across cortex on held out test data, predicted using either the full model or just lick or task parameters in the model. n = 407 cells were significantly predicted with the full model, n = 280 with the task parameters, and n = 154 with the lick parameters. Only cells with statistically significant predictions are shown on a background of gray non-statistically significant cells (p < 0.05, permutation test). (F) Average correlation coefficients for predictions using either the full model parameters, or just the licking- or task-related parameters. Same cells as in (E). *p < 0.05, Wilcoxon rank-sum test. Mean ± SEM. (G) Venn diagram of task- and lick-correlated cells in (E). (H) Locations of cells throughout cortex colored by whether they are significantly predictive using the task, licking, or both task and licking parameters, with the size of each dot scaled according to the correlation between predicted and measured fluorescence using the full parameter set.
Figure 3
Figure 3. Cell-Type-Specific Synchronous Cortex-wide Imaging of Neural Activity
(A) Macroscope schematic for whole-cortex wide-field imaging. (B) Diagram of genetic strategy for expression of GCaMP6f in all inhibitory or excitatory neurons. (C) GCaMP6f expression in VGluT1+ and Gad2+ brains, with cortex outlined. Inset: individual VGluT1+ and Gad2+ neurons expressing GCaMP6f. (D) Left: bright-field image of mouse skull with clear cap. Right: transcranial fluorescence of excitatory neurons. (E) Diagram of cortical regions overlaid on atlas. (F) Blood-volume autofluorescence subtraction process. Top: schematic of alternating illumination sequence. Bottom: schematic of per-pixel blood fluorescence normalization scheme. (G–I) Normalized fluorescence response of VGluT1+, Gad2+, and control mice to sensory stimuli, averaged across more than ten trials for a single mouse. Time points indicate end of integration window. (G) Flashing LED delivered to right eye for 0.5 s. Arrowhead indicates primary visual cortex. (H) Fifteen kilohertz auditory tone stimulation, delivered for 0.5 s. Arrowhead indicates primary auditory cortex. (I) Vibrating touch stimulus delivered to left whiskers for 0.5 s. Arrowhead indicates primary somatosensory cortex. (J) Regional time series corresponding to (G), (H), and (I) in a VGluT1+, Gad2+, and GFP mouse, averaged across 30 stimulus presentations. For each stimulus, the indicated corresponding primary sensory region has the largest response. Error bars, SEM. (K) Co-registration of average wide-field fluorescence and wide-field two-photon calibration image, allowing for the direct comparison of wide-field and two-photon signals from the same location in cortex. Orange dots indicate fields of view acquired at layer 1 (0–150 μm below the surface), and blue dots indicate fields of view acquired at layer 2/3 (150–350 μm below the surface). (L) Overlaid average, maximum-normalized traces from several representative regions acquired via wide-field (red) and the summed full-frame fluorescence from two-photon microscopy (neuropil + soma) in L1 and L2/3. Dashed lines indicate task events. (M) Average correlation between L1 and wide-field and between L2/3 and wide-field signals at equivalent locations. n = 21 L1 fields of view (FOVs), n = 62 L2/3 FOVs, from n = 3 mice. **p < 0.01, Wilcoxon rank-sum test. Error bars, SEM.
Figure 4
Figure 4. Inhibitory and Excitatory Neural Dynamics Reflect Task Engagement
(A) Example video sequence of average fluorescence across hit and correct reject (CR) trials in a Gad2+ and VGluT1+ mouse. White arrowheads indicate fronto-parietal bias of VGluT1+ activity relative to the widespread Gad2+ activation following odor cue period. (B) Average traces from six cortical regions on hit and correct reject (CR), averaged across mice for 9 Gad2+ and 12 VGluT1+ mice. (Means of 62 hit and 53 CR trials per mouse for VGluT1+ and 57 hit and 51 CR trials for Gad2+.) Error bars denote SEM. Black arrowhead indicates divergence between Gad2+ and VGluT1+ activity following the cue period in all regions except for motor cortex. (C) Average lick rate on hit and CR trials averaged across mice for 9 Gad2+ and 12 VGluT1+ mice. Error bars denote SEM. (D) Average values from (B) during 1 s odor delivery period or 0.5 s post-odor period during Hit trial, across n = 9 Gad2+ and 12 VGluT1+ mice. *p < 0.05, Wilcoxon rank-sum test, Bonferroni corrected. (E) Same as (D), but for CR trial. (F) ROC analysis of single-trial hit versus CR trial-type decoding across different cortical areas in Gad2+ and VGluT1+ mice. (G) Timing of neural activity relative to behavioral onset in hit trials. The same data as in (B), aligned to the time of first lick and with different brain areas overlaid on the same scale. Gray region represents distribution of cue onset time relative to first lick. (H) Un-cued task in which mice were rewarded only during a specific time window, while engaging in spontaneous bouts of licking. Top: overlaid traces of all seven cortical regions, aligned to beginning of lick bout, n = 2 Gad2+ and 3 VGluT1+, with 32, 49, 19, and 29 pooled trials from left to right. Bottom: corresponding aligned lick rate. All values in (F–H) and (J) are mean ± SEM across mice and across pooled trials in (J). A, Aud, auditory; M, motor; p, PPC, posterior parietal; R, RSP, retrosplenial; S, SS, somatosensory; V, Vis, visual.
Figure 5
Figure 5. Cell-Type-Specific Activity Dynamics in PV+ and SST+ Interneurons
(A) Diagram of strategy for whole-brain expression of GCaMP6f in all SST+ or PV+ interneurons via systemic viral infection. (B) Wide-field image of GCaMP6f expression in SST-Cre and PV-Cre brains, with cortex outlined (stained with anti-GFP). (C) GCaMP6f expression (stained with anti-GFP) in a PV-Cre or SST-Cre mouse, and co-staining with PV or SST antibody. White arrowheads indicate cells co-expressing GCaMP6f and PV or SST. (D) Overlap between GCaMP and PV or SST staining to quantify the efficiency (GCaMP6f/antibody) and specificity (antibody/GCaMP6f) of viral targeting, from n = 3 mice per condition and three fields of view per mouse. Mean ± SEM. (E) Average licking behavior on hit and CR trials across n = 5 SST-Cre and n = 7 PV-Cre mice performing the olfactory go/no-go task, mean ± SEM. (F) Example video sequence of average fluorescence across hit and correct reject (CR) trials, in a representative PV-Cre and SST-Cre mouse. (G) Average traces from six cortical regions on hit and correct reject (CR) trials, averaged across mice for n = 5 SST-Cre and 7 PV-Cre mice. Error bars, SEM. (H) Partial correlations between PV+, SST+ and VGluT1+ or Gad2+ signals to show cell-type-specific correlations to inhibitory or excitatory activity. Positive correlation between PV+ and SST+ average traces in all brain regions (Pearson linear correlation coefficient, p < 5 × 10⁻⁵); linear partial correlation between PV+ and VGluT1+ or Gad2+ while controlling for the correlation shared with SST+, and between SST+ and VGluT1+ or Gad2+ while controlling for correlation shared with PV+ (p < 5 × 10⁻⁵ across all brain regions, positive for PV+: VGluT1+, PV+: Gad2+, and SST+: Gad2+, and negative for SST+: VGluT1+).
Figure 6
Figure 6. Premotor Cortex Activity Is Necessary for Widespread Cortical Activation
(A) Diagram of paradigm of cortical inhibition using VGAT::ChR2-YFP stimulation through a clear skull cap. Mice were stimulated randomly on 50% of trials during the odor through response epochs of the task. (B) Diagram of bilateral sites for cortical inhibition tiling the skull. (C) Results of bilateral optogenetic inhibition in five regions tiling the skulls of n = 5 VGAT::ChR2-YFP mice, separately on go and no-go trials. Correct go trials, hit; correct no-go, correct reject. ***p < 0.001, paired t test, Benajmini-Hochberg corrected. (D) Diagram of ALM (premotor lick cortex) silencing experiment to determine its role in the production of global cortical activity. Well-trained Thy1-GCaMP6f mice are imaged while performing the olfactory go/no-go task on subsequent days with no injection, bilateral injection of muscimol into ALM, bilateral injection of saline into ALM, and bilateral injection of muscimol into somatosensory (barrel) cortex. (E) Average licking behavior on go trials (during 1 s after cue) in intact mice and after muscimol injection into ALM, saline injection into ALM, and muscimol injection into barrel cortex. Each dot per day represents an animal (n = 5). (F) Example video sequences of average fluorescence during go trials after each injection. Arrowheads in first three rows indicate ALM; arrowhead in last row indicates barrel cortex. (G) Average Z-scored fluorescence during 2 s spanning odor through response period in three cortical regions. Mean ± SEM in black, individual mice in gray, across n = 5 mice. **p < 0.01, *p < 0.05, one-sided paired t test with baseline day, Benjamini-Hochberg corrected.

References

    1. Ahrens MB, Orger MB, Robson DN, Li JM, Keller PJ. Whole-brain functional imaging at cellular resolution using light-sheet microscopy. Nat Methods. 2013;10:413–420. - PubMed
    1. Akemann W, Mutoh H, Perron A, Park YK, Iwamoto Y, Knöpfel T. Imaging neural circuit dynamics with a voltage-sensitive fluorescent protein. J Neurophysiol. 2012;108:2323–2337. - PubMed
    1. Aravanis AM, Wang LP, Zhang F, Meltzer LA, Mogri MZ, Schneider MB, Deisseroth K. An optical neural interface: in vivo control of rodent motor cortex with integrated fiberoptic and optogenetic technology. J Neural Eng. 2007;4:S143–S156. - PubMed
    1. Bressler SL, Coppola R, Nakamura R. Episodic multiregional cortical coherence at multiple frequencies during visual task performance. Nature. 1993;366:153–156. - PubMed
    1. Buschman TJ, Miller EK. Top-down versus bottom-up control of attention in the prefrontal and posterior parietal cortices. Science. 2007;315:1860–1862. - PubMed