SGPL1 (sphingosine phosphate lyase 1) modulates neuronal autophagy via phosphatidylethanolamine production
- PMID: 28521611
- PMCID: PMC5446076
- DOI: 10.1080/15548627.2017.1291471
SGPL1 (sphingosine phosphate lyase 1) modulates neuronal autophagy via phosphatidylethanolamine production
Abstract
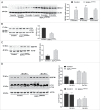
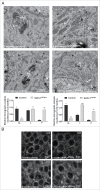
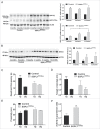
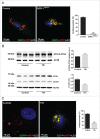
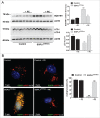
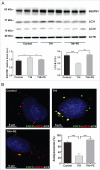
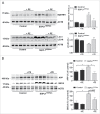
Macroautophagy/autophagy defects have been identified as critical factors underlying the pathogenesis of neurodegenerative diseases. The roles of the bioactive signaling lipid sphingosine-1-phosphate (S1P) and its catabolic enzyme SGPL1/SPL (sphingosine phosphate lyase 1) in autophagy are increasingly recognized. Here we provide in vitro and in vivo evidence for a previously unidentified route through which SGPL1 modulates autophagy in neurons. SGPL1 cleaves S1P into ethanolamine phosphate, which is directed toward the synthesis of phosphatidylethanolamine (PE) that anchors LC3-I to phagophore membranes in the form of LC3-II. In the brains of SGPL1fl/fl/Nes mice with developmental neural specific SGPL1 ablation, we observed significantly reduced PE levels. Accordingly, alterations in basal and stimulated autophagy involving decreased conversion of LC3-I to LC3-II and increased BECN1/Beclin-1 and SQSTM1/p62 levels were apparent. Alterations were also noticed in downstream events of the autophagic-lysosomal pathway such as increased levels of lysosomal markers and aggregate-prone proteins such as APP (amyloid β [A4] precursor protein) and SNCA/α-synuclein. In vivo profound deficits in cognitive skills were observed. Genetic and pharmacological inhibition of SGPL1 in cultured neurons promoted these alterations, whereas addition of PE was sufficient to restore LC3-I to LC3-II conversion, and control levels of SQSTM1, APP and SNCA. Electron and immunofluorescence microscopy showed accumulation of unclosed phagophore-like structures, reduction of autolysosomes and altered distribution of LC3 in SGPL1fl/fl/Nes brains. Experiments using EGFP-mRFP-LC3 provided further support for blockage of the autophagic flux at initiation stages upon SGPL1 deficiency due to PE paucity. These results emphasize a formerly overlooked direct role of SGPL1 in neuronal autophagy and assume significance in the context that autophagy modulators hold an enormous therapeutic potential in the treatment of neurodegenerative diseases.
Keywords: amyloid precursor protein; autophagy; lysosomes; neuropathology; phosphatidylethanolamine; sphingosine-1-phosphate lyase; α-synuclein/SNCA.
Figures


Similar articles
-
Neural sphingosine 1-phosphate accumulation activates microglia and links impaired autophagy and inflammation.Glia. 2019 Oct;67(10):1859-1872. doi: 10.1002/glia.23663. Epub 2019 Jun 24. Glia. 2019. PMID: 31231866
-
Neurodegeneration Caused by S1P-Lyase Deficiency Involves Calcium-Dependent Tau Pathology and Abnormal Histone Acetylation.Cells. 2020 Sep 28;9(10):2189. doi: 10.3390/cells9102189. Cells. 2020. PMID: 32998447 Free PMC article.
-
S1P Released by SGPL1-Deficient Astrocytes Enhances Astrocytic ATP Production via S1PR2,4, Thus Keeping Autophagy in Check: Potential Consequences for Brain Health.Int J Mol Sci. 2023 Feb 26;24(5):4581. doi: 10.3390/ijms24054581. Int J Mol Sci. 2023. PMID: 36902011 Free PMC article.
-
Sphingosine-1-phosphate: boon and bane for the brain.Cell Physiol Biochem. 2014;34(1):148-57. doi: 10.1159/000362991. Epub 2014 Jun 16. Cell Physiol Biochem. 2014. PMID: 24977488 Review.
-
Sphingosine phosphate lyase insufficiency syndrome (SPLIS): A novel inborn error of sphingolipid metabolism.Adv Biol Regul. 2019 Jan;71:128-140. doi: 10.1016/j.jbior.2018.09.004. Epub 2018 Sep 25. Adv Biol Regul. 2019. PMID: 30274713 Free PMC article. Review.
Cited by
-
SGPL1 stimulates VPS39 recruitment to the mitochondria in MICU1 deficient cells.Mol Metab. 2022 Jul;61:101503. doi: 10.1016/j.molmet.2022.101503. Epub 2022 Apr 19. Mol Metab. 2022. PMID: 35452878 Free PMC article.
-
The Role of Ceramide and Sphingosine-1-Phosphate in Alzheimer's Disease and Other Neurodegenerative Disorders.Mol Neurobiol. 2019 Aug;56(8):5436-5455. doi: 10.1007/s12035-018-1448-3. Epub 2019 Jan 5. Mol Neurobiol. 2019. PMID: 30612333 Free PMC article. Review.
-
Role of sphingolipid metabolism in neurodegeneration.J Neurochem. 2021 Jul;158(1):25-35. doi: 10.1111/jnc.15044. Epub 2020 Jul 3. J Neurochem. 2021. PMID: 32402091 Free PMC article. Review.
-
Genotype/Phenotype Interactions and First Steps Toward Targeted Therapy for Sphingosine Phosphate Lyase Insufficiency Syndrome.Cell Biochem Biophys. 2021 Sep;79(3):547-559. doi: 10.1007/s12013-021-01013-9. Epub 2021 Jun 16. Cell Biochem Biophys. 2021. PMID: 34133011 Review.
-
Enhancing Therapeutic Efficacy in Cancer Treatment: Integrating Nanomedicine with Autophagy Inhibition Strategies.ACS Omega. 2024 Jun 18;9(26):27832-27852. doi: 10.1021/acsomega.4c02234. eCollection 2024 Jul 2. ACS Omega. 2024. PMID: 38973850 Free PMC article. Review.
References
-
- Nixon RA. The role of autophagy in neurodegenerative disease. Nat Med 2013; 19:983-97; PMID:23921753; http://dx.doi.org/10.1038/nm.3232 - DOI - PubMed
-
- Komatsu M, Waguri S, Chiba T, Murata S, Iwata J, Tanida I, Ueno T, Koike M, Uchiyama Y, Kominami E, et al.. Loss of autophagy in the central nervous system causes neurodegeneration in mice. Nature 2006; 441:880-4; PMID:16625205; http://dx.doi.org/10.1038/nature04723 - DOI - PubMed
-
- Hara T, Nakamura K, Matsui M, Yamamoto A, Nakahara Y, Suzuki-Migishima R, Yokoyama M, Mishima K, Saito I, Okano H, et al.. Suppression of basal autophagy in neural cells causes neurodegenerative disease in mice. Nature 2006; 441:885-9; PMID:16625204; http://dx.doi.org/10.1038/nature04724 - DOI - PubMed
-
- Menzies FM, Fleming A, Rubinsztein DC. Compromised autophagy and neurodegenerative diseases. Nat Rev Neurosci 2015; 16:345-57; PMID:25991442; http://dx.doi.org/10.1038/nrn3961 - DOI - PubMed
-
- Hannun YA, Obeid LM. Principles of bioactive lipid signalling: lessons from sphingolipids. Nat Rev Mol Cell Biol 2008; 9:139-50; PMID:18216770; http://dx.doi.org/10.1038/nrm2329 - DOI - PubMed
MeSH terms
Substances
Grants and funding
LinkOut - more resources
Full Text Sources
Other Literature Sources
Molecular Biology Databases
Miscellaneous
