. 2017 May 4;13(5):868-884.
doi: 10.1080/15548627.2017.1291470.

The peroxisomal AAA ATPase complex prevents pexophagy and development of peroxisome biogenesis disorders

Affiliations

The peroxisomal AAA ATPase complex prevents pexophagy and development of peroxisome biogenesis disorders

Kelsey B Law et al. Autophagy. .

Abstract

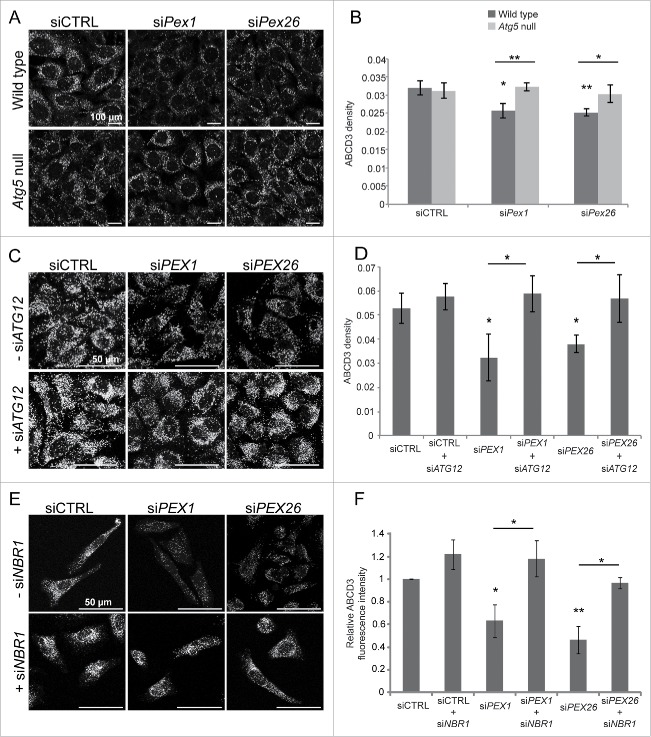
Peroxisome biogenesis disorders (PBDs) are metabolic disorders caused by the loss of peroxisomes. The majority of PBDs result from mutation in one of 3 genes that encode for the peroxisomal AAA ATPase complex (AAA-complex) required for cycling PEX5 for peroxisomal matrix protein import. Mutations in these genes are thought to result in a defect in peroxisome assembly by preventing the import of matrix proteins. However, we show here that loss of the AAA-complex does not prevent matrix protein import, but instead causes an upregulation of peroxisome degradation by macroautophagy, or pexophagy. The loss of AAA-complex function in cells results in the accumulation of ubiquitinated PEX5 on the peroxisomal membrane that signals pexophagy. Inhibiting autophagy by genetic or pharmacological approaches rescues peroxisome number, protein import and function. Our findings suggest that the peroxisomal AAA-complex is required for peroxisome quality control, whereas its absence results in the selective degradation of the peroxisome. Thus the loss of peroxisomes in PBD patients with mutations in their peroxisomal AAA-complex is a result of increased pexophagy. Our study also provides a framework for the development of novel therapeutic treatments for PBDs.

Keywords: AAA ATPase complex; PEX1; PEX26; PEX5; Zellweger spectrum disorder; autophagy; peroxisome biogenesis disorder; peroxisomes; pexophagy; selective autophagy.


Figures

Figure 1.
Figure 1.
Depletion of AAA-complex components result in the loss of peroxisomes. (A) Representative fluorescence images of HeLa cells transfected with nontargeting siRNA (siCTRL), and siRNA against PEX14 (siPEX14), PEX1 (siPEX1), and PEX26 (siPEX26) as indicated. Cells were fixed and immunostained for ABCD3 48 h post-transfection. Scale bars: 50 μm. (B) Graph of the ABCD3 density (number of ABCD3 puncta per volume of each cell [number/μm3]), of at least 30 cells per trial (n = 3) ± standard deviation in (A). Asterisks represent p-values compared with siCTRL: *p < 0.05. (C) Total cell lysates were prepared from siRNA-treated HeLa cells (as in A) and immunoblotted (IB) with the indicated antibodies.
Figure 2.
Figure 2.
Pexophagy mediates the loss of peroxisomes in AAA-complex-depleted cells. (A) Representative fluorescence images of wild-type and Atg5 null MEFs transfected with either nontargeting siRNA (siCTRL), siRNA against Pex1 (siPex1) or Pex26 (siPex26) as indicated, and immunostained for endogenous ABCD3. Scale bars: 100 μm. (B) Graph of the average ABCD3 density per cell (number/μm3) of at least 30 cells per trial (n = 3) ± standard deviation in (A). Asterisks represent p-values compared with siCTRL unless otherwise indicated: *p < 0.05, **p < 0.01. (C) Representative fluorescence images of HeLa cells transfected with nontargeting siRNA (siCTRL), siRNA against PEX1 (siPEX1), and PEX26 (siPEX26), with or without siRNA against ATG12 (siATG12) as indicated and immunostained for ABCD3. Scale bars: 50 μm. (D) Graph of the average ABCD3 density per cell of at least 30 cells per trial (n = 3) ± standard deviation in (C). Asterisks represent p-values compared with siCTRL unless otherwise indicated: *p < 0.05. (E) Same as in (C) but cells cotransfected with or without siRNA against NBR1 (siNBR1) and immunostained for ABCD3. Scale bars: 50 μm. (F) Graph of the average ABCD3 fluorescence intensity within the entire cell normalized to siCTRL of 30 cells per trial (n = 3) ± standard deviation in (E). Asterisks represent p-values of statistics relative to siCTRL unless otherwise indicated: *p < 0.05, **p < 0.01.
Figure 3.
Figure 3.
PEX5 accumulates on the peroxisomal membrane in a ubiquitinated form and signals for pexophagy in cells depleted of peroxisomal AAA-complex components. (A) Immunoblots of the total cell lysates for PEX5 from HeLa cells transfected with plasmids encoding GFP-ubiquitin (GFP-Ub) and RFP-SKL after 2 d of treatment with siRNA as indicated. Cells were also treated with 10 μm chloroquine for 24 h to prevent peroxisome loss. The bracket represents modified PEX5; the arrow indicates PEX5, whereas the asterisks (*, **) indicate nonspecific bands. (B) Graph of the relative densitometry reading of GFP-Ubx-PEX5:PEX5 ratio; where GFP-Ubx-PEX5 represent the higher molecular weight bands indicated in (A). The average (n = 3) ± standard deviation for each condition is shown. Asterisks represent p-values of statistics relative to siCTRL: *p < 0.05. A.U., arbitrary units. (C) Same as (A) but immunoblot for ABCD3. The top dashed arrow represents modified ABCD3; the bottom solid arrow indicates ABCD3. (D) Representative fluorescence images of HeLa cells transfected with siRNA as indicated over 2 consecutive d and immunostained for ABCD3 and PEX5. Scale bars: 20 μm. (E) Graph of the average density of PEX5 punctate structures within a cell (the number of PEX5 puncta per volume of cell [μm3]) of 30 cells per trial (n = 3) ± standard deviation in (D). Asterisks represent p values compared with siCTRL: *p < 0.05. (F) Subcellular fractionation of HeLa cells transfected with GFP-ubiquitin (GFP-Ub) and RFP-SKL plasmids after 2 d of treatment with siRNA and chloroquine as in (A). The post nuclear homozygous lysates (WCL) were fractionated into cytosol and membrane fractions, and immunoblotted with the indicated antibodies. The top dashed arrow represents modified PEX5; the bottom solid arrow indicates PEX5, whereas the asterisk (*) indicates nonspecific bands. (G) Representative fluorescence images of HeLa cells transfected with nontargeting siRNA (siCTRL), siRNA against PEX1 (siPEX1), and PEX26 (siPEX26), with or without siRNA against PEX5 (siPEX5) as indicated and immunostained for ABCD3. Scale bars: 50 μm. (H) Graph of the average ABCD3 density per cell of at least 30 cells per trial (n = 3) ± standard deviation in (G). Asterisks represent p-values: *p < 0.05, **p < 0.01.
Figure 4.
Figure 4.
Peroxisomal AAA-complex deficiency induces autophagosome formation. (A) Representative fluorescent images of HeLa cells cotransfected with a GFP-MAP1LC3-encoding plasmid and siRNA as indicated. Cells were fixed and the GFP fluorescence was visualized by confocal microscopy. Scale bars: 10 μm. (B) Graph of the relative GFP-MAP1LC3B density (number of GFP-MAP1LC3B puncta per volume of each cell (μm3) normalized to siCTRL) of at least 30 cells per trial (n = 3) ± standard deviation in (A). Asterisks represent p values compared with siCTRL: *p < 0.05, **p < 0.01. (C) Representative fluorescence images of HeLa cells transfected with siRNA as indicated, fixed and immunostained for endogenous MAP1LC3B. Individual cells are outlined. Scale bars: 10 μm. (D) Graph of the relative MAP1LC3B density normalized to control siRNA of at least 30 cells per trial (n = 3) ± standard deviation in (C). Asterisks represent p values compared with siCTRL: **p < 0.01. (E) Immunoblots of total cell lysates as in (C) probed with antibodies as indicated. Arrowhead in NBR1 panel indicates the band of interest. (F) Graph of the ratio of MAP1LC3B-II:MAP1LC3B-I compared with siCTRL from (E: MAP1LC3B) as determined by densitometry for each siRNA treatment. The average (n = 3) ± standard deviation for each condition is shown. Asterisks represent p-values of statistics relative to siCTRL: *p < 0.05.
Figure 5.
Figure 5.
Autophagy inhibitors improve peroxisome number and matrix protein import in PEX1-mutated PBD fibroblasts. (A) Representative fluorescence images of ABCD3 in wild-type, PEX1-G843D, and PEX1 null fibroblasts cells that were mock treated, or treated with bafilomycin A1 (2 nM final), chloroquine (20 μM final), or LY294002 (5 mM final) for 24 hours. Scale bars: 100 μm. (B) Graph of the peroxisome density, or ABCD3 puncta per cell, normalized to the mock-treated wild-type fibroblasts of at least 30 cells per trial in (A). The average (n = 3) ± standard deviation for each condition is shown. * = p-values of statistics relative to mock-treated wild-type fibroblasts: *p < 0.05, **p < 0.01. = p-values of statistics relative to mock-treated PEX1-G843D fibroblasts: p < 0.05. = p-values of statistics relative to mock-treated PEX1 null fibroblasts: p < 0.05, ‡‡p < 0.01. ns, nonsignificant. (C) Immunoblotted total cell lysates were prepared from fibroblasts treated as in (A) (as indicated) for 24 h. Blots were immunostained with PEX14 and GAPDH antibodies. Relative intensity of the PEX14 bands relative to GAPDH are shown below each band. (D) Representative GFP fluorescence images of PEX1-G843D homozygous fibroblasts stably expressing GFP-PTS1 (PEX1-G843D-PTS1) that were treated with inhibitors as in (A). Scale bars: 50 μm. (E) Graph of the density of GFP-PTS1 puncta per cell normalized to mock-treated cells as in (D). The average (n = 3) ± standard deviation for each condition is shown. Asterisks represent p-values relative to nontreated cells: **p < 0.01.
Figure 6.
Figure 6.
Chloroquine improves peroxisome number and protein import without compromising cellular viability. (A) Wild-type fibroblasts were treated with various concentrations of chloroquine as indicated for 24 to 96 h. Viability was determined by MTT assay at 540 nm, and absorbance values for each respective concentration at a particular time point were normalized to mock-treated cells at that same time point to obtain the viability (% control, mock). (B) Representative fluorescence images of PEX1-G843D-PTS1 fibroblasts mock treated or treated with 5 μM chloroquine for 48 or 72 h as indicated, then fixed and stained for ABCD3. Scale bars: 100 μm. (C) Graph of the average ABCD3 density normalized to mock-treated cells per trial (n = 3) ± standard deviation in (B). Asterisks represent p-values of statistics relative to mock-treated fibroblasts: *p < 0.05. (D) Total cell lysates were prepared from wild-type, PEX1 null, and PEX1-G843D fibroblasts mock treated or treated with 5 or 10 μM chloroquine as indicated for 72 h, and immunoblotted with the indicated antibodies. Relative intensity of the PEX14 bands relative to GAPDH are shown below each band. (E) Representative GFP fluorescence images of PEX1-G843D-PTS1 cells mock treated or treated with 5 μM chloroquine for 0, 48 or 72 h. Scale bars: 100 μm. (F) Graph of the average GFP-PTS1 density normalized to the mock-treated fibroblasts of 30 cells per trial (n = 3) ± standard deviation in (E). **p < 0.01 relative to nontreated fibroblasts.
Figure 7.
Figure 7.
Chloroquine decreases VLCFA accumulation in PEX1-mutated fibroblasts. (A) Graph of the average VLCFA (C26:0 lysophosphatidylcholine, lysoPC) levels (pmol) in wild-type, PEX16 null, 2 different PEX1 null (PEX1 null-A, PEX1 null-B), PEX1-G843D hemizygous and PEX1-G843D homozygous primary fibroblast cell lines grown with a vehicle mock control (water) or with 5 μM chloroquine for 6 d. Asterisks represent p-values relative to mock-treated fibroblasts: **p < 0.01; ns, nonsignificant. (B) Graph of the average LCFA (C18:2 lysophosphatidylcholine, lysoPC) levels (pmol) in the same conditions as in (A) in chloroquine-treated cells compared with the mock-treated cells. Asterisks represent p-values relative to mock-treated fibroblasts: **p < 0.01; ns, nonsignificant.
Figure 8.
Figure 8.
A model for AAA-dependent pexophagy. The peroxisomal AAA-complex prevents ubiquitin-dependent pexophagy and enables peroxisomal matrix protein import. (A) Cells under basal conditions possess their peroxisomal AAA-complex, consisting of PEX1, PEX6 and PEX26, allowing for the efficient removal of ubiquitinated PEX5. Import of matrix proteins is represented by -PTS1. (B) Defect in any of the AAA-complex genes results in the loss of AAA-complex function and the accumulation of ubiquitinated PEX5. This results in the recruitment of autophagy receptors, NBR1 and SQSTM1, which then results in targeting of peroxisomes to phagophores for degradation via pexophagy. (C) Inhibiting pexophagy with chloroquine (CQ) prevents the degradation of peroxisomes, increasing their half-life, and allowing for the import of matrix proteins. This increase in peroxisome numbers and their subsequent increase in import of peroxisomal matrix enzymes results in improved peroxisomal function.

Similar articles

Cited by

References

    1. Yorimitsu T, Klionsky DJ. Autophagy: molecular machinery for self-eating. Cell Death Differ [Internet] 2005; 12 Suppl 2:1542-52. Available from: http://www.ncbi.nlm.nih.gov/pubmed/16247502; http://dx.doi.org/ 10.1038/sj.cdd.4401765 - DOI - PMC - PubMed
    1. Okamoto K. Organellophagy: eliminating cellular building blocks via selective autophagy. J Cell Biol [Internet] 2014; 205:435-45. Available from: http://www.ncbi.nlm.nih.gov/pubmed/24862571; PMID: 24862571; http://dx.doi.org/ 10.1083/jcb.201402054 - DOI - PMC - PubMed
    1. Stolz A, Ernst A, Dikic I. Cargo recognition and trafficking in selective autophagy. Nat Cell Biol [Internet] 2014; 16:495-501. Available from: http://www.ncbi.nlm.nih.gov/pubmed/24875736; PMID: 24875736; http://dx.doi.org/ 10.1038/ncb2979 - DOI - PubMed
    1. Johansen T, Lamark T. Selective autophagy mediated by autophagic adapter proteins. Autophagy [Internet] 2011; 7:279-96. Available from: http://www.ncbi.nlm.nih.gov/pubmed/21189453; PMID: 21189453; http://dx.doi.org/ 10.4161/auto.7.3.14487 - DOI - PMC - PubMed
    1. Pickrell AM, Youle RJ. The roles of PINK1, parkin, and mitochondrial fidelity in Parkinson's disease. Neuron [Internet] 2015; 85:257-73. Available from: http://www.ncbi.nlm.nih.gov/pubmed/25611507; http://dx.doi.org/ 10.1016/j.neuron.2014.12.007 - DOI - PMC - PubMed

MeSH terms

Substances

Supplementary concepts