

Correlation of cell-free DNA plasma concentration with severity of non-alcoholic fatty liver disease
- PMID: 28521774
- PMCID: PMC5437653
- DOI: 10.1186/s12967-017-1208-6
Correlation of cell-free DNA plasma concentration with severity of non-alcoholic fatty liver disease
Abstract
Background: The assessment of fibrosis and inflammatory activity is essential to identify patients with non-alcoholic fatty liver disease (NAFLD) at risk for progressive disease. Serum markers and ultrasound-based methods can replace liver biopsy for fibrosis staging, whereas non-invasive characterization of inflammatory activity remains a clinical challenge. Cell-free DNA (cfDNA) is a novel non-invasive biomarker for assessing cellular inflammation and cell death, which has not been evaluated in NAFLD.
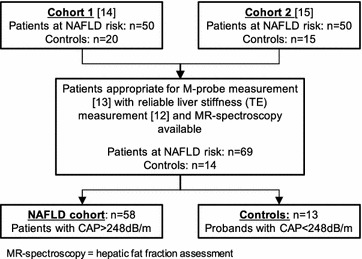
Methods: Patients and healthy controls from two previous studies were included. NAFLD disease activity and severity were non-invasively characterized by liver stiffness measurement (transient elastography, TE) including steatosis assessment with controlled attenuation parameter (CAP), single-proton magnetic resonance spectroscopy (1H-MRS) for determination of hepatic fat fraction, aminotransferases and serum ferritin. cfDNA levels (90 and 222 bp fragments) were analyzed using quantitative real-time PCR.
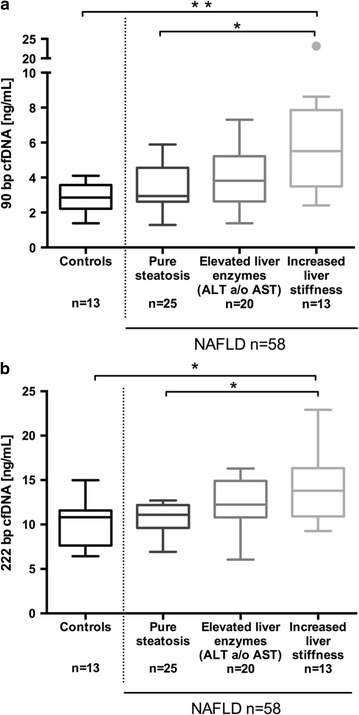
Results: Fifty-eight NAFLD patients (age 62 ± 11 years, BMI 28.2 ± 3.5 kg/m2) and 13 healthy controls (age 38 ± 12 years, BMI 22.4 ± 2.1 kg/m2) were included. 90 bp cfDNA levels were significantly higher in NAFLD patients compared to healthy controls: 3.7 (1.3-23.1) vs. 2.9 (1.4-4.1) ng/mL (p = 0.014). In the NAFLD cohort, circulating cfDNA correlated significantly with disease activity and severity, especially in patients with elevated liver stiffness (n = 13, 22%) compared to cases with TE values ≤7 kPa: cf90 bp 6.05 (2.41-23.13) vs. 3.16 (1.29-7.31) ng/mL (p < 0.001), and cf222 bp 14.41 (9.27-22.90) vs. 11.32 (6.05-18.28) ng/mL (p = 0.0041).
Conclusions: Cell-free DNA plasma concentration correlates with established non-invasive markers of NAFLD activity and severity. Therefore, cfDNA should be further evaluated as biomarker for identifying patients at risk for progressive NAFLD.
Keywords: Cell-free DNA; Controlled attenuation parameter; MR-spectroscopy; Non-alcoholic fatty liver disease; Non-alcoholic steatohepatitis; Transient elastography.
Figures
References
-
- EASL-EASD-EASO Clinical practice guidelines for the management of non-alcoholic fatty liver disease. J Hepatol. 2016;64:1388–1402. - PubMed
-
- Singh S, Allen AM, Wang Z, Prokop LJ, Murad MH, Loomba R. Fibrosis progression in nonalcoholic fatty liver vs nonalcoholic steatohepatitis: a systematic review and meta-analysis of paired-biopsy studies. Clin Gastroenterol Hepatol. 2015;13:643–654. doi: 10.1016/j.cgh.2014.04.014. - DOI - PMC - PubMed
Publication types
MeSH terms
Substances
LinkOut - more resources
Full Text Sources
Other Literature Sources
Medical
Miscellaneous
