. 2017 May 18;17(1):338.
doi: 10.1186/s12885-017-3319-0.

Linking hypoxia, DNA damage and proliferation in multicellular tumor spheroids

Affiliations

Linking hypoxia, DNA damage and proliferation in multicellular tumor spheroids

Stephen Riffle et al. BMC Cancer. .

Abstract

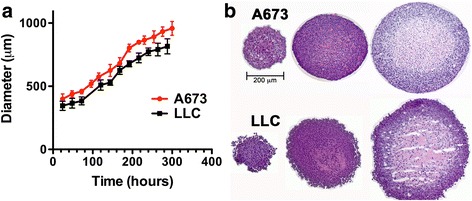
Background: Multicellular Tumor Spheroids are frequently used to mimic the regionalization of proliferation and the hypoxic environment within avascular tumors. Here we exploit these features to study the activation of DNA damage repair pathways and their correlation to developing hypoxia.

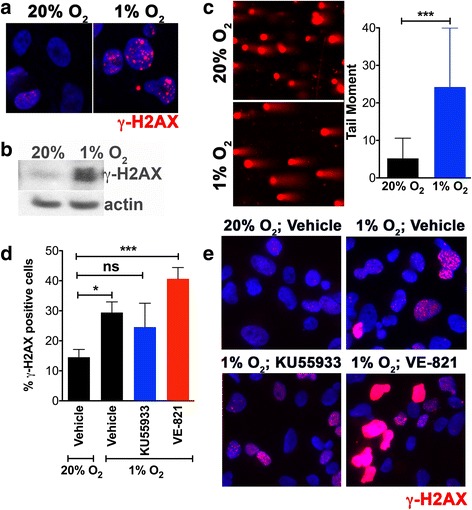
Methods: Activation of DNA damage repair markers, proliferation, cell death, glycogen accumulation and developing hypoxia were investigated using immunofluorescence, immuno-histochemistry, EdU incorporation, Western blots, COMET assays, and pharmacological agents in A673 Ewing sarcoma spheroids and monolayer cultures.

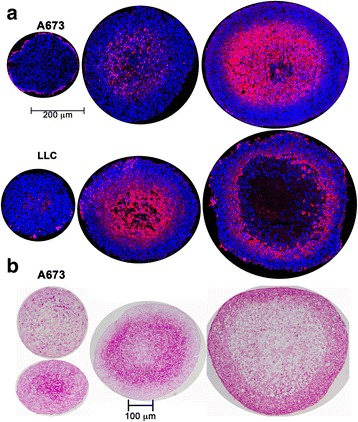
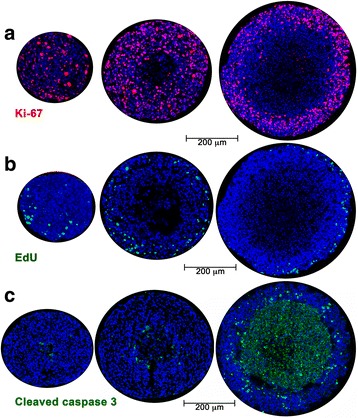
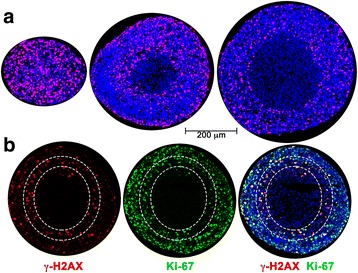
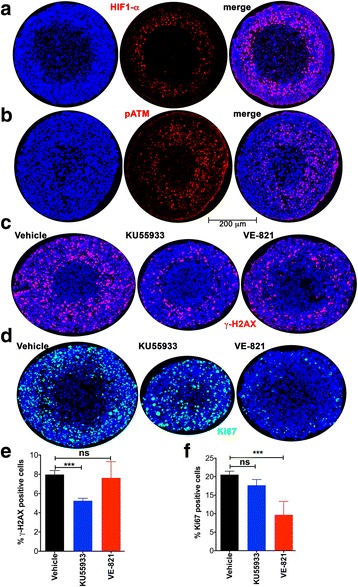
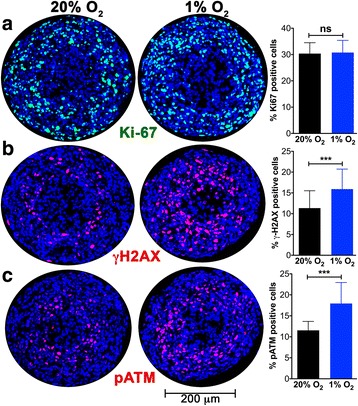
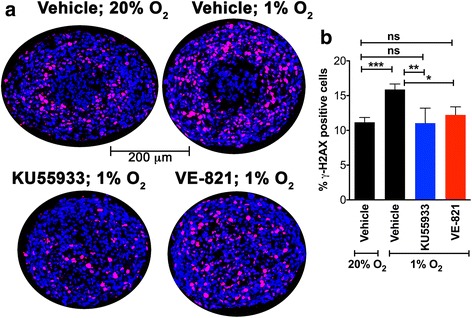
Results: DNA damage marker γ-H2AX is observed in the hypoxic, peri-necrotic region of growing spheroids. While most proliferating cells are seen on the spheroid surface, there are also a few Ki-67 positive cells in the hypoxic zone. The hypoxia-induced phosphorylation of H2AX to form γ-H2AX in spheroids is attenuated by the ATM inhibitor KU55933, but not the ATR inhibitor VE-821.

Conclusion: Tumor spheroids mimic tumor microenvironments such as the anoxic, hypoxic and oxic niches within solid tumors, as well as populations of cells that are viable, proliferating, and undergoing DNA damage repair processes under these different micro-environmental conditions. ATM, but not ATR, is the primary kinase responsible for γ-H2AX formation in the hypoxic core of A673 spheroids. Spheroids could offer unique advantages in testing therapeutics designed to target malignant cells that evade conventional treatment strategies by adapting to the hypoxic tumor microenvironment.

Keywords: ATM; ATR; DNA damage repair; Ewing sarcoma; Hypoxia; Proliferation; Spheroid.


Figures

Fig. 1
Fig. 1
Growth characteristics of A673 and LLC spheroids. a Growth curves for spheroids generated with A673 (red) and LLC (black) cells. The mean diameter and standard deviation from >8 spheroids are plotted over time, from initial formation to final size before spheroid collapse. b H&E staining of spheroid cryo-sections reveals the onset of necrosis in spheroids larger than 550 μm. The three sections shown come from spheroids of <500 μm, 550–650 μm and >750 μm in diameter. Shrinkage during processing as well as location of section within spheroids account for the smaller diameter in the final images shown
Fig. 2
Fig. 2
Hypoxia development and glycogen accumulation in growing spheroids. a Immunostaining of A673 and LLC spheroid cryo-sections for the hypoxia marker pimonidazole (red) shows hypoxia development at different sizes in the central core of A673 and LLC spheroids. Spheroids sections counter-stained with Hoechst 33,342. b Periodic Acid Schiff’s Base staining (dark pink) demonstrating glycogen storage in MCTS cryo-sections obtained from A673 spheroids of different sizes
Fig. 3
Fig. 3
Proliferation and apoptosis in A673 spheroids. a Representative images showing the proliferative marker Ki-67 (red, with blue Hoechst 33,342 counterstain) in A673 spheroids <500 μm, 550–650 μm and >750 μm in diameter. b Representative images showing EdU incorporation (green, with blue Hoechst 33,342 counterstain) in A673 spheroids <500 μm, 550–650 μm and >750 μm in diameter. These are adjacent sections from the same spheroids imaged in Fig. 3a. c Cell death in A673 spheroids of <500 μm, 550–650 μm and >750 μm in diameter indicated by staining for cleaved caspase-3 (green, with blue Hoechst 33,342 counterstain)
Fig. 4
Fig. 4
Distribution of γ-H2AX-positive cells in A673 spheroids. a γ-H2AX in A673 spheroids was used as a marker of DNA damage repair signaling. Immunostaining of representative spheroids <500 μm, 550–650 μm and >750 μm in diameter is shown. γ-H2AX in red, with blue Hoechst 33,342 counter-stain. b γ-H2AX co-staining with Ki-67 in spheroids approximately 570–650 μm in diameter shows activated DDR in proliferative cells within the hypoxic zone. The outer dotted line indicates where Ki-67-positive nuclei decrease in number, inner dotted line marks boundary of viable cells
Fig. 5
Fig. 5
ATM activation is linked to γ-H2AX formation while ATR activity contributes to proliferation in A673 spheroids. a Activation of the hypoxia-responsive factor HIF1-α (red with blue Hoechst 33,342 counter-stain) is observed in the peri-necrotic zone of A673 spheroids 570–650 μm in diameter. b Activation of ATM (phosphorylation at serine 1981 (pATM); red with blue Hoechst 33,342 counter-stain) is seen in the hypoxic, peri-necrotic zone. c The distribution of γ-H2AX (red, with blue Hoechst 33,342 counter-stain) in spheroids maintained for 96 h in either vehicle, the ATM inhibitor KU55933, or the ATR inhibitor VE-821. Spheroids were <500 μm in diameter at the start of the experiment and vehicle-treated spheroids were approximately 700 μm in diameter at the end of 96 h. Both KU55933 and VE-821 impaired spheroid growth. d The distribution of Ki-67 (green, with blue Hoechst 33,342 counter-stain) in spheroids maintained for 96 h in either vehicle, the ATM inhibitor KU55933, or the ATR inhibitor VE-821. e Bar graph showing percentage of γ-H2AX-positive cells per spheroid when maintained for 96 h in either vehicle, the ATM inhibitor KU55933, or the ATR inhibitor VE-821. Mean and standard deviation are shown; each bar represents at least 15 spheroids from three independent experiments. f Percentage of Ki-67-positive cells per spheroid when maintained for 96 h in either vehicle, the ATM inhibitor KU55933, or the ATR inhibitor VE-821 is shown as the mean and standard deviation; each bar represents at least 15 spheroids from three independent experiments. One way ANOVA with Dunnett’s post-test. ***P < .001, ns P > .05
Fig. 6
Fig. 6
ATM activation and γ-H2AX formation are promoted by hypoxia, while proliferation is unaffected. a The effect of maintaining ~400 μm A673 spheroids in 1% O2 for 12 h was monitored. Spheroid sections were stained for the proliferation marker Ki-67 (green). The % Ki-67-positive cells is plotted (mean and standard deviation from >12 spheroids and two independent experiments). Hypoxia had no effect on cell proliferation. b The DDR marker γ-H2AX (red) is upregulated in the core of spheroids maintained in 1% O2 for 12 h. Bar graph shows the mean and standard deviation from >45 spheroids and >5 independent experiments. c Activation of ATM kinase is indicated by staining for pATM (red) in spheroids maintained in 1% O2 for 12 h. Bar graph shows the mean and standard deviation from >15 spheroids and 4 independent experiments. One way ANOVA with Dunnett’s post-test. ***P < .001, ns P > .05
Fig. 7
Fig. 7
ATM or ATR inhibition attenuates the severe hypoxia-induced increase in γ-H2AX levels in spheroids. a A673 spheroids ~400 μm in diameter were maintained for 12 h in either 20% O2 or 1% O2 in vehicle, 1% O2 in KU55933 or 1% O2 in VE-821. The effect of ATM inhibition (KU55933) or ATR inhibition (VE-821) on γ-H2AX distribution (red, with blue Hoechst 33,342 counter-stain) is shown. b Percentage of γ-H2AX-positive cells in spheroids was quantitated. Bar graph shows the mean and standard deviation from >14 spheroids and at least 3 independent experiments. One way ANOVA with Dunnett’s post-test. ***P < .001, **P < .01, ns P > .05
Fig. 8
Fig. 8
1% O2 is sufficient to induce DNA damage in A673 monolayers and inhibition of ATR promotes H2AX phosphorylation. a The effect of maintaining monolayers of A673 cells in 1% O2 for 12 h was monitored. Immunofluorescence indicates the formation of distinct γ-H2AX foci (red) in A673 cells. b Western blot shows elevation of γ-H2AX levels in A673 cells maintained in 1% O2 for 12 h. c Alkaline COMET assay shows induction of COMET tails (a direct measure of DNA damage) when A673 cells were maintained in 1% O2 for 12 h. Tail moments were quantitated using OpenCOMET [43] and are plotted as the mean and standard deviation. d Bar graph showing the percentage of γ-H2AX-positive A673 cells when monolayers were maintained for 12 h in either 20% O2 or 1% O2 in vehicle, 1% O2 in KU55933 (ATM inhibitor), or 1% O2 in VE-821 (ATR inhibitor). Mean and standard deviation from two independent experiments are shown. e Immunofluorescence for γ-H2AX (red) in A673 monolayers maintained for 12 h in either 20% O2 or 1% O2 in vehicle, 1% O2 in KU55933 (ATM inhibitor), or 1% O2 in VE-821 (ATR inhibitor). ATR inhibition under hypoxia results in cells with either intense pan-nuclear γ-H2AX or distinct foci, while only distinct γ-H2AX foci are seen under hypoxia in the presence of either vehicle or ATM inhibitor. One way ANOVA with Tukey’s multi-comparison post-test. ***P < .001, **P < .01, *P < .05, ns P > .05

References

    1. Brown JM. Tumor hypoxia in cancer therapy. Methods Enzymol. 2007;435:297–321. - PubMed
    1. Hammond EM, Dorie MJ, Giaccia AJ. ATR/ATM targets are phosphorylated by ATR in response to hypoxia and ATM in response to reoxygenation. J Biol Chem. 2003;278(14):12207–12213. doi: 10.1074/jbc.M212360200. - DOI - PubMed
    1. Scanlon SE, Glazer PM. Multifaceted control of DNA repair pathways by the hypoxic tumor microenvironment. DNA Repair (Amst) 2015;32:180–189. doi: 10.1016/j.dnarep.2015.04.030. - DOI - PMC - PubMed
    1. Olcina M, Lecane PS, Hammond EM. Targeting hypoxic cells through the DNA damage response. Clinical cancer research : an official journal of the American Association for Cancer Research. 2010;16(23):5624–5629. doi: 10.1158/1078-0432.CCR-10-0286. - DOI - PMC - PubMed
    1. Olcina MM, Grand RJ, Hammond EM. ATM activation in hypoxia - causes and consequences. Mol Cell Oncol. 2014;1(1) doi: 10.4161/mco.29903. - DOI - PMC - PubMed