. 2017 Jul;206(3):1389-1402.
doi: 10.1534/genetics.116.195735. Epub 2017 May 18.

A Novel Histone Crosstalk Pathway Important for Regulation of UV-Induced DNA Damage Repair in Saccharomyces cerevisiae

Affiliations

A Novel Histone Crosstalk Pathway Important for Regulation of UV-Induced DNA Damage Repair in Saccharomyces cerevisiae

Anna L Boudoures et al. Genetics. 2017 Jul.

Abstract

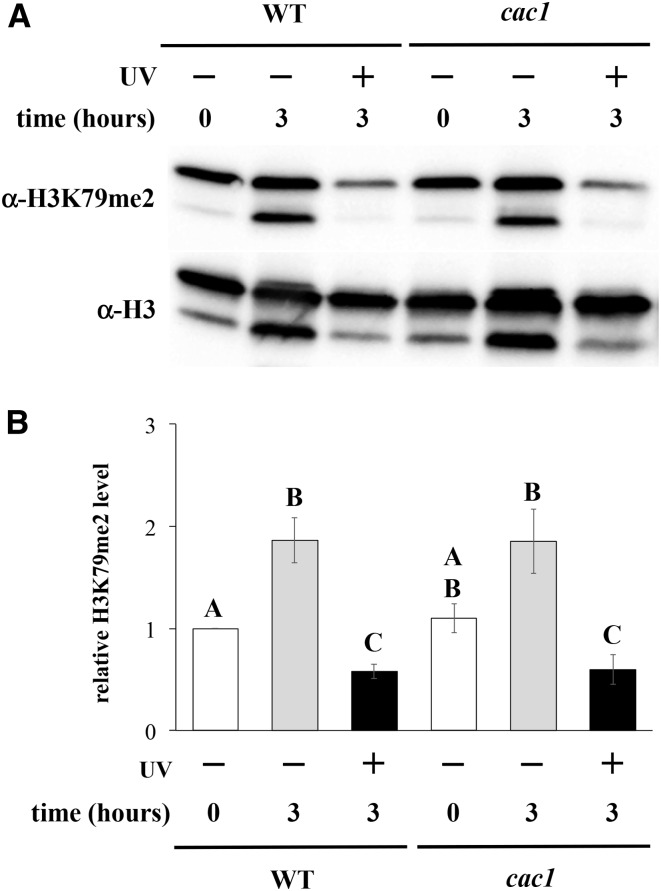
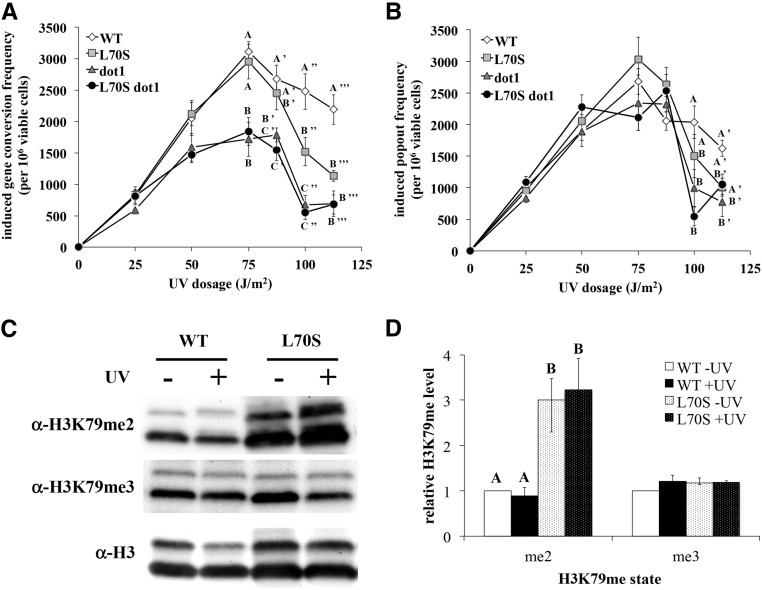
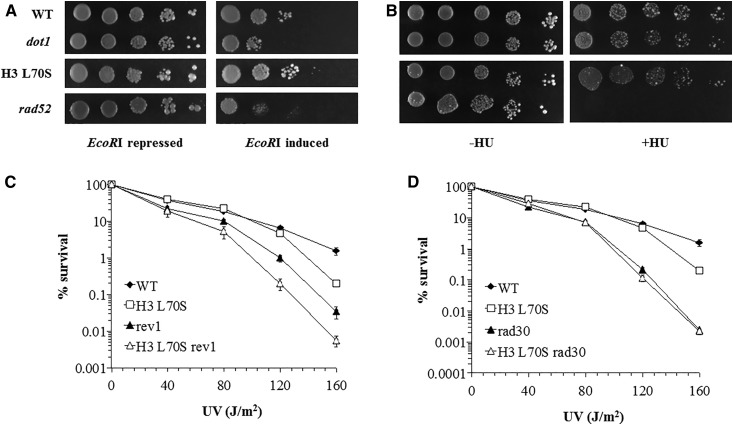
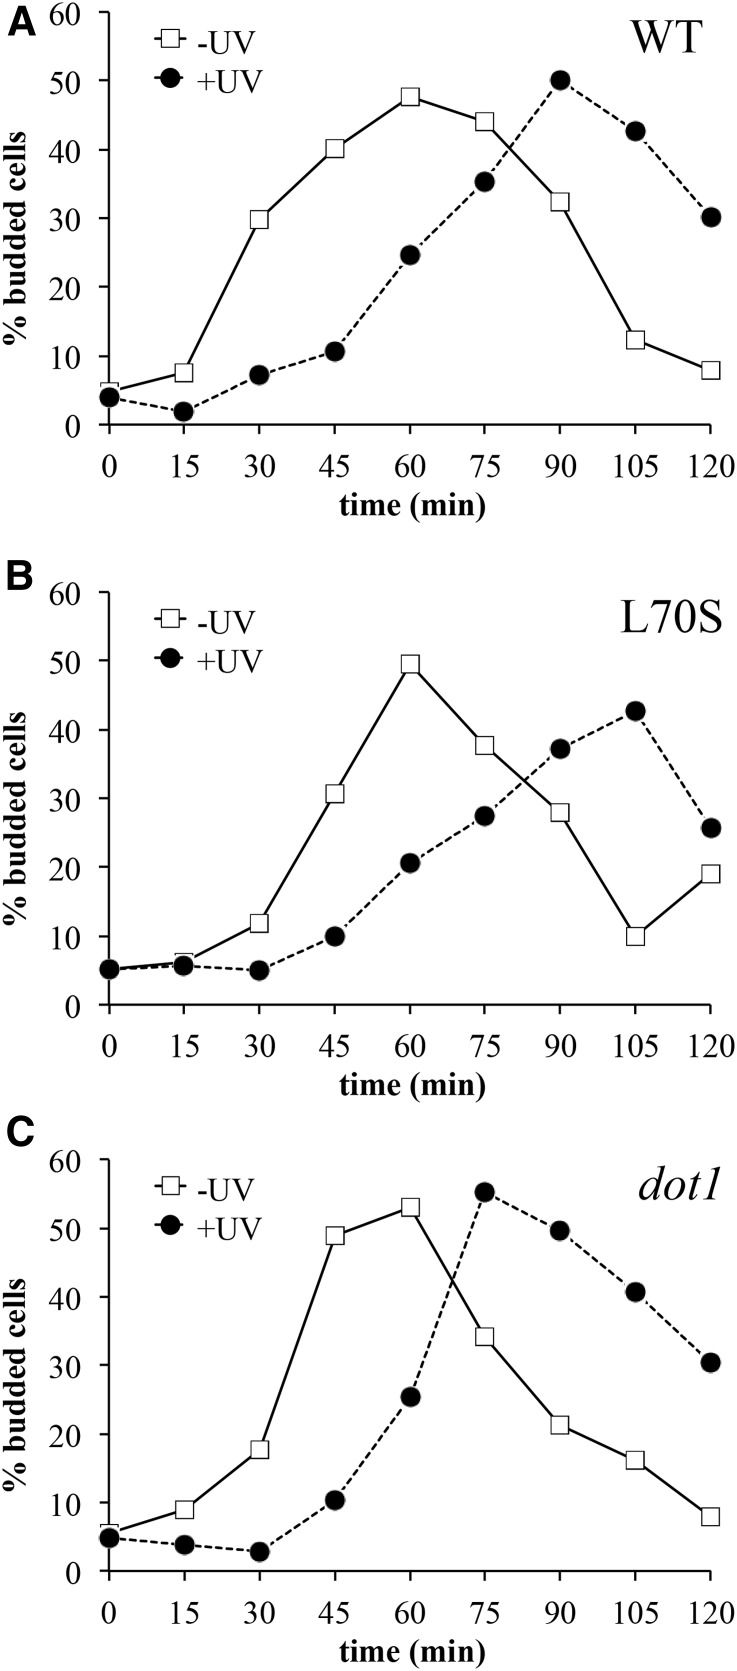
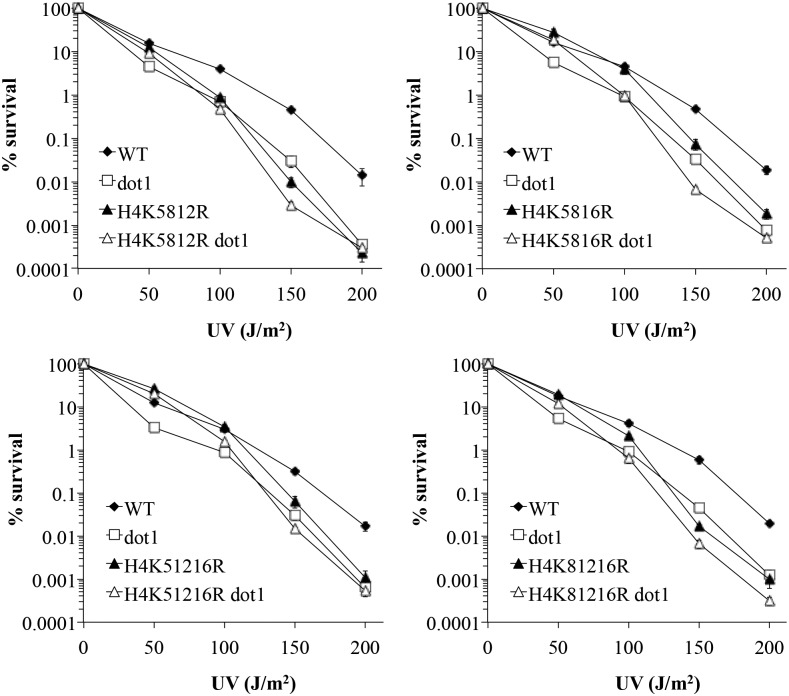
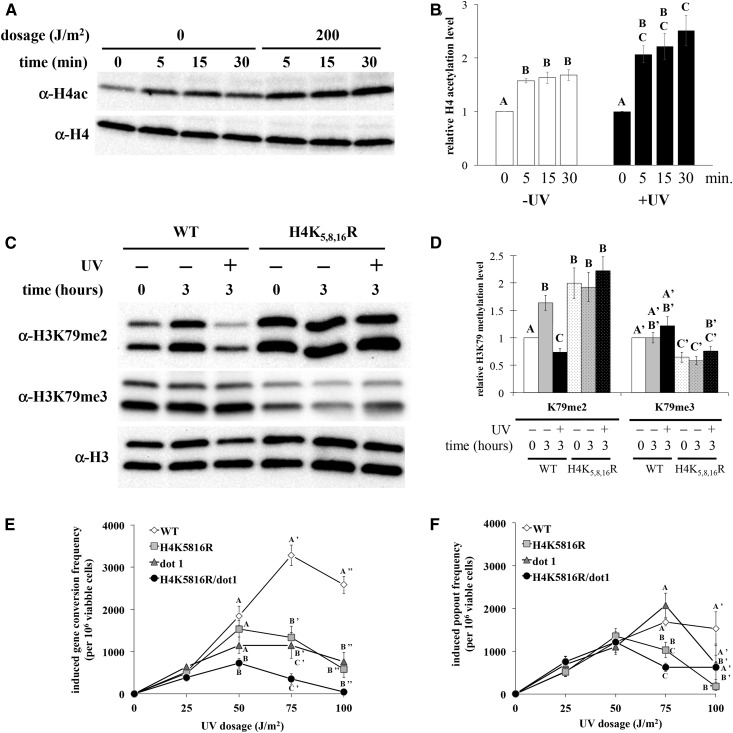
Histone post-translational modifications play vital roles in a variety of nuclear processes, including DNA repair. It has been previously shown that histone H3K79 methylation is important for the cellular response to DNA damage caused by ultraviolet (UV) radiation, with evidence that specific methylation states play distinct roles in UV repair. Here, we report that H3K79 methylation is reduced in response to UV exposure in Saccharomyces cerevisiae This reduction is specific to the dimethylated state, as trimethylation levels are minimally altered by UV exposure. Inhibition of this reduction has a deleterious effect on UV-induced sister chromatid exchange, suggesting that H3K79 dimethylation levels play a regulatory role in UV repair. Further evidence implicates an additional role for H3K79 dimethylation levels in error-free translesion synthesis, but not in UV-induced G1/S checkpoint activation or double-stranded break repair. Additionally, we find that H3K79 dimethylation levels are influenced by acetylatable lysines on the histone H4 N-terminal tail, which are hyperacetylated in response to UV exposure. Preclusion of H4 acetylation prevents UV-induced reduction of H3K79 dimethylation, and similarly has a negative effect on UV-induced sister chromatid exchange. These results point to the existence of a novel histone crosstalk pathway that is important for the regulation of UV-induced DNA damage repair.

Keywords: DNA repair; histone crosstalk; histone modification; methylation; sister chromatid exchange.


Figures

Figure 1
Figure 1
Site-specificity confirmation of H3K79me2 and H3K79me3 antibodies. (A) Western blot analysis of wildtype (JTY34) and dot1 (JTY34D) strains, using α-H3, α-H3K79me2, and α-H3K79me3 antibodies, as described in Materials and Methods. Calf thymus histones (H3; Sigma #H6005) were also included for comparison (0.01 μg on the α-H3 blot, 0.1 μg on the α-H3K79me2, and 1 μg α-H3K79me3 blots). (B) Relative H3K79me2 and H3K79me3 levels, based on western blot densitometry. Values represent relative H3K79me2 or H3K79me3 band intensities in the wild-type strain, calculated by divided the intensity of the H3K79me2 and H3K79me3 bands (upper, lower, or both concurrently) by the intensity of the corresponding band(s) detected by the general H3 antibody. These values were then normalized relative to the corresponding value for the “both bands” measurement for each methylation state. Error bars represent 1 SE.
Figure 2
Figure 2
Reduction of histone H3K79me levels in response to UV exposure. Wildtype yeast (JTY34) were synchronized by growth into early stationary phase, exposed to UV radiation (or mock exposed), and then incubated in fresh medium. Nuclear extracts from cells collected after various incubation times were analyzed by western blot, using H3K79me state-specific antibodies, as described previously (Rossodivita et al. 2014) and in Materials and Methods. Representative blots are shown. Histone H3 is observed as a doublet, as described in Figure 1. The faint, faster migrating band observed in some panels is a proteolytic product of H3 associated with this purification method (Shahbazian et al. 2005). Densitometry values represent means of at least five assays, normalized relative to the general H3 levels, and subsequently normalized to the pre-exposure levels; error bars represent 1 SE. Letters are displayed on graphs to connect data points whose differences are not statistically significant (P > 0.05); differences between any pair of values within a given data set that do not share a letter are statistically significant. Data sets without letters indicates that no significant differences were observed. (A, B) exposure to varying UV dosages, as indicated, followed by a 30-min incubation period. (C, D) same as (A) and (B), except incubated for 4 hr. P < 0.01 for significant differences denoted. (E, F) 200 J/m2 UV exposure, varying incubation times as indicated. P < 0.03 for significant differences denoted.
Figure 3
Figure 3
UV-induced reduction of H3K79me2 occurs in α-factor arrested cells, but not in the absence of UV. (A, B) A bar1- strain (JTY34b1) was synchronized with α-factor, followed by release from α-factor, exposure to UV, postexposure incubation for 3 hr, and western blot analysis, as displayed in Figure 2. Error bars represent 1 SE. P < 0.01 for significant differences denoted, except H3K79me3 0 J/m2 vs. 150–300 J/m2, respectively (P = 0.04). (C, D) A bar1- culture was arrested with α-factor as in (A), and then transferred into fresh medium containing either α-factor or protease XIV (to degrade residual α-factor). Samples were collected at the indicated times and analyzed by western blot, as described in Figure 2. P < 0.03 for significant differences denoted.
Figure 4
Figure 4
UV exposure induces H3K79me2 reduction during checkpoint arrest at all dosages. Yeast strain JTY34 was synchronized by growth into stationary phase, followed by UV exposure at varying dosages, and incubation in fresh medium over time. (A) Aliquots of UV-exposed cultures (and a mock-exposed control) were examined microscopically for the emergence of buds, as described in Materials and Methods, reported as the percentage of cells possessing small buds. A representative experiment is shown. (B) Samples were collected from the same UV-exposed culture as in (A), at the latest time point at which a given subculture had not yet experienced bud emergence (as noted on the figure labels). Western blot analysis on nuclear extracts was done as described and displayed in Figure 2. Error bars represent 1 SE. (C) Densitometry of western blot results, as displayed in Figure 2. P < 0.01 for significant differences denoted, except between 0 J/m2 (0 hr) and 50 J/m2 (P = 0.02), 0 J/m2 (1 hr) and 50 J/m2 (P = 0.02), 0 J/m2 (1 hr), and 100 J/m2 (P = 0.04) and 50 J/m2 and 200 J/m2 (P = 0.02).
Figure 5
Figure 5
UV-induced reduction of H3K79me2 is independent of CAF-1. Yeast cells were exposed to 200 J/m2 UV (stationary phase synchronization, 3-hr post-exposure incubation), and H3K79me2 levels were analyzed by western blot, as described and displayed in Figure 2. Error bars represent 1 SE. Strains used: wildtype (JTY34) and cac1 mutant (AKY34c1). (A) Representative western blot. (B) Densitometry to relative H3K79me2 levels. P < 0.01 for all significant differences, except cac1 −UV 0 hr vs. cac1 +UV 3 hr (0.04).
Figure 6
Figure 6
H3K79me2 levels affect UV-induced sister chromatid exchange. Sister chromatid exchange assays were done as described previously (Rossodivita et al. 2014). Data represent the means of UV-induced gene conversion (A) and popout (B) frequencies per 106 surviving cells, from at least five separate assays. Error bars represent 1 SE. Letters are displayed on graphs to identify data points at a given UV dosage whose differences are not statistically significant; values within a given dosage not sharing letters are statistically significant [P < 0.01, except WT vs. L70S gene conversion at 100 J/m2 (P = 0.03), and WT vs. dot1 popout at 100 J/m2 (P = 0.04)]; data lacking letters indicates that no significant differences were observed at that dosage. Strains used: JTY34ATA (WT), JTY309ATA (L70S), JTY34DATA (dot1), and JTY309DATA (H3 L70S dot1. (C, D) Western blot analysis of H3K79me levels in wild-type (JTY34) and H3 L70S (JTY309) strains in response to UV exposure (log phase cultures, 125 J/m2 exposure, 1-hr post-exposure incubation). Data are displayed as described in Figure 2. P < 0.03 for significant differences denoted.
Figure 7
Figure 7
The histone H3 L70S mutation does not affect sensitivity to EcoRI or hydroxyurea, but genetically acts through an error-free TLS pathway. (A) Strains were transformed with a plasmid possessing the gene encoding the EcoRI endonuclease, as described in Materials and Methods. Expression is regulated by the presence of glucose (repressed) or galactose (induced) in the growth medium. Cultures were serially diluted 10-fold, and spot plated on selectable medium containing either glucose or galactose. (B) Cultures were serially diluted 10-fold and spot plated on YEPD plates lacking (−HU) or containing (+HU) hydroxyurea at 150 mM. For experiments shown in (A) and (B), plates were photographed after ∼4–6 days of growth. Images shown are representative of the replicate trials executed. Labels on the left apply to both experiments. Strains used: JTY34 (WT), JTY34D (dot1), JTY309 (H3 L70S), and JTY34r52 (rad52). (C, D) UV survival assays were done as previously described (Bostelman et al. 2007). Values represent the mean of at least three assays; error bars represent 1 SE (not visible in many cases, due to the small size of the error). Strains used: JTY34 (WT), JTY309 (H3 L70S), JTY34v1 (rev1), JTY309v1 (H3 L70S rev1), JTY34r30 (rad30), and JTY309r30 (H3 L70S rad30).
Figure 8
Figure 8
H3K79me2 levels do not affect UV-induced G1/S checkpoint arrest. Strains were arrested with α-factor, exposed to UV at 100 J/m2, and the frequency of small budded cells was measured over time, as described in Figure 4 and Materials and Methods. Representative experiments are shown; quantitative compilation of data are displayed in Table 2. Strains utilized: (A) JTY34 (WT), (B) JTY309 (L70S), and (C) JTY34D (dot1).
Figure 9
Figure 9
Epistasis analysis between H4ac and H3K79me. UV survival assays were done as previously described (Bostelman et al. 2007). Values represent the mean of at least three assays; error bars represent 1 SE (not visible in many cases, due to the small size of the error). Strains used: MEY34M (WT), ABY34MD (dot1), MEYK5812R (H4 K5812R), ABYK5812RD (H4 K5812R dot1), MEYK5816R (H4 K5816R), ABYK5816RD (H4 K5816R dot1), MEYK51216R (H4 K51216R), ABYK51216RD (H4 K51216R dot1), MEYK81216R (H4 K81216R), and ABYK81216RD (H4 K81216R dot1).
Figure 10
Figure 10
H4ac is required for UV-induced reduction of H3K79me2 and UV-induced SCE. Yeast were synchronized in stationary phase, exposed to 200 J/m2 UV, and analyzed at varying times after exposure by western blot. Data displayed as described in Figure 2. Error bars represent 1 SE. (A, B) H4 acetylation levels at sites 5, 8, 12, and 16 were analyzed in strain JTY34. Postexposure incubation times are indicated. P < 0.02 for significant differences denoted. (C, D) H3K79me2 and H3K79me3 levels were analyzed in wildtype (MEY34M) and H4K5,8,16R (MEYK5816R) yeast strains, following a 3-hr post-exposure incubation. P < 0.01 for significant differences denoted, except H3K79me2 WT −UV 0 hr vs. K5,8,16R −UV 3 hr (P = 0.04), and H3K79me3 WT −UV 3 hr vs. K5,8,16R −UV 0 hr (P = 0.03). (E, F) Sister chromatid exchange assays were done as described in Materials and Methods, and reported as in Figure 6. (E) Gene conversion events. (F) Popout events. P < 0.01 for significant differences denoted, except gene conversion H4K5816R vs. H4K5816R/dot1 and popout WT vs. H4K5816R (P = 0.03 for both). Strains used: JTYTFATA (WT), JTYK5816RATA (H4K5816R), JTYTFDATA (dot1), and JTYK5816RDATA (H4K5816R/dot1).

References

    1. Acharya N., Johnson R. E., Prakash S., Prakash L., 2006. Complex formation with Rev1 enhances the proficiency of yeast DNA polymerase ζ for mismatch extension and for extension opposite from DNA lesions. Mol. Cell. Biol. 26: 9555–9563. - PMC - PubMed
    1. Altaf M., Utley R. T., Lacoste N., Tan S., Briggs S. D., et al. , 2007. Interplay of chromatin modifiers on a short basic patch of histone H4 tail defines the boundary of telomeric heterochromatin. Mol. Cell 28: 1002–1014. - PMC - PubMed
    1. Barnes G., Rine J., 1985. Regulated expression of endonuclease EcoRI in Saccharomyces cerevisiae: nuclear entry and biological consequences. Proc. Natl. Acad. Sci. USA 82: 1354–1358. - PMC - PubMed
    1. Boiteux S., Jinks-Robertson S., 2013. DNA repair mechanisms and the bypass of DNA damage in Saccharomyces cerevisiae. Genetics 193: 1025–1064. - PMC - PubMed
    1. Bostelman L. J., Keller A. M., Albrecht A. M., Arat A., Thompson J. S., 2007. Methylation of histone H3 lysine-79 by Dot1p plays multiple roles in the response to UV damage in Saccharomyces cerevisiae. DNA Repair (Amst.) 6: 383–395. - PubMed

MeSH terms