. 2017 Aug;27(8):1384-1394.
doi: 10.1101/gr.216150.116. Epub 2017 May 18.

Long terminal repeats power evolution of genes and gene expression programs in mammalian oocytes and zygotes

Affiliations

Long terminal repeats power evolution of genes and gene expression programs in mammalian oocytes and zygotes

Vedran Franke et al. Genome Res. 2017 Aug.

Abstract

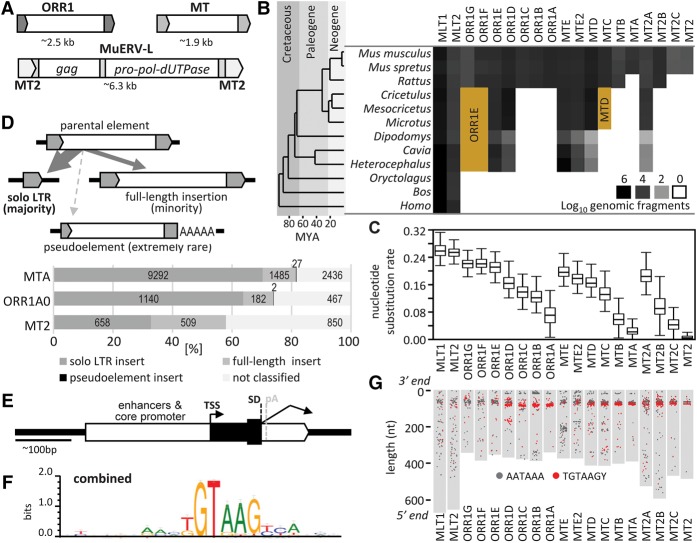
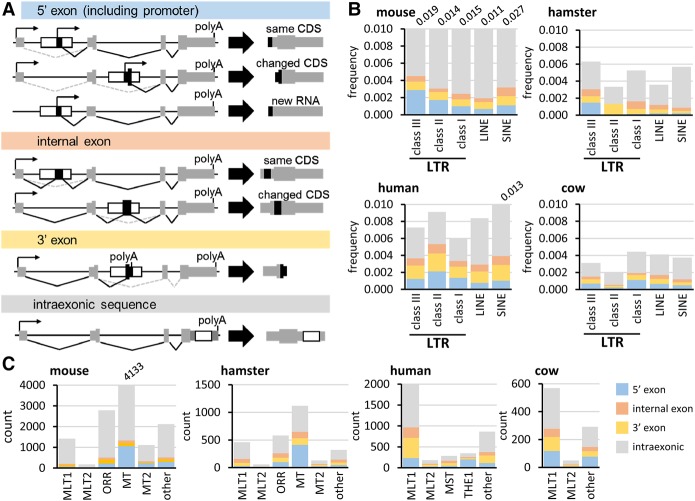
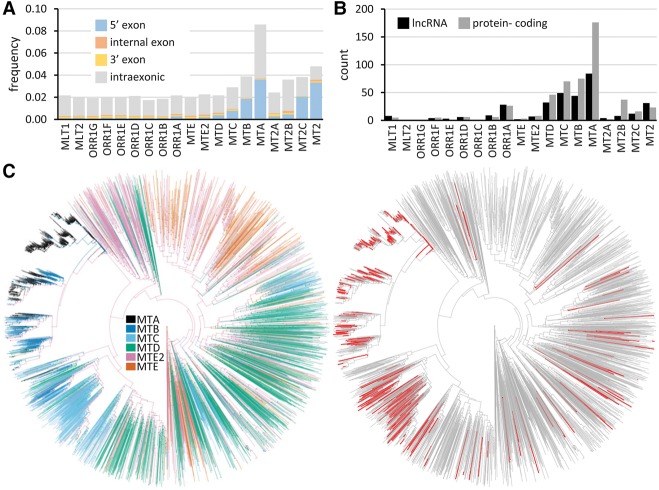
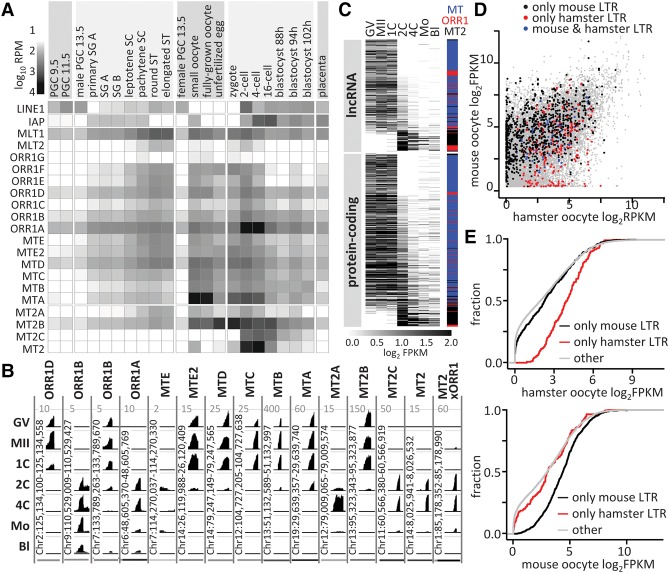
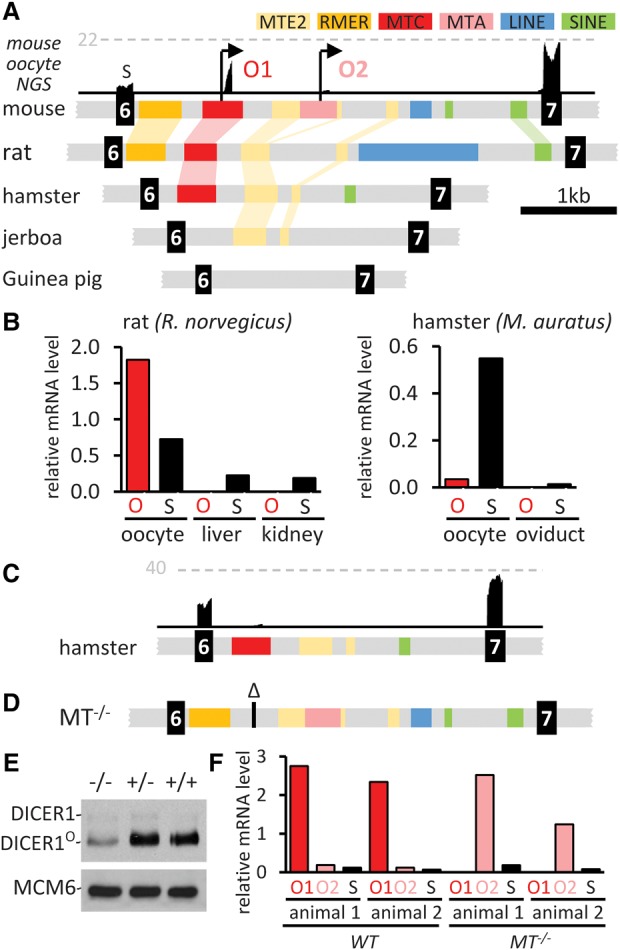
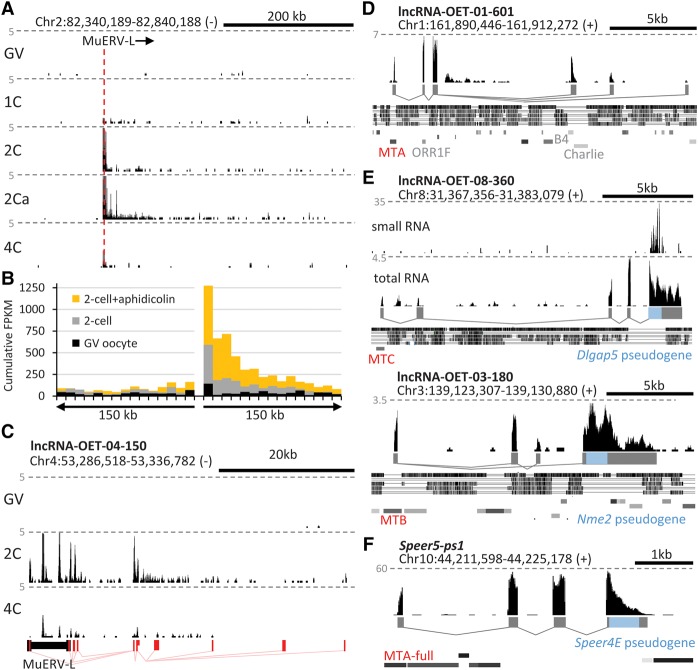
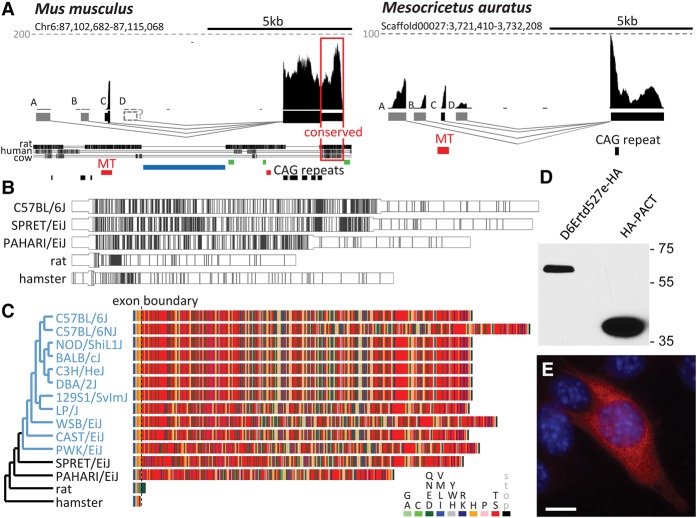
Retrotransposons are "copy-and-paste" insertional mutagens that substantially contribute to mammalian genome content. Retrotransposons often carry long terminal repeats (LTRs) for retrovirus-like reverse transcription and integration into the genome. We report an extraordinary impact of a group of LTRs from the mammalian endogenous retrovirus-related ERVL retrotransposon class on gene expression in the germline and beyond. In mouse, we identified more than 800 LTRs from ORR1, MT, MT2, and MLT families, which resemble mobile gene-remodeling platforms that supply promoters and first exons. The LTR-mediated gene remodeling also extends to hamster, human, and bovine oocytes. The LTRs function in a stage-specific manner during the oocyte-to-embryo transition by activating transcription, altering protein-coding sequences, producing noncoding RNAs, and even supporting evolution of new protein-coding genes. These functions result, for example, in recycling processed pseudogenes into mRNAs or lncRNAs with regulatory roles. The functional potential of the studied LTRs is even higher, because we show that dormant LTR promoter activity can rescue loss of an essential upstream promoter. We also report a novel protein-coding gene evolution-D6Ertd527e-in which an MT LTR provided a promoter and the 5' exon with a functional start codon while the bulk of the protein-coding sequence evolved through a CAG repeat expansion. Altogether, ERVL LTRs provide molecular mechanisms for stochastically scanning, rewiring, and recycling genetic information on an extraordinary scale. ERVL LTRs thus offer means for a comprehensive survey of the genome's expression potential, tightly intertwining with gene expression and evolution in the germline.


Figures

Figure 1.
Figure 1.
Sequence properties of selected ERVL LTRs. (A) Organization of ORR1, MT, and MuERV-L retrotransposons. Internal sequences of ORR1 and MT elements do not encode any protein. (B) Abundance of selected ERVL LTRs in mammalian genomes. The brown areas indicate misannotated ORR1F, ORR1G, and MTC LTRs in genomes of other rodents. (C) Nucleotide substitution rate for the closest pairs among 200 random inserts in each LTR subfamily. (D) Three types of LTR retrotransposon inserts and their frequencies among the selected youngest ERVL subfamilies. (E) A schematic depiction of an MT LTR gene-remodeling platform. (F) A combined SD sequence logo of MT, ORR1, and MT2 LTR families. (G) Conserved position of the splice consensus sequence at the 3′ end of selected LTRs. Gray rectangles depict consensus lengths of LTRs aligned by the 3′ end to the top. Red or black points represent positions of TGTAAGY consensus motif or AATAAA polyadenylation signal, respectively, in 200 randomly chosen LTRs in each subfamily.
Figure 2.
Figure 2.
Gene remodeling by LTRs. (A) Four categories of LTR co-option according to the co-opted exon boundaries. LTR co-options may affect gene expression but not the encoded protein, remodel a gene and change its protein product, or create a new transcriptional unit, such as an lncRNA gene. (B) Whole-genome analyses of impacts of LTR, LINE, and SINE elements on gene structure according to the classification depicted in A. Repeatmasker (Smit et al. 2013–2015) was used for Class I–III LTR annotation. The y-scale depicts the ratio of observed co-option events and annotated insertions, which are listed in Supplemental Tables S2 (mouse), S5 (hamster), S6 (human), and S7 (cow). (C) Impact of MaLR and MT2 LTRs on gene structure according to the classification depicted in A in four mammals. The y-scale depicts the number of co-opted insertion events. B and C display both full and partial contributions.
Figure 3.
Figure 3.
Evolution of exon co-option in mice. (A) Frequency of co-options in selected LTR subfamilies (full and partial contribution). (B) Numbers of full LTR 5′ exon co-options in protein-coding genes and lncRNAs expressed in oocytes and early embryos. (C) MT LTR family phylogeny and bursts of gene rewiring events. The left tree shows a phylogenetic tree of 5000 randomly selected MT LTRs combined with 596 LTRs co-opted as complete 5′ exons. The right tree highlights in red the co-opted LTRs.
Figure 4.
Figure 4.
Transcriptional control by co-option of MaLR and MT2 LTRs. (A) LTR RNA abundance in transcriptomes of germline cycle stages presented as log10 RPM of selected LTR sequences in poly(A) NGS data sets (Supplemental Table S3). Included are profiles of LINE1 and IAP, the presently active mouse autonomous retrotransposons (Maksakova et al. 2006; Sookdeo et al. 2013). (B) Maternal and zygotic expression of solo LTRs during oocyte-to-embryo transition. UCSC Genome Browser (Kent et al. 2002) snapshots exemplify expression patterns of co-opted 5′ exons. For each LTR, all stages were set for the maximum CPM values indicated on the top of each column. Most LTR subfamilies have distinct maternal or zygotic expression patterns corresponding to the specific patterns shown here (Supplemental Fig. S3). At the same time, some variability within an LTR subfamily is occasionally observed as shown for two different ORR1B LTR insertions. Developmental stages: (GV) full-grown GV oocyte; (MII) metaphase II oocyte; (1C) one-cell (fertilized egg); (2C) two-cell; (4C) four-cell; (Mo) morula; (Bl) blastocyst. MT2xORR1 is the 3′ MT2 LTR of MuERV-L that is preceded by an 87-bp fragment of ORR1A3 internal sequence. (C) Expression of MaLR and MT2 LTR-derived 5′ exons from lncRNAs and protein-coding genes ordered by the maternal/ZGA expression ratio (GV+MII)/(2C+4C). The heatmap shows log2 FPKM values of the annotated LTR 5′ exons (full contribution) with FPKM >0.1 in at least one sample. The colored bar indicates the LTR family. (D) Expression of genes containing LTR-derived 5′ exons in mouse and hamster oocytes. Points represent log2 FPKM values of genes in mouse and hamster oocytes (GSE86470). Point colors indicate whether the 5′ LTR-derived exon is present in the mouse (black) or hamster (red) genome or in genomes of both species (blue), and gray points depict remaining genes. (E) Comparison of oocyte expression of genes that have an LTR-derived 5′ exon in mice or hamsters with expression of other genes. The x-axis represents gene expression (log2 FPKM), whereas the y-axis is fraction of genes.
Figure 5.
Figure 5.
Dicer1 rewiring and remodeling by MT LTRs. (A) Retrotransposon content changes during evolution of Dicer1 intron 6 in rodents. Above the mouse sequence is a snapshot of a UCSC Genome Browser track with mouse oocyte NGS data. The gray dashed line indicates CPM. O1, O2—two oocyte-specific promoters. (B) qPCR analysis of Dicer1 isoform mRNA expression in rat and hamster oocytes. Dicer1O (O) and full-length somatic Dicer1 isoform (S) expression are shown relative to Hprt. (C) NGS data support minimal Dicer1O expression in hamster oocytes. Shown is a UCSC Genome Browser snapshot. The horizontal dashed line represents the number of reads. (D) A schematic view of the intron 6 in Dicer1MT−/− mice with MTC (O1 promoter) deletion. (E) Oocytes lacking the MTC LTR (O1 promoter) still produce a detectable amount of DICER1O. Shown is an immunoblot from C57Bl/6NCrl oocytes. A low amount of the full-length DICER1 is visible above the DICER1O isoform. Each lane represents roughly 500 oocytes. (F) qPCR analysis of Dicer1 transcripts driven by MTC (O1) and MTA (O2) LTRs. Dicer1 expression is shown relative to Hprt.
Figure 6.
Figure 6.
Genome scanning by LTRs and emergence of new genes. (A) Transcription downstream from MuERV-L is apparent during ZGA, especially in two-cell embryos treated with aphidicolin (2Ca). Shown is a representative UCSC Genome Browser snapshot of an MuERV-L insertion expressed during ZGA. The gray horizontal lines represent five CPM. Stages: (GV) full-grown GV oocyte; (1C) one-cell (fertilized egg); (2C) two-cell; (4C) four-cell. (B) Cumulative display of transcription in 150-kb genomic flanks around the hundred MuERV-L elements most expressed during ZGA. (CF) UCSC Genome Browser snapshots of selected genomic loci with mapped NGS data (Abe et al. 2015; Karlic et al. 2017). Gray dashed lines indicate CPMs. Positions of repetitive sequences (DF) are indicated by gray rectangles in rows from the top: SINE, LINE, LTR, and DNA transposon elements. The conservation tracks (D,F) display homology with rat (top), rabbit, human, dog, and cow genomes. (C) A lncRNA gene with MuERV-L-derived 5′ exons and downstream exons from the genomic flank. (D) A new lncRNA gene formed by MaLR LTR insertions. The promoter and exon 1 come from an MTA solo LTR, exon 2 through exonization of an ORR1F solo LTR. (E) Examples of antisense pseudogene sequence rewiring yielding a lncRNA substrate for endosiRNAs where an MTB solo LTR was inserted into a locus already containing a pseudogene (Nme3) or a pseudogene (Dlgap5) was inserted into a locus already containing an MTA. (F) An example of a sense pseudogene (Speer4E pseudogene) rewiring yielding a CPAT positive transcript.
Figure 7.
Figure 7.
A solo MTD LTR contribution to de novo evolution of a protein-coding gene. (A) Genomic organization of the D6Ertd527e locus in Mus musculus and Mesocricetus auratus. Shown are UCSC Genome Browser snapshots of D6Ertd527e loci with mapped oocyte RNA NGS. The gray dashed lines indicate CPMs. Below the conservation track is the RepeatMasker track with MT LTR insertions in red, SINE insertions in green, and a large LINE-1 insert in blue. The conserved 3′ UTR region is framed. (B) CAG trinucleotide density in MTD-driven transcripts in mice, rat, and hamster. Each CAG is represented by a vertical line. The widening depicts the coding sequence; the initiation codon is in the MTD exon. (C) Virtual translation of MTD-driven D6Ertd527e transcripts from rodent species (black) and mouse strains (blue). The phylogenetic tree was adopted from Nellaker et al. (2012). (D) D6ERTD527E protein expression in NIH3T3 cells. Transiently transfected cells expressing C-terminally HA-tagged D6ERTD527E or N-terminally HA-tagged PACT (control) were analyzed 48 h post-transfection by immunoblotting. (E) Ectopically expressed C-terminally HA-tagged D6ERTD527E protein (red) has cytoplasmic localization in mouse NIH3T3 cells. DNA (blue) was stained with DAPI. Untransfected cells lacking the HA signal demonstrate staining specificity. Scale bar, 10 μm.

Similar articles

Cited by

References

    1. Abe K, Yamamoto R, Franke V, Cao M, Suzuki Y, Suzuki MG, Vlahovicek K, Svoboda P, Schultz RM, Aoki F. 2015. The first murine zygotic transcription is promiscuous and uncoupled from splicing and 3′ processing. EMBO J 34: 1523–1537. - PMC - PubMed
    1. Bénit L, De Parseval N, Casella JF, Callebaut I, Cordonnier A, Heidmann T. 1997. Cloning of a new murine endogenous retrovirus, MuERV-L, with strong similarity to the human HERV-L element and with a gag coding sequence closely related to the Fv1 restriction gene. J Virol 71: 5652–5657. - PMC - PubMed
    1. Blum ES, Schwendeman AR, Shaham S. 2013. PolyQ disease: misfiring of a developmental cell death program? Trends Cell Biol 23: 168–174. - PMC - PubMed
    1. Chen L, DeVries AL, Cheng CH. 1997a. Convergent evolution of antifreeze glycoproteins in Antarctic notothenioid fish and Arctic cod. Proc Natl Acad Sci 94: 3817–3822. - PMC - PubMed
    1. Chen L, DeVries AL, Cheng CH. 1997b. Evolution of antifreeze glycoprotein gene from a trypsinogen gene in Antarctic notothenioid fish. Proc Natl Acad Sci 94: 3811–3816. - PMC - PubMed

Publication types