

Discrimination between Glioma Grades II and III Using Dynamic Susceptibility Perfusion MRI: A Meta-Analysis
- PMID: 28522666
- PMCID: PMC7959917
- DOI: 10.3174/ajnr.A5218
Discrimination between Glioma Grades II and III Using Dynamic Susceptibility Perfusion MRI: A Meta-Analysis
Abstract
Background: DSC perfusion has been evaluated in the discrimination between low-grade and high-grade glioma but the diagnostic potential to discriminate beween glioma grades II and III remains unclear.
Purpose: Our aim was to evaluate the diagnostic accuracy of relative maximal CBV from DSC perfusion MR imaging to discriminate glioma grades II and III.
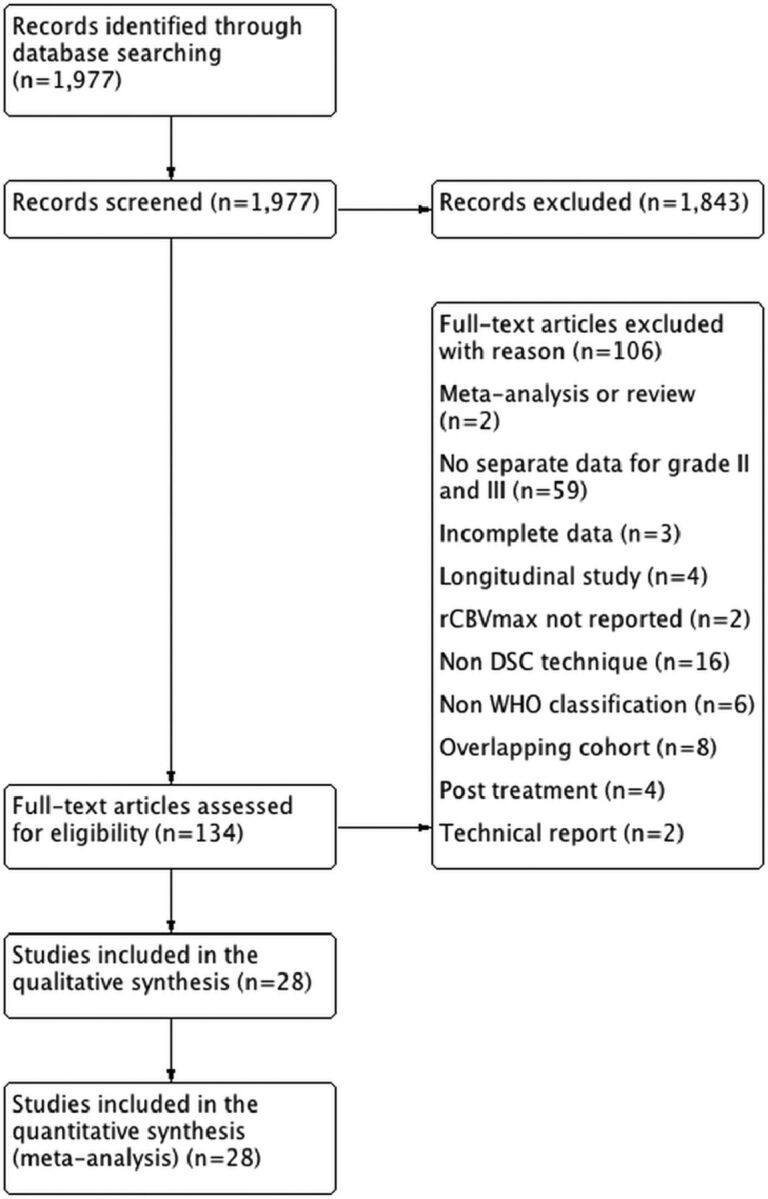
Data sources: A systematic literature search was performed in PubMed/MEDLINE, Embase, Web of Science, and ClinicalTrials.gov.
Study selection: Eligible studies reported on patients evaluated with relative maximal CBV derived from DSC with a confirmed neuropathologic diagnosis of glioma World Health Organization grades II and III. Studies reporting on mean or individual patient data were considered for inclusion.
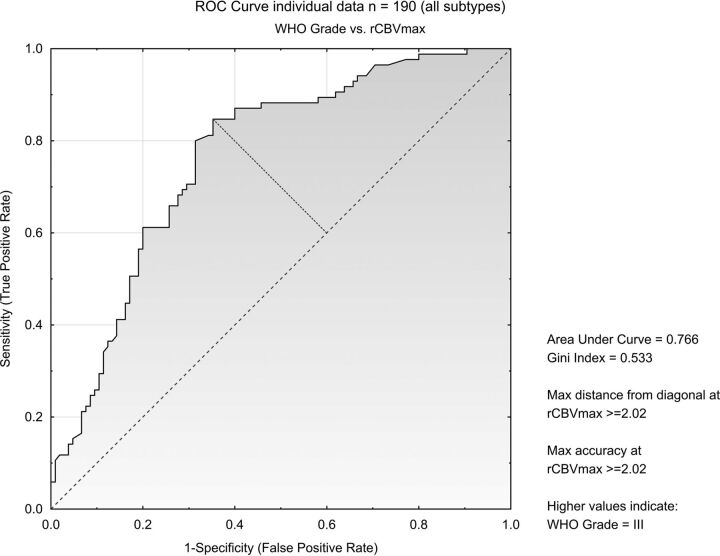
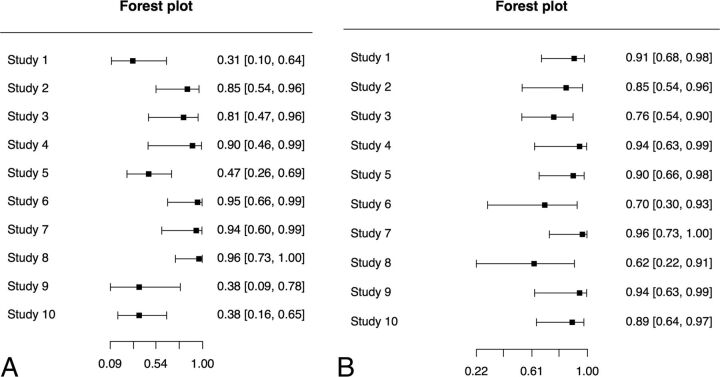
Data analysis: Data were analyzed by using inverse variance with the random-effects model and receiver operating characteristic curves describing optimal cutoffs and areas under the curve. Bivariate diagnostic random-effects meta-analysis was used to calculate diagnostic accuracy.
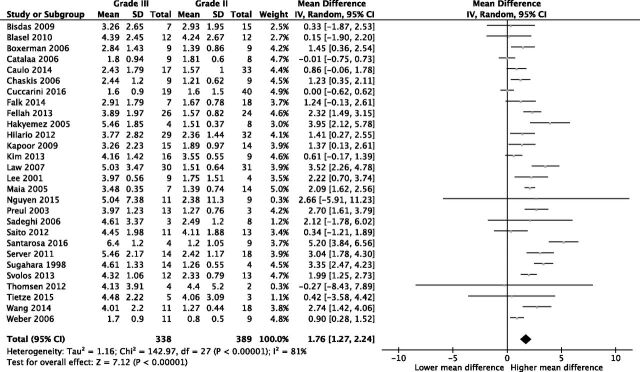
Data synthesis: Twenty-eight studies evaluating 727 individuals were included in the meta-analysis. Individual data were available from 10 studies comprising 190 individuals. The mean difference of relative maximal CBV between glioma grades II and III (n = 727) was 1.76 (95% CI, 1.27-2.24; P < .001). Individual patient data (n = 190) had an area under the curve of 0.77 for discriminating glioma grades II and III at an optimal cutoff of 2.02. When we analyzed astrocytomas separately, the area under the curve increased to 0.86 but decreased to 0.61 when we analyzed oligodendrogliomas.
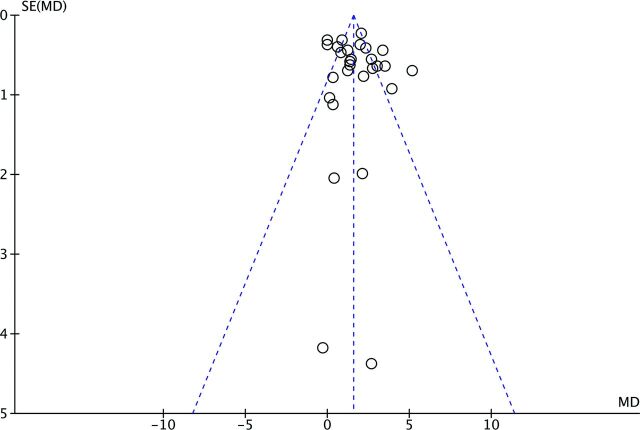
Limitations: A substantial heterogeneity was found among included studies.
Conclusions: Glioma grade III had higher relative maximal CBV compared with glioma grade II. A high diagnostic accuracy was found for all patients and astrocytomas; however, the diagnostic accuracy was substantially reduced when discriminating oligodendroglioma grades II and III.
© 2017 by American Journal of Neuroradiology.
Figures

Similar articles
-
Comparison of the Diagnostic Accuracy of DSC- and Dynamic Contrast-Enhanced MRI in the Preoperative Grading of Astrocytomas.AJNR Am J Neuroradiol. 2015 Nov;36(11):2017-22. doi: 10.3174/ajnr.A4398. Epub 2015 Jul 30. AJNR Am J Neuroradiol. 2015. PMID: 26228886 Free PMC article.
-
Amide proton transfer imaging to discriminate between low- and high-grade gliomas: added value to apparent diffusion coefficient and relative cerebral blood volume.Eur Radiol. 2017 Aug;27(8):3181-3189. doi: 10.1007/s00330-017-4732-0. Epub 2017 Jan 23. Eur Radiol. 2017. PMID: 28116517 Free PMC article.
-
Static 18F-FET PET and DSC-PWI based on hybrid PET/MR for the prediction of gliomas defined by IDH and 1p/19q status.Eur Radiol. 2021 Jun;31(6):4087-4096. doi: 10.1007/s00330-020-07470-9. Epub 2020 Nov 19. Eur Radiol. 2021. PMID: 33211141
-
Discrimination between primary low-grade and high-grade glioma with 11C-methionine PET: a bivariate diagnostic test accuracy meta-analysis.Br J Radiol. 2018 Feb;91(1082):20170426. doi: 10.1259/bjr.20170426. Epub 2018 Jan 22. Br J Radiol. 2018. PMID: 29206062 Free PMC article. Review.
-
Dynamic susceptibility MR perfusion in diagnosing recurrent brain metastases after radiotherapy: A systematic review and meta-analysis.J Magn Reson Imaging. 2020 Feb;51(2):524-534. doi: 10.1002/jmri.26812. Epub 2019 May 31. J Magn Reson Imaging. 2020. PMID: 31150144 Free PMC article.
Cited by
-
Advanced imaging in adult diffusely infiltrating low-grade gliomas.Insights Imaging. 2019 Dec 18;10(1):122. doi: 10.1186/s13244-019-0793-8. Insights Imaging. 2019. PMID: 31853670 Free PMC article. Review.
-
Impact of 18F-FET PET/MRI on Clinical Management of Brain Tumor Patients.J Nucl Med. 2022 Apr;63(4):522-527. doi: 10.2967/jnumed.121.262051. Epub 2021 Aug 5. J Nucl Med. 2022. PMID: 34353870 Free PMC article.
-
Exploring diagnostic performance of T2 mapping in diffuse glioma grading.Quant Imaging Med Surg. 2021 Jul;11(7):2943-2954. doi: 10.21037/qims-20-916. Quant Imaging Med Surg. 2021. PMID: 34249625 Free PMC article.
-
Tumor volume and calcifications as indicators for preoperative differentiation of grade II/III diffuse gliomas.J Neurooncol. 2023 Feb;161(3):555-562. doi: 10.1007/s11060-023-04244-3. Epub 2023 Feb 7. J Neurooncol. 2023. PMID: 36749444
-
Dynamic susceptibility contrast and diffusion MR imaging identify oligodendroglioma as defined by the 2016 WHO classification for brain tumors: histogram analysis approach.Neuroradiology. 2019 May;61(5):545-555. doi: 10.1007/s00234-019-02173-5. Epub 2019 Feb 2. Neuroradiology. 2019. PMID: 30712139
References
Publication types
MeSH terms
LinkOut - more resources
Full Text Sources
Other Literature Sources
Medical