. 2017 Jun 16;356(6343):eaam6393.
doi: 10.1126/science.aam6393. Epub 2017 May 18.

Resistance to malaria through structural variation of red blood cell invasion receptors

Affiliations

Resistance to malaria through structural variation of red blood cell invasion receptors

Ellen M Leffler et al. Science. .

Abstract

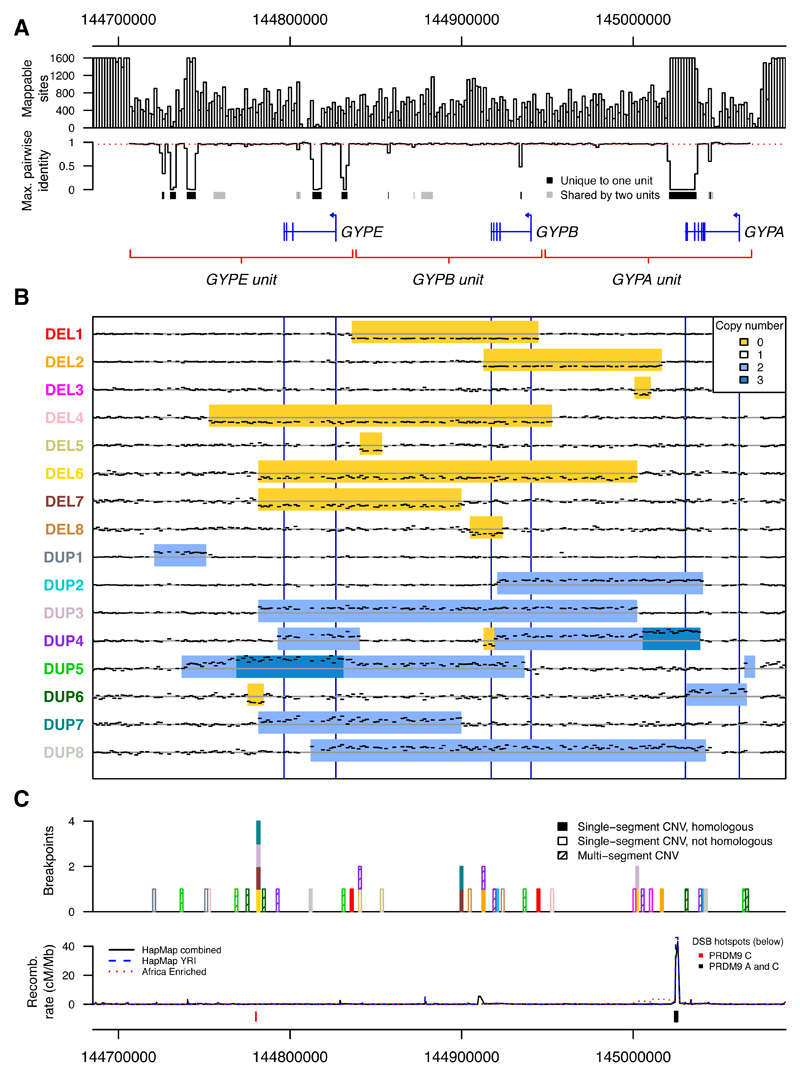
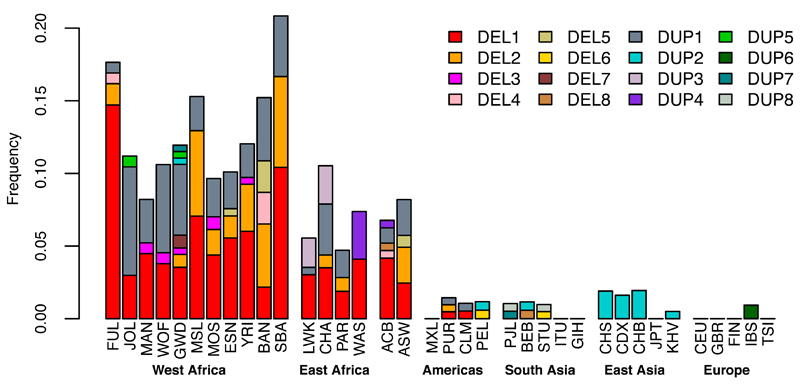
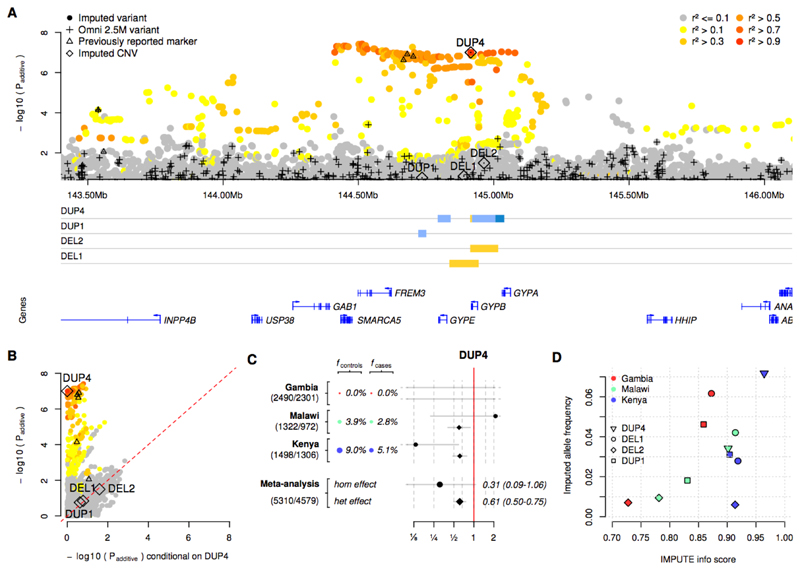
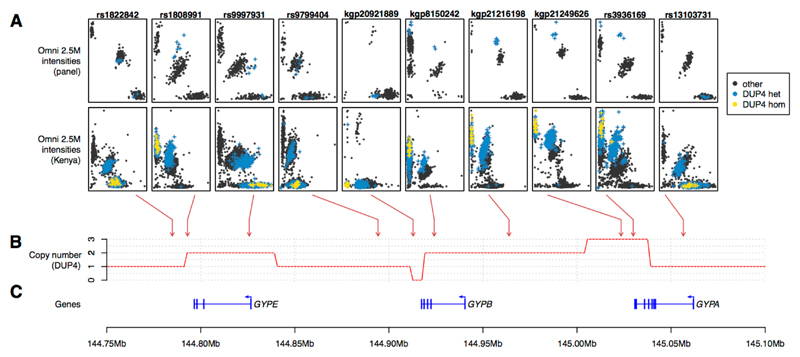
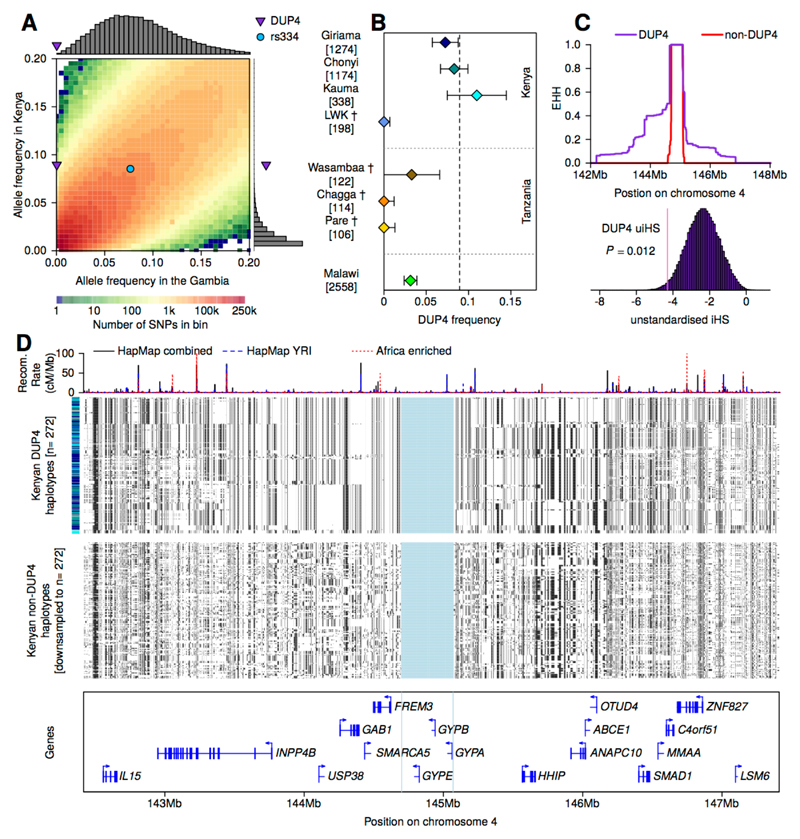
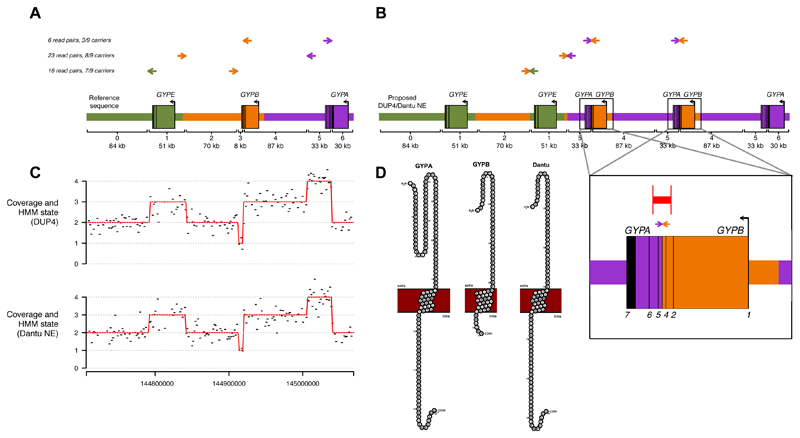
The malaria parasite Plasmodium falciparum invades human red blood cells by a series of interactions between host and parasite surface proteins. By analyzing genome sequence data from human populations, including 1269 individuals from sub-Saharan Africa, we identify a diverse array of large copy-number variants affecting the host invasion receptor genes GYPA and GYPB We find that a nearby association with severe malaria is explained by a complex structural rearrangement involving the loss of GYPB and gain of two GYPB-A hybrid genes, which encode a serologically distinct blood group antigen known as Dantu. This variant reduces the risk of severe malaria by 40% and has recently increased in frequency in parts of Kenya, yet it appears to be absent from west Africa. These findings link structural variation of red blood cell invasion receptors with natural resistance to severe malaria.


Figures

Fig. 1
Fig. 1. Copy number variants in the glycophorin region.
(A) Mappability in the glycophorin region. The number of mappable sites and the maximum pairwise identity between homologous locations in the segmental duplication are shown in 1600 bp windows. Pairwise identity is inferred from a multiple sequence alignment, with mean of 0.96 indicated with a red dashed line. The locations of protein-coding genes and the segmentally duplicated units are indicated below, with sequences of at least 100 bp that are unique to one or two out of the three segmentally duplicated units marked in black and gray, respectively. (B) Sequence coverage in 1600 bp windows and copy number for non-singleton CNVs. Black dashes show the mean normalized sequence coverage across heterozygous individuals not carrying another CNV. Only windows input to the HMM are shown. The inferred CNVs are indicated with deletion in yellow, duplication in light blue, and triplication in dark blue. A horizontal gray line indicates the expected coverage without copy number variation and blue vertical lines mark the locations of the three genes. (C) Positions of breakpoints, colored as the variant names in (B) and shaded by whether the variant has a single pair of homologous breakpoints, a single pair of non-homologous breakpoints, or is a multi-segment CNV. The recombination rate from LD-based recombination maps (52, 53) and locations of DSB hotspots (24) are annotated below.
Fig. 2
Fig. 2. Frequency of CNVs in the sampled populations.
Populations are grouped on the basis of geographical proximity; abbreviations can be found in Tables S1 and S3.
Fig. 3
Fig. 3. Evidence of association.
(A) The evidence for association at SNPs, short indels, and CNVs across the glycophorin region. P-values are computed under an additive model of association using meta-analysis across the three African populations included in our study. Points are colored by LD with DUP4 in east African reference panel populations. Directly typed SNPs are denoted with black plusses, and CNVs with diamonds. Black triangles represent SNPs where the association signal was previously reported and replicated in further samples. CNV copy number profiles, as in Fig. 1B, and protein-coding genes are shown below. (B) Comparison of unconditional association test P-values (y axis, as in panel (A)), and after additionally conditioning on genotypes at DUP4 (x axis). (C) The evidence for association at DUP4. Colored circles and text show the estimated allele frequency of DUP4 in population controls and severe malaria cases. To the right is the odds ratio and 95% confidence interval for DUP4 heterozygotes (diamonds) and homozygotes (circles) relative to non-carriers. The bottom two rows represent effect sizes computed by fixed-effect meta-analysis. Sample sizes (number of controls/number of cases) are denoted to the left. (D) Comparison of IMPUTE info score and expected imputed allele frequency for the four annotated CNVs.
Fig. 4
Fig. 4. The effect of DUP4 on SNP array intensities.
(A) Normalized Illumina Omni 2.5M intensity values at selected SNP assays across the glycophorin region for reference panel individuals (top row; N=367 individuals from Burkina Faso, Cameroon, and Tanzania) and Kenyan GWAS individuals (second row, N = 3,142). Blue and yellow points represent individuals heterozygous or homozygous for DUP4 respectively, as determined by the HMM in reference panel individuals and by imputation in Kenya (genotypes with posterior probability at least 0.75). Arrows denote the mapping location of these SNPs. (B) The copy number profile of DUP4. (C) Position of the glycophorin genes and exons.
Fig. 5
Fig. 5. DUP4 frequency and haplotype homozygosity.
(A) The empirical joint allele-frequency spectrum for population controls in the Gambia and Kenya, in 0.5% frequency bins between 0 and 20%. The frequencies of DUP4 and rs334 are highlighted. Histograms show the frequency in the Gambia of SNPs in the DUP4 frequency bin in Kenya (8.5-9%, top) and the frequency in Kenya of SNPs in the DUP4 frequency bin in the Gambia (0-0.5%, right). (B) The estimated frequency of DUP4 in east African populations, shown with 95% confidence intervals and the number of haplotypes sampled. Estimates are from population controls in the GWAS or from the HMM genotype calls in the reference panel (daggers). The dotted vertical line denotes the overall frequency of DUP4 in Kenyan controls. (C) Extended haplotype homozygosity (EHH) computed outward from the glycophorin region for DUP4 haplotypes and non-DUP4 haplotypes in Kenya, after excluding other variants within the glycophorin region. Below, the empirical distribution of unstandardized iHS for all typed SNPs within 1% frequency of DUP4 in Kenyan controls, with empirical P-value annotated. (D) The 272 haplotypes imputed to carry DUP4 and a random sample of 272 non-DUP4 haplotypes in Kenya. Haplotypes in each panel are clustered on 1 Mb extending in either direction from the glycophorin region, which is shaded in blue. The bar on the left depicts the population for each haplotype with colors as in panel (B). Recombination rate estimates (52, 53) are shown above and protein-coding genes below.
Fig. 6
Fig. 6. The structure of DUP4.
(A) Discordant read pairs mapped near DUP4 copy number changes. Colored arrows represent read pairs from DUP4 carriers, with paired reads shown on the same horizontal line and the direction of the arrows depicting the strand and position as mapped to the human reference sequence. The number of such read pairs and distinct carriers is given to the left. A schematic of the reference sequence is below with colors indicating the segmentally duplicated units. Brackets delineate segments with different copy number in DUP4, numbered and labeled with their length to the nearest kb. (B) The structure of DUP4, inferred by connecting sequence at breakpoints based on sequence homology and discordant read pairs. Arrows depict the concordant positions of the read pairs in (A) on this structure, and the order of reference segments is shown below. Inset: detail of the inferred GYPB-A hybrid genes, indicating the positions of discordant read pairs (arrows), PCR primers (vertical red lines) and the resulting product (horizontal red line). (C) Normalized coverage in 1600 bp windows (black) and HMM path (red) for a DUP4 carrier (top) and for an individual serotyped as Dantu+ (NE type; bottom), on the same x axis as (A). (D) Protein sequences of GYPA, GYPB, and the Dantu hybrid within the cell membrane depicting the extracellular, transmembrane, and intracellular domains as visualised with protter (54).

Comment in

Similar articles

Cited by

References

    1. Miller LH, Baruch DI, Marsh K, Doumbo OK. The pathogenic basis of malaria. Nature. 2002;415:673–679. - PubMed
    1. World Health Organization. World Malaria Report. 2015
    1. Cowman AF, Crabb BS. Invasion of red blood cells by malaria parasites. Cell. 2006;124:755–766. - PubMed
    1. Langhi DM, Jr, Bordin JO. Duffy blood group and malaria. Hematology. 2006;11:389–398. - PubMed
    1. Gaur D, Mayer DC, Miller LH. Parasite ligand-host receptor interactions during invasion of erythrocytes by Plasmodium merozoites. Int J Parasitol. 2004;34:1413–1429. - PubMed

Publication types