. 2017 May 18;7(1):2124.
doi: 10.1038/s41598-017-02395-8.

Plasmonics Enhanced Smartphone Fluorescence Microscopy

Affiliations

Plasmonics Enhanced Smartphone Fluorescence Microscopy

Qingshan Wei et al. Sci Rep. .

Abstract

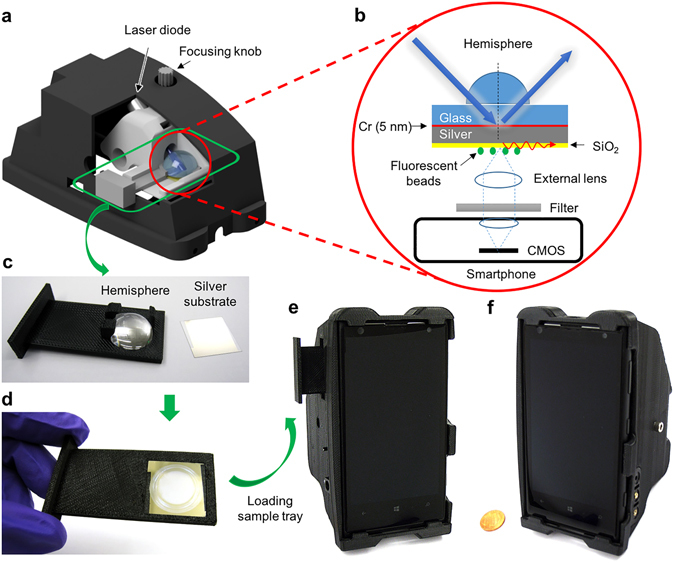
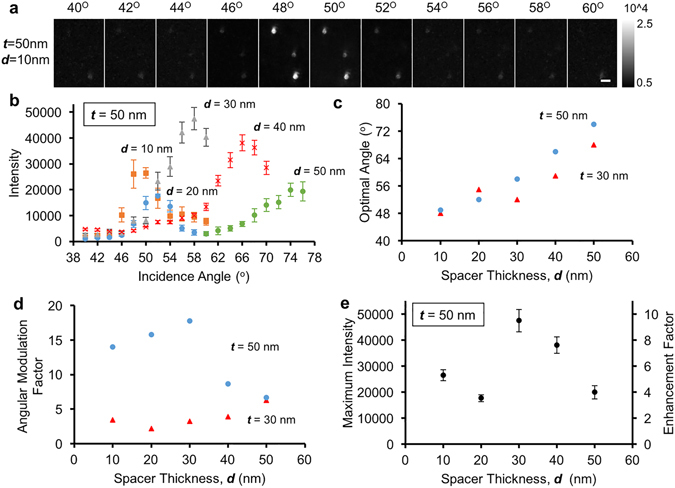
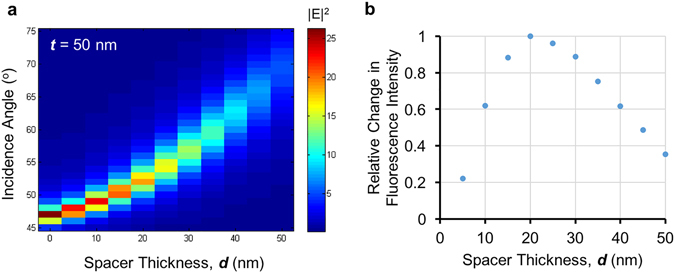
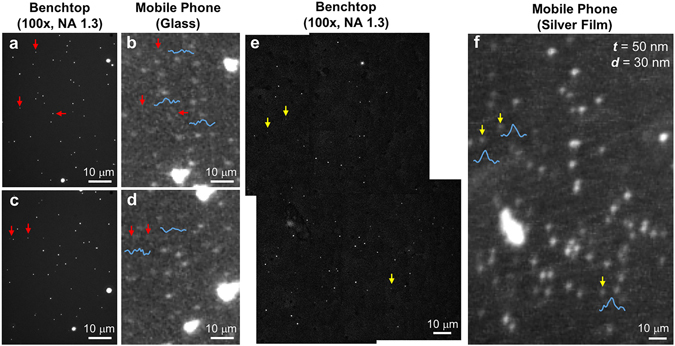
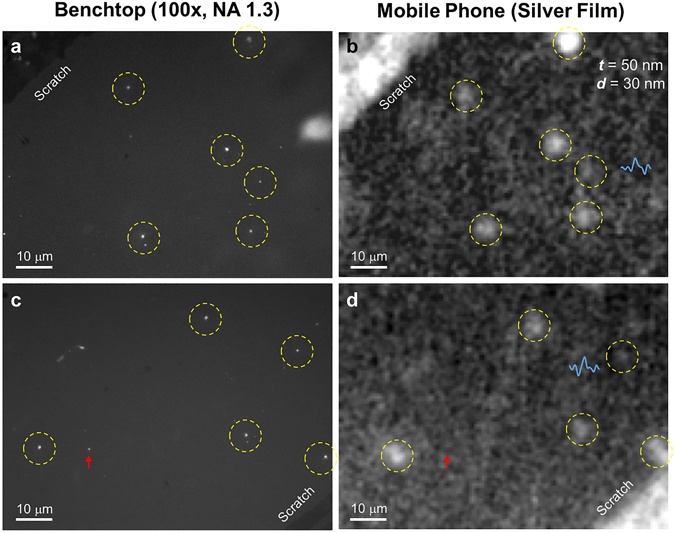
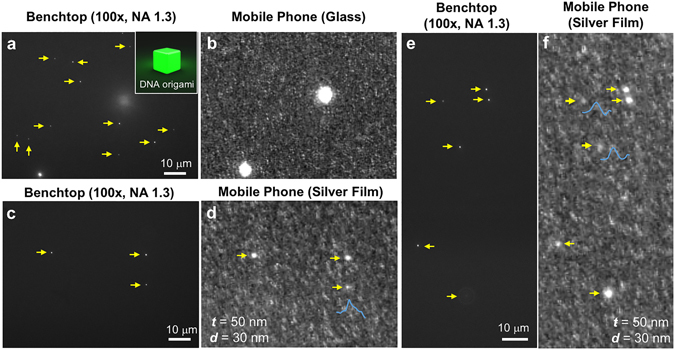
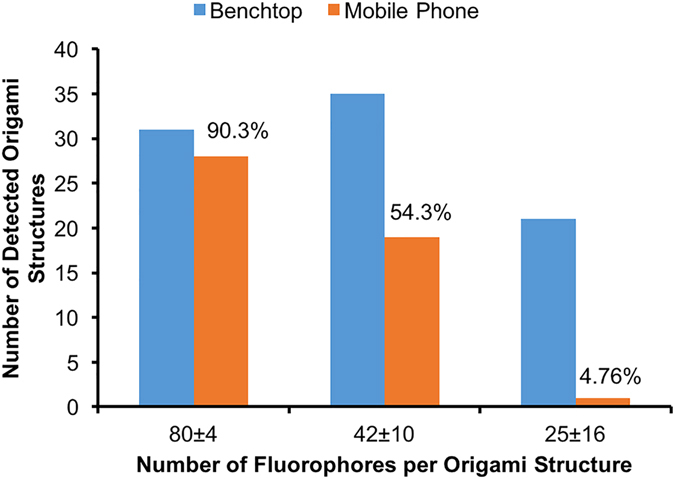
Smartphone fluorescence microscopy has various applications in point-of-care (POC) testing and diagnostics, ranging from e.g., quantification of immunoassays, detection of microorganisms, to sensing of viruses. An important need in smartphone-based microscopy and sensing techniques is to improve the detection sensitivity to enable quantification of extremely low concentrations of target molecules. Here, we demonstrate a general strategy to enhance the detection sensitivity of a smartphone-based fluorescence microscope by using surface-enhanced fluorescence (SEF) created by a thin metal-film. In this plasmonic design, the samples are placed on a silver-coated glass slide with a thin spacer, and excited by a laser-diode from the backside through a glass hemisphere, generating surface plasmon polaritons. We optimized this mobile SEF system by tuning the metal-film thickness, spacer distance, excitation angle and polarization, and achieved ~10-fold enhancement in fluorescence intensity compared to a bare glass substrate, which enabled us to image single fluorescent particles as small as 50 nm in diameter and single quantum-dots. Furthermore, we quantified the detection limit of this platform by using DNA origami-based brightness standards, demonstrating that ~80 fluorophores per diffraction-limited spot can be readily detected by our mobile microscope, which opens up new opportunities for POC diagnostics and sensing applications in resource-limited-settings.


Conflict of interest statement

The authors declare that they have no competing interests.

Figures

Figure 1
Figure 1
Illustrations and photographs of our mobile phone SEF microscopy device. (a) 3D illustration of the smartphone attachment with the cutaway view of the inner sample stage. (b) Schematic of the Kretschmann configuration implemented in the smartphone attachment. (c,d) Photographs of the hemisphere-embedded sample tray and silver thin film substrate, before (c) and after (d) loading of the silver-coated substrate onto the hemisphere. (e,f) Photographs of the final prototype device from different perspective views.
Figure 2
Figure 2
Optimization of the fluorescence enhancement properties of silver thin films. (a) Representative angle-dependent mobile phone images of 100 nm fluorescent beads prepared on a 50 nmAg/10 nmSiO2 film. Scale bar: 10 μm. (b) The effect of the spacer thickness on the fluorescence intensity angular spectra, for the case of 50 nm silver film. (c) The relationship of the optimal incidence angle and the spacer thickness. (d) The angular modulation factor as a function of the spacer thickness. The excitation angles for different spacer distances correspond to the optimal illumination angles as shown in (c). (e) Maximum fluorescence intensity for t = 50 nm (left y-axis) and the corresponding fluorescence enhancement factor (right y-axis) as a function of the spacer thickness.
Figure 3
Figure 3
Numerical simulation of surface-enhanced fluorescence in close proximity of a thin silver film. (a) Numerical simulation of the electric field intensity at the SiO2-air interface, corresponding to 50 nm silver-coated substrates as a function of the incidence angle and the spacer distance under 470 nm illumination. (b) Simulated relative change in fluorescence intensity of a fluorophore in the vicinity of a 50 nm thick silver film as a function of the spacer distance.
Figure 4
Figure 4
Imaging of individual 50 nm fluorescent beads using the smartphone SEF microscope. (ad) Control experiments by imaging the 50 nm fluorescent bead samples with a benchtop microscope (a,c) and a previous mobile phone microscopy device using glass substrates (b,d), respectively. Some examples of missed 50 nm particles by the glass-based mobile phone imaging device are highlighted by red arrows, and the corresponding intensity line scans shown in blue curves. (e,f) Detection of individual 50 nm particles by the newly developed mobile phone SEF imaging device (f); the same field-of-view was also imaged by a conventional benchtop microscope (e), 4 images stitched together. Yellow arrows indicate some examples of the detected 50 nm particles and blue curves show their corresponding intensity line scans.
Figure 5
Figure 5
Imaging of single QDs with our smartphone-based SEF microscope. (a,c) Single QDs imaged by a conventional benchtop microscope. (b,d) Same regions of interest imaged by the mobile SEF microscope, where the yellow dashed circles highlight the successful detection of single QDs on the mobile phone, and the red arrow represents a missed detection. Two intensity line scans, corresponding to weaker QDs, are also shown (blue curves).
Figure 6
Figure 6
Imaging of single DNA origami nanobeads labeled with 80 ± 4 fluorophores, each. (a,b) Control experiments for imaging the DNA origami nanobeads using a glass-based mobile phone microscope (b), and the same region of interest imaged by a benchtop microscope (a). A schematic illustration of a fluorescent DNA origami nanobead is shown in the inset of (a). (cf) Detection of single 80-fluorophore DNA origami nanobeads with our smartphone-based SEF microscope. The sample was imaged by both a benchtop microscope (c,e) and our smartphone-based SEF microscope (d,f) to validate the detection of single DNA origami nanobeads. DNA origami nanobeads are highlighted by the yellow arrows and the intensity line scans of three weaker ones are also shown (blue curves). In (e) the bottom yellow arrow points to an out-of-focus fluorescent origami structure.
Figure 7
Figure 7
Detection efficiency of different DNA origami nanobeads labeled with 80 ± 4, 42 ± 10, and 25 ± 16 fluorophores by the smartphone SEF microscope. The detection efficiency was calculated by dividing the number of detected origami nanobeads using the mobile phone SEF microscope by the total number that is detected with a benchtop microscope over the same region of interests.

References

    1. Vashist SK, Mudanyali O, Schneider EM, Zengerle R, Ozcan A. Cellphone-based devices for bioanalytical sciences. Anal. Bioanal. Chem. 2014;406:3263–3277. doi: 10.1007/s00216-013-7473-1. - DOI - PMC - PubMed
    1. Ozcan A. Mobile phones democratize and cultivate next-generation imaging, diagnostics and measurement tools. Lab Chip. 2014;14:3187–3194. doi: 10.1039/C4LC00010B. - DOI - PMC - PubMed
    1. Preechaburana P, Suska A, Filippini D. Biosensing with cell phones. Trends Biotechnol. 2014;32:351–355. doi: 10.1016/j.tibtech.2014.03.007. - DOI - PubMed
    1. Erickson D, et al. Smartphone technology can be transformative to the deployment of lab-on-chip diagnostics. Lab Chip. 2014;14:3159–3164. doi: 10.1039/C4LC00142G. - DOI - PMC - PubMed
    1. Vashist SK, Luppa PB, Yeo LY, Ozcan A, Luong JHT. Emerging technologies for next-generation point-of-care testing. Trends Biotechnol. 2015;33:692–705. doi: 10.1016/j.tibtech.2015.09.001. - DOI - PubMed

Publication types

MeSH terms