. 2017 May 18;7(1):2070.
doi: 10.1038/s41598-017-02311-0.

The Fragment HMGA2-sh-3p20 from HMGA2 mRNA 3'UTR Promotes the Growth of Hepatoma Cells by Upregulating HMGA2

Affiliations

The Fragment HMGA2-sh-3p20 from HMGA2 mRNA 3'UTR Promotes the Growth of Hepatoma Cells by Upregulating HMGA2

Yuan Wang et al. Sci Rep. .

Abstract

High mobility group A2 (HMGA2) plays a crucial role in the development of cancer. However, the mechanism by which HMGA2 promotes the growth of hepatocellular carcinoma (HCC) remains unclear. Here, we explore the hypothesis that HMGA2 may enhance the growth of hepatoma cells through a fragment based on the secondary structure of HMGA2 mRNA 3'-untranslated region (3'UTR). Bioinformatics analysis showed that HMGA2 mRNA displayed a hairpin structure within its 3'UTR, termed HMGA2-sh. Mechanistically, RNA immunoprecipitation assays showed that the microprocessor Drosha or DGCR8 interacted with HMGA2 mRNA in hepatoma cells. Then, Dicer contributes to the generation of the fragment HMGA2-sh-3p20 from the HMGA2-sh. HMGA2-sh-3p20 was screened by PCR analysis. Interestingly, HMGA2-sh-3p20 increased the expression of HMGA2 through antagonizing the tristetraprolin (TTP)-mediated degradation of HMGA2. HMGA2-sh-3p20 inhibited the expression of PTEN by targeting the 3'UTR of PTEN mRNA. In addition, the overexpression of PTEN could downregulate HMGA2 expression. Significantly, we documented the ability of HMGA2-sh-3p20 to promote the growth of hepatoma cells in vitro and in vivo. Thus, we conclude that the fragment HMGA2-sh-3p20 from HMGA2 mRNA 3'UTR promotes the growth of hepatoma cells by upregulating HMGA2. Our finding provides new insights into the mechanism by which HMGA2 enhances hepatocarcinogenesis.


Conflict of interest statement

The authors declare that they have no competing interests.

Figures
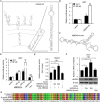
Figure 1
Figure 1
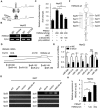
A hairpin within HMGA2 mRNA 3′UTR has regulatory function. (A) The secondary structure of HMGA2 3′UTR was analyzed by using RNAstructure. (B) The promoter activities of AP-1 and NF-κB were examined by luciferase reporter gene assays in 293T cells. (C) The secondary structure of HMGA2-sh-mut with cripple of HMGA2-sh sequence was analyzed by using RNAstructure. (D) The promoter activities of AP-1 and NF-κB were measured by luciferase reporter gene assays in 293T cells. (E) The luciferase activities of pGL3-HMGA2 were determined by luciferase reporter gene assays in HepG2 cells. (F) The expression of HMGA2 was assessed by qRT-PCR and Western blot analysis in Huh7 cells. (G) The sequence alignment of HMGA2-sh in different species was analyzed by the software of CLC sequence viewer 6.3. Every experiment was repeated three times. Error bars represent s.d. (n = 3), **p < 0.01; ***p < 0.001 and not significant (NS), Student’s t test.
Figure 2
Figure 2
A fragment, HMGA2-sh-3p20, is cleaved from HMGA2-sh by Drosha/DGCR8 complex and Dicer. (A) The diagram of the interaction between Drosha/DGCR8 and the hairpin structure. (B) Drosha (or DGCR8) RIP-PCR of HMGA2 mRNA in HepG2 cells. (C) Effect of si-Dicer on luciferase activities of HMGA2-sh-mediated pGL3-HMGA2 was measured by luciferase reporter gene assays in HepG2 cells. (D) The diagram shows the predicted miRNAs targeting pGL-HMGA2. (E) Effect of si-Dicer on the expression of miR-590, miR-410, miR-150, miR-132/212, miR-145 and miR-186 was examined by qRT-PCR in HepG2 cells. (F) The diagram shows the designed primers for fragments derived from HMGA2-sh. (G) The fragments were screened by RT-PCR using designed primers in HMGA2-sh-overexpressed 293T cells. NC, purified water; Mock, without plasmid DNA; Vector presents empty plasmid DNA. The full bands images are given as Supplementary Fig. S6. (H) The identified fragment, HMGA2-sh-20, was validated by qRT-PCR analysis in HepG2 cells transiently transfected with HMGA2-sh. Every experiment was repeated three times. Error bars represent s.d. (n = 3), **p < 0.01; ***p < 0.001, Student’s t test.
Figure 3
Figure 3
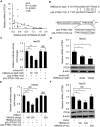
HMGA2-sh-3p20 upregulates HMGA2 by blocking the TTP-mediated degradation of HMGA2 mRNA. (A) The relative expression of HMGA2-sh-3p20 was assessed by qRT-PCR in 35 pairs of clinical HCC tissues and corresponding peritumor tissues (***P < 0.001; Wilcoxon’s signed-rank test). (B) The correlation between HMGA2 mRNA levels and HMGA2-sh-3p20 levels was measured by qRT-PCR in 30 cases of clinical HCC tissues (**P < 0.01, r = 0.586; Pearson’s correlation coefficient). (C) The luciferase activities of pGL3-HMGA2 were examined by luciferase reporter gene assays in HepG2 cells. (D) The expression of HMGA2 was assessed by qRT-PCR and Western blot analysis in Huh7 cells. (E) The diagram of TTP-mediated mRNA degradation. (F) The diagram of HMGA2-sh-3p20 antagonizes the interaction of TTP with non-hairpin within 3′UTR of HMGA2 mRNA. (G) TTP RIP-PCR of HMGA2 in HepG2 cells. (H) Effect of TTP on the expression of HMGA2 was measured by qRT-PCR and Western blot analysis in HepG2 cells. (I) Effect of HMGA2-sh-3p20 on the expression of TTP-mediated HMGA2 was assessed by qRT-PCR and Western blot analysis in HepG2 cells. The full length blots images are given as Supplementary Fig. S7. (J) TTP RIP-qPCR of HMGA2 in HepG2 cells transfected with HMGA2-sh-3p20. (K) Effect of HMGA2-sh-3p20 on the levels of HMGA2 mRNA in HepG2 cells transfected with si-TTP by qRT-PCR. (L,M) Effect of HMGA2-sh-3p20 on the half-life of HMGA2 mRNA in HepG2 cells (L) or HepG2 cells transfected with si-TTP (M) by qRT-PCR. Every experiment was repeated three times. Error bars represent s.d. (n = 3), **p < 0.01; ***p < 0.001 and not significant (NS), Student’s t test.
Figure 4
Figure 4
HMGA2-sh-3p20 inhibits PTEN by targeting the 3′UTR of PTEN mRNA. (A) The correlation between the levels of PTEN mRNA and HMGA2-sh-3p20 was examined by qRT-PCR in 26 cases of clinical HCC tissues (**P < 0.01, r = −0.571; Pearson’s correlation coefficient). (B) A model of predicted HMGA2-sh-3p20 binding site at nucleotides 1702-1722 of the PTEN 3′UTR (pGL3-PTEN-1702) and the mutant of pGL3-PTEN-1702. (C) Effect of HMGA2-sh-3p20 on the luciferase activities of pGL3-PTEN-1702 and pGL3-PTEN-1702-mut were measured by luciferase reporter gene assays in HepG2 cells. (D) Effect of HMGA2-sh-3p20 on the expression of PTEN was assessed by qRT-PCR and Western blot analysis in HepG2 cells. (E) Effect of HMGA2-sh on the luciferase activities of pGL3-PTEN-1702 and pGL3-PTEN-1702-mut were examined by luciferase reporter gene assays in HepG2 cells. (F) Effect of HMGA2-sh on the expression of PTEN was measured by qRT-PCR and Western blot analysis in HepG2 cells. Every experiment was repeated three times. Error bars represent s.d. (n = 3), **p < 0.01; ***p < 0.001 and not significant (NS), Student’s t test.
Figure 5
Figure 5
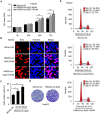
HMGA2-sh-3p20 contributes to the proliferation of hepatoma cells in vitro. (A) Effect of HMGA2-sh-3p20 on proliferation of HepG2 cells was determined by MTT assays. (B,C) Effect of HMGA2-sh-3p20 on proliferation of HepG2 cells was measured by EdU incorporation assays. (D) Effect of HMGA2-sh-3p20 on proliferation of HepG2 cells was assessed by colony-formation assays. (E) Effect of HMGA2-sh-3p20 on proliferation of HepG2 cells was tested by flow cytometry assays. Every experiment was repeated three times. Error bars represent s.d. (n = 3), **p < 0.01; ***p < 0.001 and not significant (NS), Student’s t test.
Figure 6
Figure 6
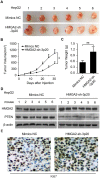
HMGA2-sh-3p20 contributes to the growth of hepatoma cells in vivo. (A) Photographs of dissected tumors from nude mice tumor transplanted with HepG2 cells pretreated with HMGA2-sh-3p20 or Mimics. (B) Growth curve of tumors from experimental groups of nude mice. (C) The average weight of tumors from experimental groups of nude mice. (D) Protein expression levels of HMGA2 and PTEN were examined by Western blot analysis in the tumor tissues from mice. (E) The expression levels of Ki67 were detected by IHC staining in the tumor tissues from mice.
Figure 7
Figure 7
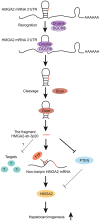
A model shows that the fragment HMGA2-sh-3p20 from HMGA2 mRNA 3′UTR promotes the growth of hepatoma cells by upregulating HMGA2. Bioinformatics analysis shows that 3′UTR of HMGA2 mRNA contains the hairpin structure (HMGA2-sh). Drosha and DGCR8 cleave the HMGA2-sh from the 3′UTR of HMGA2 mRNA, and Dicer contributes to the generation of the HMGA2-sh-3p20 from the HMGA2-sh. Furthermore, HMGA2-sh-3p20 is able to increase the levels of HMGA2 by antagonizing TTP-mediated HMGA2 degradation, while it decreases PTEN by targeting 3′UTR of PTEN mRNA. In addition, the downregulated-PTEN is not able to depress the expression of HMGA2, leading to the upregulation of HMGA2. Functionally, HMGA2-sh-3p20-enhanced HMGA2 accelerates the growth of liver cancer cells.

Similar articles

Cited by

References

    1. Fusco A, Fedele M. Roles of HMGA proteins in cancer. Nat Rev Cancer. 2007;7:899–910. doi: 10.1038/nrc2271. - DOI - PubMed
    1. Hammond SM, Sharpless NE. HMGA2, microRNAs, and stem cell aging. Cell. 2008;135:1013–1016. doi: 10.1016/j.cell.2008.11.026. - DOI - PMC - PubMed
    1. Wu J, Wei JJ. HMGA2 and high-grade serous ovarian carcinoma. J Mol Med (Berl) 2013;91:1155–1165. doi: 10.1007/s00109-013-1055-8. - DOI - PubMed
    1. Wu J, et al. Elevated HMGA2 expression is associated with cancer aggressiveness and predicts poor outcome in breast cancer. Cancer Letters. 2016;376:284–292. doi: 10.1016/j.canlet.2016.04.005. - DOI - PubMed
    1. Singh I, et al. Hmga2 is required for canonical WNT signaling during lung development. BMC Biol. 2014;12:21. doi: 10.1186/1741-7007-12-21. - DOI - PMC - PubMed

Publication types

MeSH terms