. 2017 Apr 27;50(2):85-93.
doi: 10.1267/ahc.17011. Epub 2017 Apr 22.

In Situ Evaluation of Estrogen Receptor Dimers in Breast Carcinoma Cells: Visualization of Protein-Protein Interactions

Affiliations

In Situ Evaluation of Estrogen Receptor Dimers in Breast Carcinoma Cells: Visualization of Protein-Protein Interactions

Erina Iwabuchi et al. Acta Histochem Cytochem. .

Abstract

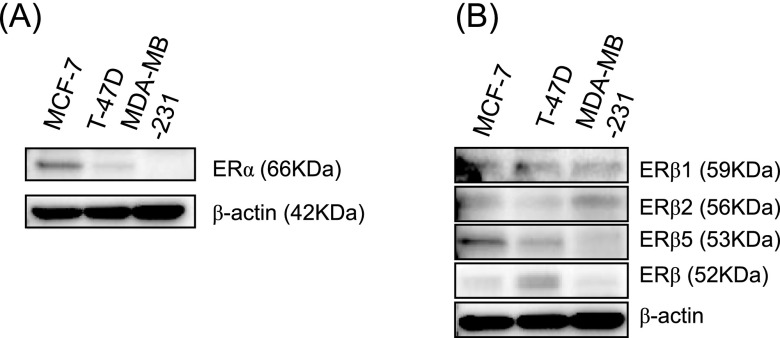
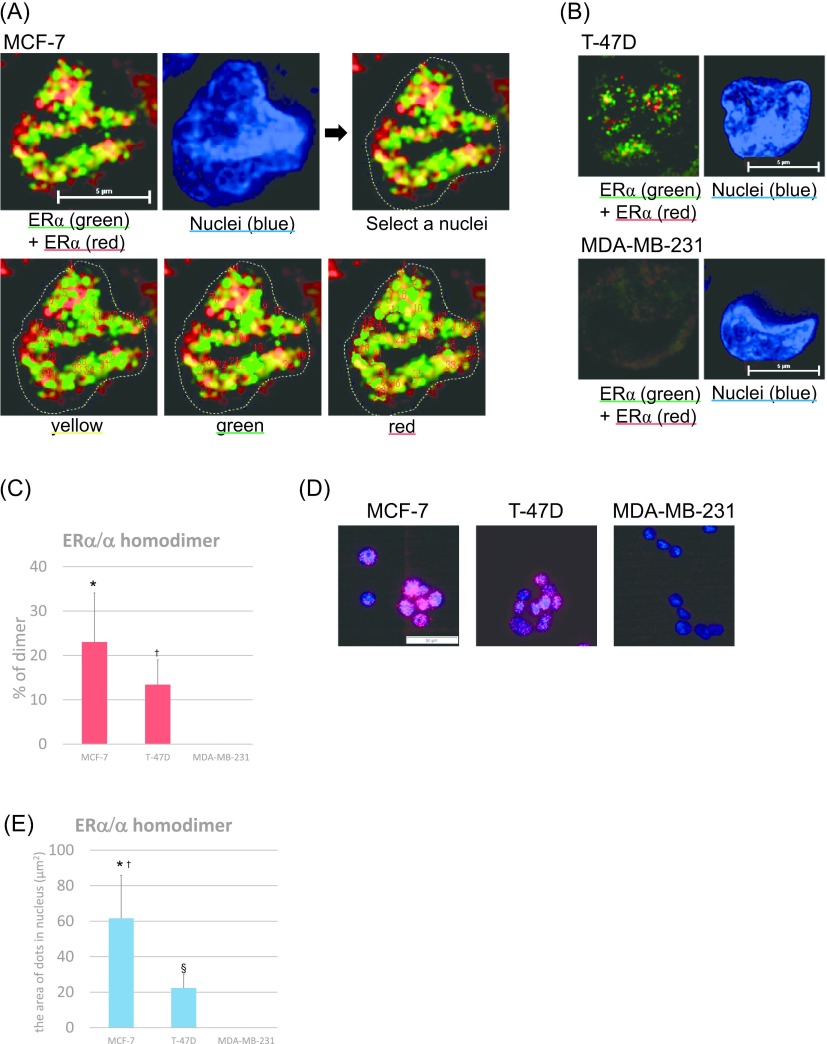
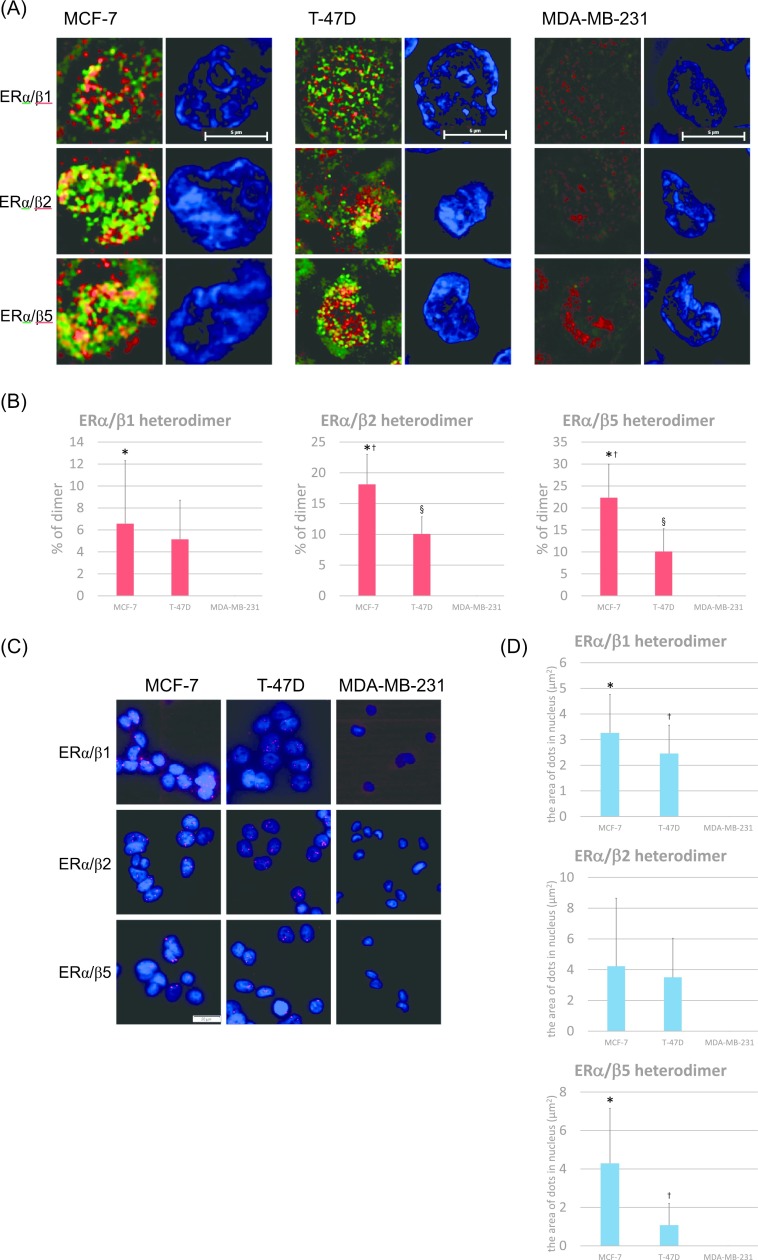
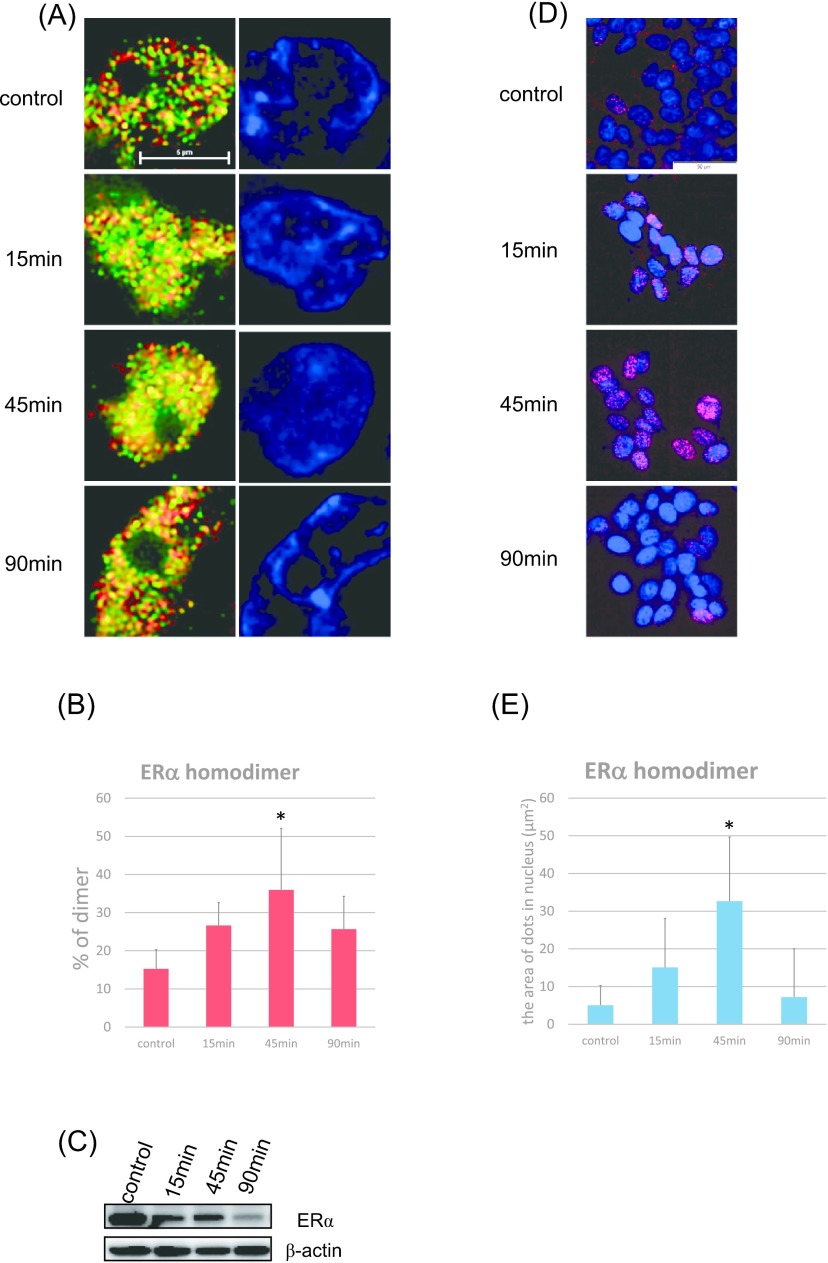
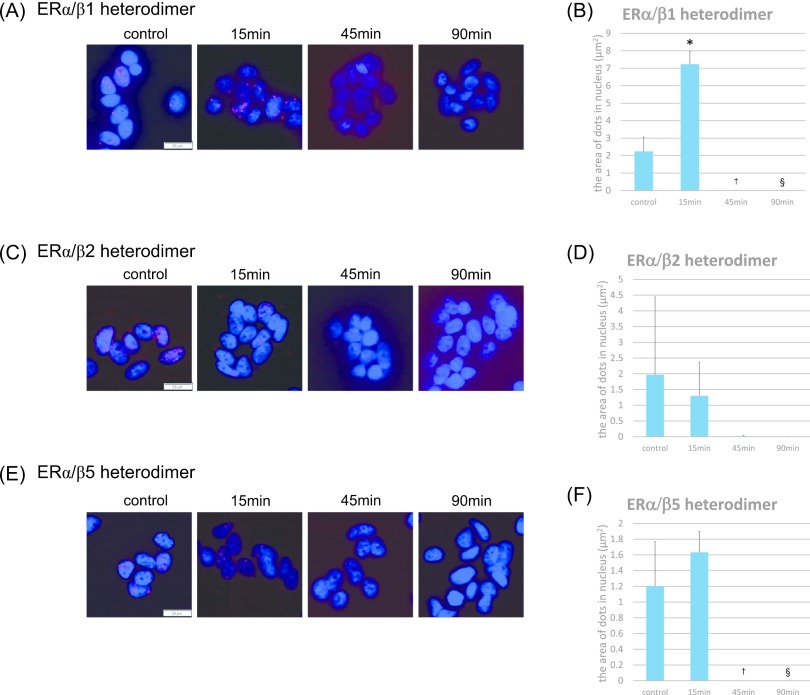
The estrogen receptor (ER) functions as a dimer and is involved in several different biological functions. However ER dimeric proteins have not been identified by in situ methodologies. Structured illumination microscopy (SIM) has been recently developed, which enabled the localization of protein and protein interaction. Therefore, in this study, we firstly demonstrated that ERs formed both homodimers and heterodimers in breast carcinoma cell lines using Nikon's SIM (N-SIM). ERα/α homodimers were detected in the nuclei of both ERα-positive MCF-7 and T-47D cells; 23.0% and 13.4% of ERα proteins formed ERα/α homodimers, respectively. ERα/β heterodimers were also detected in MCF-7 and T-47D. Approximately 6.6% of both ERα and ERβ1 proteins formed ERα/β1 heterodimers in MCF-7. In addition, 18.1% and 22.4% of ERα and ERβ proteins formed ERα/β2 heterodimers and ERα/β5 heterodimers in MCF-7, respectively. In addition, by using proximity ligation assay (PLA) in MCF-7, estradiol-induced ERα/α homodimers and ERα/β1 heterodimers were both detected after 15 to 45 min of treatment and at 15 min, respectively. The percentage of total ER proteins could also be determined using N-SIM. By using both methods, it has become possible to evaluate precise localization and ratio of ER dimers among different cell types.

Keywords: breast cancer; estrogen receptor dimer; protein-protein interaction; proximity ligation assay; structured illumination microscopy.


Figures

Fig. 1.
Fig. 1.
Immunoblotting analysis of ER proteins in breast cancer cells. (A) Expression of ERα proteins. β-actin functions as a control. (B) Expression of ERβ proteins. β-actin functions as a control.
Fig. 2.
Fig. 2.
Expression of ERα/α homodimers in breast carcinoma cells. (A) Detection of ERα homodimers using N-SIM in MCF-7 cells. Cells were double-stained for anti-ERα antibody clones 6F11 (Alexa Fluor 594: red) and SP-1 (Alexa Fluor 488: green). Homodimers are represented by the yellow areas, and nuclei are stained blue (DAPI). The areas of the yellow, green, and red signals respectively were analyzed as the yellow-green area by Lumina Vision (lower figures). Bar = 5 μm. (B) Detection of ERα homodimers using N-SIM in T-47D and MDA-MB-231 cells. Cells were double-immunostained for anti-ERα antibody clones 6F11 (Alexa Fluor 594: red) and SP-1 (Alexa Fluor 488: green). Bar = 5 μm. (C) The ratios of the ERα/α homodimer were quantified as the yellow area in the nuclei using Lumina Vision. *p = 0.0003 vs. MDA-MB-231, p = 0.0120 vs. MDA-MB-231 for the ERα/α homodimer. (D) Detection of ERα homodimers using PLA. Homodimers are represented by the red dots (Texas red), and nuclei are labeled blue (DAPI). Bar = 50 μm. (E) The number of ERα/α homodimers was quantified as the area of the dots in the nuclei using Lumina Vision. *p < 0.0001 vs. MDA-MB-231, p = 0.0012 vs. T-47D, §p = 0.0236 vs. MDA-MB-231 for the ERα/α homodimer.
Fig. 3.
Fig. 3.
Expression of ERα/β heterodimers in breast carcinoma cells. (A) Detection of ERα/β heterodimers using N-SIM in breast carcinoma cells. Cells were double-stained for anti-ERα antibody (Alexa Fluor 488: green) and anti-ERβ antibody (Alexa Fluor 488: green). Heterodimers were represented by the yellow areas, and nuclei stained blue (DAPI). Bar = 5 μm. (B) The ratios of ERα/β heterodimers were quantified as the yellow areas in the nuclei using Lumina Vision. *p = 0.0206 vs. MDA-MB-231 for the ERα/β1 heterodimer; *p < 0.0001 vs. MDA-MB-231, p = 0.0020 vs. T-47D, §p = 0.0004 vs. MDA-MB-231 for the ERα/β2 heterodimer; *p < 0.0001 vs. MDA-MB-231, p = 0.0034 vs. T-47D, §p = 0.0109 vs. MDA-MB-231 for the ERα/β5 heterodimer. (C) Detection of ERα/β heterodimers using PLA. Heterodimers were represented by the red dots (Texas red), and nuclei labeled blue (DAPI). Bar = 50 μm. (D) The number of ERα/β heterodimers was quantified as the area of the dots in the nuclei using Lumina Vision. *p = 0.0011 vs. MDA-MB-231, p = 0.0039 vs. MDA-MB-231 for the ERα/β1 heterodimer; *p = 0.0051 vs. MDA-MB-231, p = 0.0337 vs. T-47D for the ERα/β5 heterodimer.
Fig. 4.
Fig. 4.
Expression of the ERα/α homodimer induced by estradiol in MCF-7 cells and time comparison. (A) Detection of ERα homodimers using N-SIM. Cells were double-stained for anti-ERα antibody clones 6F11 (Alexa Fluor 594: red) and SP-1 (Alexa Fluor 488: green). Homodimers were represented by the yellow areas, and the nuclei labeled blue (DAPI). Bar = 5 μm. (B) The ratios of ERα/α homodimers were quantified as the yellow areas in the nuclei using Lumina Vision. *p = 0.0121 vs. control for the ERα/α homodimer. (C) Immunoblotting analysis of ERα proteins in breast carcinoma cells. β-actin functions as a control. (D) Detection of ERα homodimers using PLA. Homodimers were represented by the red dots (Texas red), and nuclei stained blue (DAPI). Bar = 50 μm. (E) The number of ERα/α homodimers was quantified as the area of the dots in the nuclei using Lumina Vision. *p = 0.0252 vs. control for the ERα/α homodimer.
Fig. 5.
Fig. 5.
Expression of ER dimers induced by estradiol in MCF-7 cells and time comparison. (A) Detection of ERα/β1 heterodimers using PLA. Homodimers were represented by the red dots (Texas red), and nuclei stained blue (DAPI). Bar = 50 μm. (B) The number of ERα/β1 heterodimers was quantified as the area of the dots in the nuclei using Lumina Vision. *p < 0.0001 vs. control, p = 0.0030 vs. control, §p = 0.0030 vs. control for the ERα/β1 heterodimer. (C) Detection of ERα/β2 heterodimers using PLA. Homodimers were represented by the red dots (Texas red), and nuclei labeled blue (DAPI). Bar = 50 μm. (D) The number of ERα/β2 heterodimers was quantified as the area of the dots in the nuclei using Lumina Vision. (E) Detection of ERα/β5 heterodimers using PLA. Homodimers were represented by the red dots (Texas red), and nuclei labeled blue (DAPI). Bar = 50 μm. (F) The number of ERα/β5 heterodimers was quantified as the area of the dots in the nuclei using Lumina Vision. *p = 0.0040 vs. control, p = 0.0040 vs. control for the ERα/β1 heterodimer.

Similar articles

Cited by

References

    1. Bai Y. and Giguére V. (2003) Isoform-selective interactions between estrogen receptors and steroid receptor coactivators promoted by estradiol and ErbB-2 signaling in living cells. Mol. Endocrinol. 17; 589–599. - PubMed
    1. Batmunkh B., Choijookhuu N., Srisowanna N., Byambatsogt U., Synn Oo. P., Noor Ali, M., Yamaguchi Y. and Hishikawa Y. (2017) Estrogen accelerates cell proliferation through estrogen receptor α during rat liver regeneration after partial hepatectomy. Acta Histochem. Cytochem. 50; 39–48. - PMC - PubMed
    1. Chantzi N. I., Tiniakos D. G., Palaiologou M., Goutas N., Filippidis T., Vassilaros D. S., Dhimolea E., Mitsiou J. D. and Alexis N. M. (2013) Estrogen receptor beta 2 is associated with poor prognosis in estrogen receptor alpha-negative breast carcinoma. J. Cancer Res. Clin. Oncol. 139; 1489–1498. - PMC - PubMed
    1. Cowley S. M., Hoare S., Mosselman S. and Parker M. G. (1997) Estrogen receptors alpha and beta form heterodimers on DNA. J. Biol. Chem. 272; 19858–19862. - PubMed
    1. Daito J., Harada Y., Dai P., Yamaoka Y., Tamagawa-Mineoka R., Katoh N. and Takamatsu T. (2014) Neutrophil phagocytosis of platelets in the early phase of 2,4,6-trinitro-1-chlorobenzene (TNCB)-induced dermatitis in mice. Acta Histochem. Cytochem. 47; 67–74. - PMC - PubMed