. 2017 May 4:11:130.
doi: 10.3389/fncel.2017.00130. eCollection 2017.

The F-Actin Binding Protein Cortactin Regulates the Dynamics of the Exocytotic Fusion Pore through its SH3 Domain

Affiliations

The F-Actin Binding Protein Cortactin Regulates the Dynamics of the Exocytotic Fusion Pore through its SH3 Domain

Arlek M González-Jamett et al. Front Cell Neurosci. .

Abstract

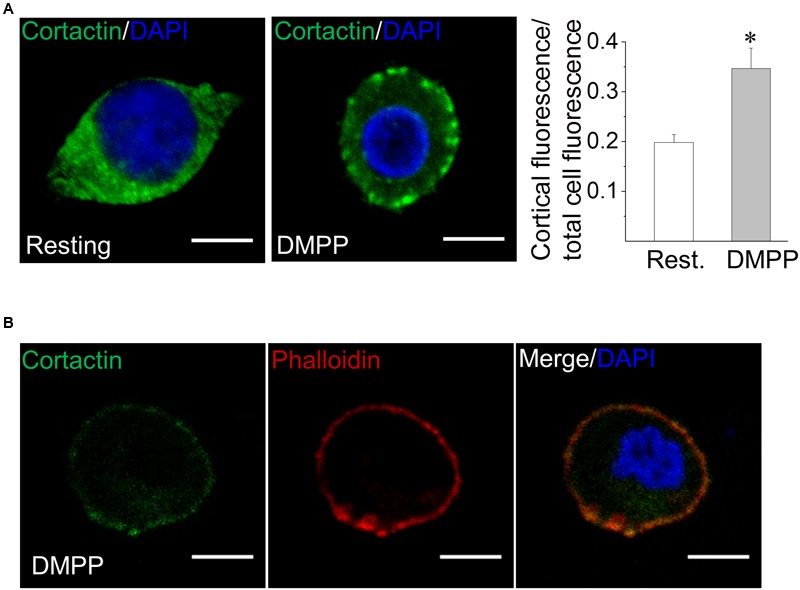
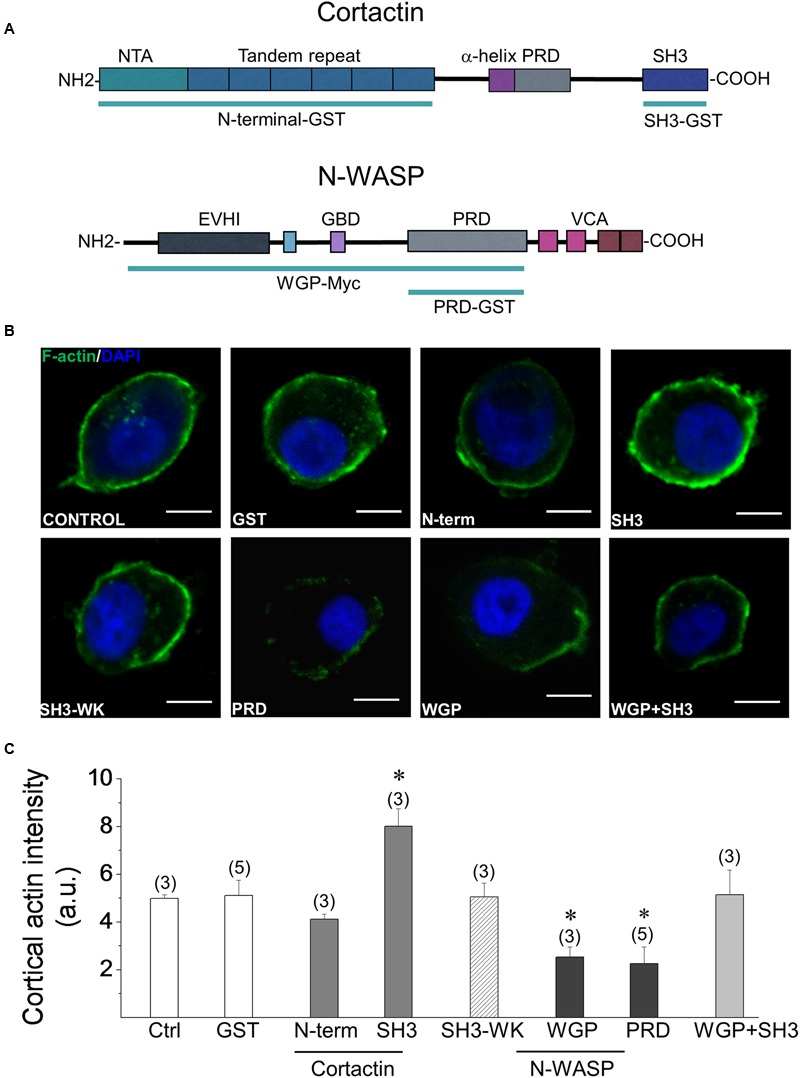
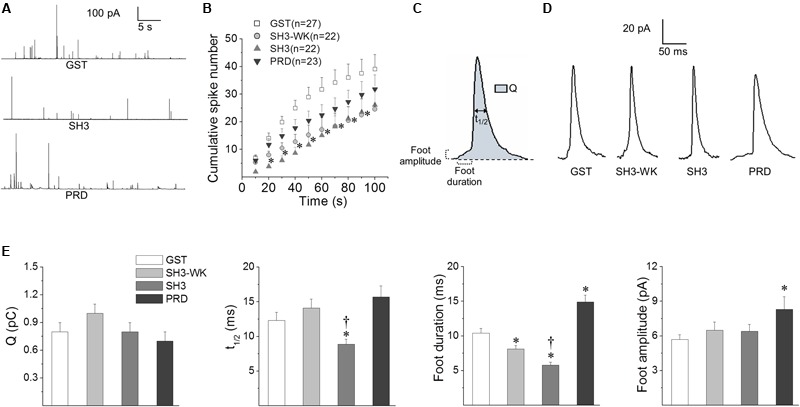
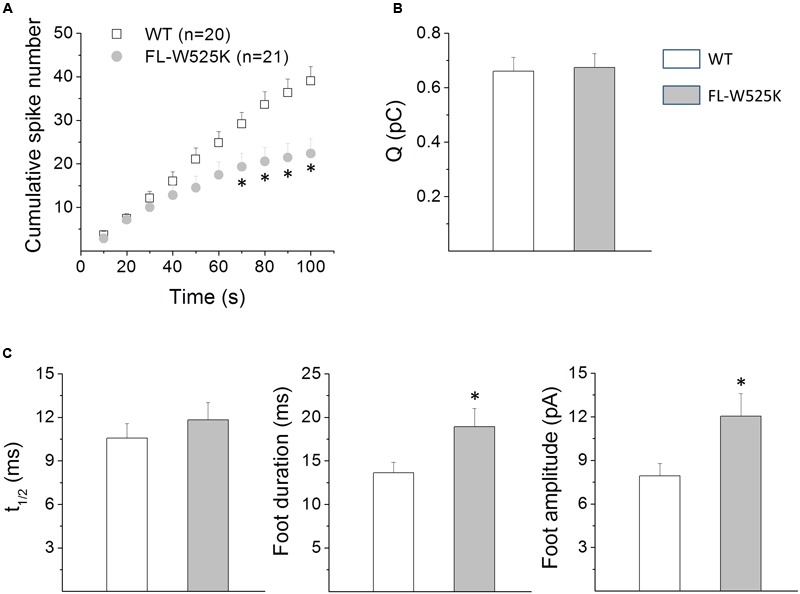
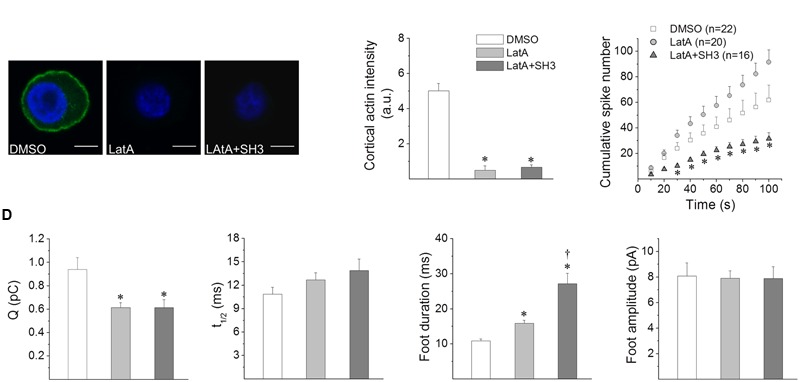
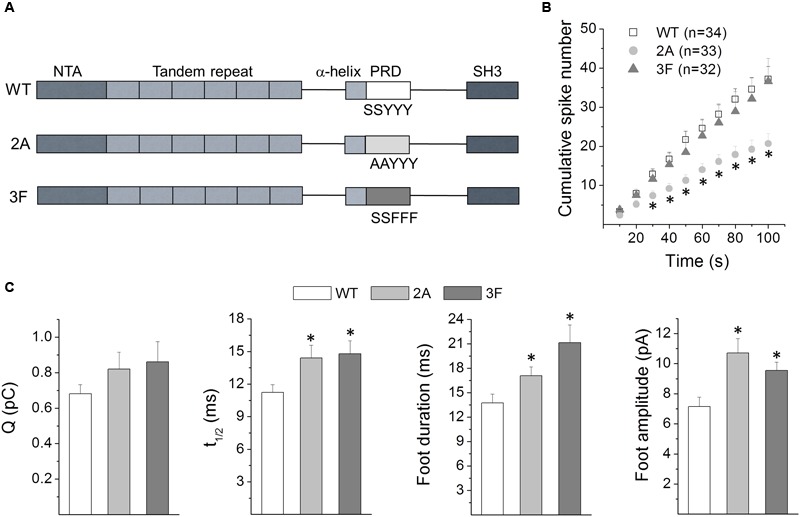
Upon cell stimulation, the network of cortical actin filaments is rearranged to facilitate the neurosecretory process. This actin rearrangement includes both disruption of the preexisting actin network and de novo actin polymerization. However, the mechanism by which a Ca2+ signal elicits the formation of new actin filaments remains uncertain. Cortactin, an actin-binding protein that promotes actin polymerization in synergy with the nucleation promoting factor N-WASP, could play a key role in this mechanism. We addressed this hypothesis by analyzing de novo actin polymerization and exocytosis in bovine adrenal chromaffin cells expressing different cortactin or N-WASP domains, or cortactin mutants that fail to interact with proline-rich domain (PRD)-containing proteins, including N-WASP, or to be phosphorylated by Ca2+-dependent kinases, such as ERK1/2 and Src. Our results show that the activation of nicotinic receptors in chromaffin cells promotes cortactin translocation to the cell cortex, where it colocalizes with actin filaments. We further found that, in association with PRD-containing proteins, cortactin contributes to the Ca2+-dependent formation of F-actin, and regulates fusion pore dynamics and the number of exocytotic events induced by activation of nicotinic receptors. However, whereas the actions of cortactin on the fusion pore dynamics seems to depend on the availability of monomeric actin and its phosphorylation by ERK1/2 and Src kinases, cortactin regulates the extent of exocytosis by a mechanism independent of actin polymerization. Together our findings point out a role for cortactin as a critical modulator of actin filament formation and exocytosis in neuroendocrine cells.

Keywords: N-WASP; actin polymerization; catecholamines; chromaffin cells; cortactin; exocytosis; fusion pore; neuroendocrine cells.


Figures

FIGURE 1
FIGURE 1
Cortactin migrates from the cytosol to the cell cortex in response to stimuli that induce exocytosis. (A) Bovine chromaffin cells under resting condition or stimulated with the nicotinic agonist DMPP (50 μM) were immunolabeled with an anti-cortactin monoclonal antibody (green). Nuclei were stained with DAPI (blue). The relative labeling of cortactin in the cell cortex was quantified by dividing the cortical fluorescence intensity (1 μm under the cell periphery) by the total cell fluorescence intensity. Note that cell stimulation with DMPP significantly increased the cortical localization of cortactin as compared to the resting condition. p < 0.05 (one-way ANOVA followed by unpaired t-test). Scale bar = 10 μm. (B) Cultured chromaffin cells were DMPP-stimulated, fixed and co-labeled with an anti-cortactin-directed antibody (green) and the F-actin-binding toxin phalloidin-TRITC (red). Nuclei were stained with DAPI (blue). Then sample were visualized by confocal microscopy. Cortactin/F-actin colocalization was determined by Pearson’s correlation coefficient reaching a value of 0.61 ± 0.05 from five different cultures. Scale bar = 10 μm.
FIGURE 2
FIGURE 2
Effects of the cortactin SH3 domain and the N-WASP PRD on Ca2+-induced cortical F-actin formation. (A) Schematic representation of cortactin and N-WASP primary structures. The cortactin N-terminal region contains the N-terminal acidic domain (NTA), which binds and activates the Arp2/3 complex, and the tandem repeat that binds F-actin. The WGP fragment of N-WASP consists in the protein lacking the VCA region (B,C). F-actin polymerization assay was performed in cells permeabilized with 20 μM digitonin, in the presence of 300 nM Alexa-Fluor-488 actin, 2 mM ATP-Mg2+, 10 μM free Ca2+ and 100 nM of GST alone or the indicated fusion peptide. Then samples were fixed, stained with DAPI and visualized by confocal microscopy. (B) Representative images of F-actin formation. Scale bar = 10 μm. (C) The graph corresponds to quantification of the fluorescence intensity of cortical actin filaments 1 μm under the cell periphery. Data are means ± SEM from cells permeabilized in the absence of peptides (control; n = 16) or in the presence of GST (n = 43), GST-cortactin N-terminal (N-term; n = 21), GST-cortactin SH3 (SH3; n = 54), GST-cortactin SH3W525K mutant (WK; n = 38), Myc-tagged N-WASP WGP (WGP; n = 11), GST-N-WASP PRD (PRD; n = 33) or GST-cortactin SH3 plus Myc-tagged N-WASP WGP (WGP+SH3; n = 25). N corresponds to the number of tested cells per experimental condition from at least three different cultures (numbers over the bars indicate the number of cell cultures). Statistical significance was determined by one-way ANOVA followed by unpaired t-test where p < 0.05 compared with control cells (Ctrl).
FIGURE 3
FIGURE 3
Effects of the cortactin SH3 domain and the N-WASP PRD on exocytosis. Chromaffin cells were injected with 5 μM of GST alone, GST-cortactin SH3 (SH3), a mutated version of GST-cortactin SH3 defective in binding PRD (SH3-WK) or GST-N-WASP PRD (PRD). The exocytosis response evoked by a 10 s pulse of 50 μM DMPP was monitored by amperometry 30–45 min after injections. The amperometric recordings lasted 100 s. (A) Examples of 40 s amperometric traces from cells injected with GST, SH3 or PRD peptides. (B) Cumulative histograms of the number of amperometric spikes from cells injected with GST (white squares), SH3-WK (light-gray circles), SH3 (light-gray triangles) or PRD (dark-gray inverted triangles). Numbers between parentheses indicate the number of cells obtained from at least three different cultures. Notice that both SH3-WK and SH3 significantly reduced the number of spikes between 20 and 80 s. p < 0.05 compared to GST (one-way ANOVA followed by unpaired t-test). (C) Scheme of an amperometric spike with the analyzed parameters: quantal size (Q), half width (t1/2), foot duration and foot amplitude. (D) Examples of amperometric spikes from cells injected with GST, SH3-WK, SH3 or PRD. (E) The graphs show mean values of medians determined for single cells of Q, t1/2, foot duration and foot amplitude of amperometric spikes from cells injected with GST (white bars), SH3-WK (light-gray bars), SH3 (gray bars) or PRD (dark-gray bars). Data are represented as means ± SEM. Numbers of cells for each condition are the same as indicated in (B). p < 0.05 compared with GST; p < 0.05 compared with SH3-WK (one-way ANOVA followed by unpaired t-test).
FIGURE 4
FIGURE 4
Effects of the expression of the FL-W525K cortactin mutant on exocytosis in chromaffin cells. (A–C) Chromaffin cells were transfected with WT, or with the FL-W525K mutant deficient in binding PRD-containing proteins. The exocytosis response evoked by a 10 s pulse of 50 μM DMPP was monitored by amperometry 48 h after transfection. Each amperometric recordings lasted 100 s. (A) Cumulative histograms of the number of amperometric spikes during the entire recording in cells transfected with WT cortactin or its FL-W525K mutant. Numbers between parentheses indicate the number of cells analyzed from at least three different cultures. Notice that the number of events is reduced in cells expressing FL-W525K compared to WT during the last 40 s of the recording. p < 0.05 (unpaired t-test). (B,C) Graphs represent the mean median values per single cell of the quantal size (Q), half width (t1/2) foot duration and foot amplitude of amperometric spikes from cells expressing WT (white bars) or the FL-W525K cortactin mutant (gray bars). Data are means ± SEM. Numbers of cells for each condition are the same as indicated in (A). p < 0.05 compared with WT (unpaired t-test).
FIGURE 5
FIGURE 5
Effects of cortactin SH3 domain on the exocytosis induced in the presence of latrunculin A. (A,B) F-actin polymerization assay was performed in cells permeabilized with 20 μM digitonin, in the presence of 300 nM Alexa-Fluor-488 actin, 2 mM ATP-Mg2+, 10 μM free Ca2+ and the vehicle DMSO, 2 μM latrunculin A (LatA) or 2 μM LatA plus GST-cortactin SH3 (LatA+SH3). Then samples were fixed, stained with DAPI and visualized by confocal microscopy. (A) Representative images of F-actin formation. Scale bar = 10 μm. (B) The graph corresponds to quantification of the fluorescence intensity of cortical F-actin (1 μm under the cell periphery), where data are means ± SEM of 10–16 cells from three different cultures. p < 0.05 compared to DMSO (one-way ANOVA followed by unpaired t-test). (C,D) Cells were incubated for 10 min with 2 μM LatA or DMSO. A group of cells were injected with GST-cortactin SH3 20 min before LatA treatment (LatA+SH3). Exocytosis was induced with 50 μM DMPP and monitored by amperometry. The amperometric recordings lasted 100 s. (C) Cumulative histograms of the number of amperometric events from cells treated with DMSO (white squares), LatA (gray circles) or LatA+SH3 (dark-gray triangles). Numbers between parentheses indicate the number of cells analyzed from at least three different cultures. p < 0.05 compared to DMSO (one-way ANOVA followed by unpaired t-test). (D) The graphs show mean values of medians determined for single cells of quantal size (Q), half width (t1/2), foot duration and foot amplitude of amperometric spikes from cells treated with DMSO (white bars), LatA (gray bars) or LatA+SH3 (dark-gray bars). Data are represented as means ± SEM. Numbers of cells for each condition are the same as indicated in (C). p < 0.05 compared with DMSO, p < 0.05 compared with LatA (one-way ANOVA followed by unpaired t-test).
FIGURE 6
FIGURE 6
Effects of serine and tyrosine phosphorylation of cortactin on exocytosis. (A) Schematic representation of the cortactin primary structure and the location of the mutations used in this study. (B,C) Cells were transfected with WT, the ERK1/2 non-phosphorylatable mutant S405,418A (2A) or the Src non-phosphorylatable mutant Y421,466,482F (3F). Exocytosis was induced with 50 μM DMPP and monitored by amperometry 48 h after transfections. Each amperometric recordings lasted 100 s. (B) Cumulative histograms of the number of amperometric events from cells expressing WT or the phosphorylation-resistant mutants 2A or 3F. Numbers between parentheses indicate the number of cells obtained from at least three different cultures. Note that in comparison to the WT-expression, the 2A mutant significantly reduced the number of exocytotic events during the last 80 s. p < 0.05 compared with WT (one-way ANOVA followed by unpaired t-test). (C) The graphs show mean values of medians determined for individual cells of the quantal size (Q), half width (t1/2) foot duration and foot amplitude of the amperometric spikes from cells expressing WT (white bars), 2A (light-gray bars) or 3F (dark-gray bars). Data are represented as means ± SEM. Numbers of cells for each condition are the same as indicated in (B). p < 0.05 compared with WT (one-way ANOVA followed by unpaired t-test).

Similar articles

Cited by

References

    1. Agrawal V., Kishan K. V. (2002). Promiscuous binding nature of SH3 domains to their target proteins. Protein Pept. Lett. 9 185–193. 10.2174/0929866023408760 - DOI - PubMed
    1. Alés E., Tabares L., Poyato J. M., Valero V., Lindau M., Alvarez de Toledo G. (1999). High calcium concentrations shift the mode of exocytosis to the kiss-and-run mechanism. Nat. Cell Biol. 1 40–44. - PubMed
    1. Allen C. M., Ely C. M., Juaneza M. A., Parsons S. J. (1996). Activation of Fyn tyrosine kinase upon secretagogue stimulation of bovine chromaffin cells. J. Neurosci. Res. 44 421–429. 10.1002/(SICI)1097-4547(19960601)44:5<421::AID-JNR2>3.0.CO;2-H - DOI - PubMed
    1. Amatore C., Arbault S., Bonifas I., Bouret Y., Erard M., Ewing A. G., et al. (2005). Correlation between vesicle quantal size and fusion pore release in chromaffin cell exocytosis. Biophys. J. 88 4411–4420. 10.1529/biophysj.104.053736 - DOI - PMC - PubMed
    1. Ardiles A. O., González-Jamett A. M., Maripillán J., Naranjo D., Caviedes P., Cárdenas A. M. (2007). Calcium channel subtypes differentially regulate fusion pore stability and expansion. J. Neurochem. 103 1574–1581. 10.1111/j.1471-4159.2007.04871.x - DOI - PubMed

LinkOut - more resources