

Hypoxia and Inactivity Related Physiological Changes (Constipation, Inflammation) Are Not Reflected at the Level of Gut Metabolites and Butyrate Producing Microbial Community: The PlanHab Study
- PMID: 28522975
- PMCID: PMC5416748
- DOI: 10.3389/fphys.2017.00250
Hypoxia and Inactivity Related Physiological Changes (Constipation, Inflammation) Are Not Reflected at the Level of Gut Metabolites and Butyrate Producing Microbial Community: The PlanHab Study
Abstract
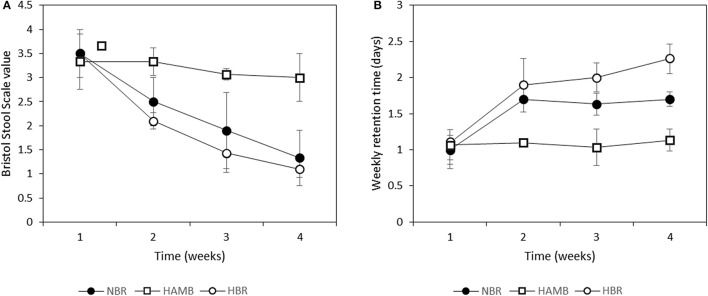
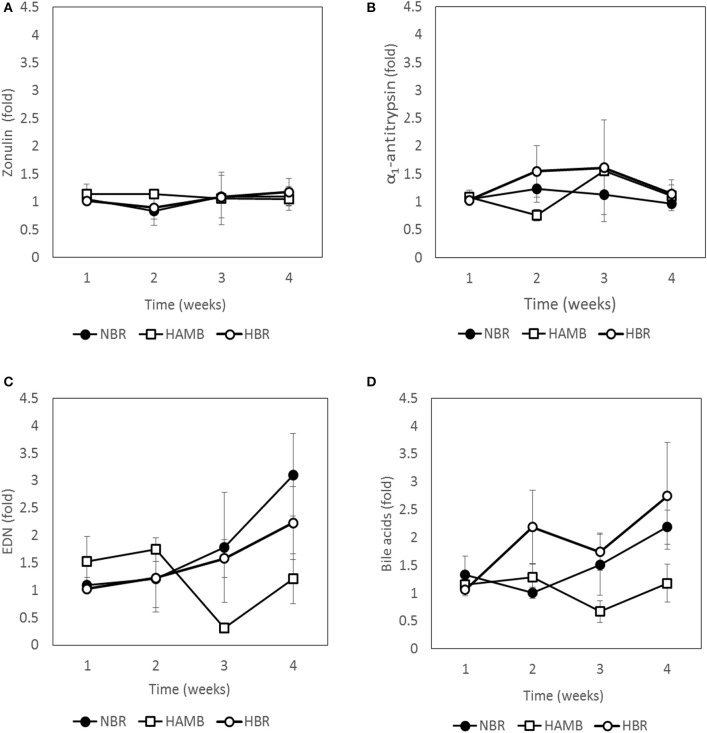
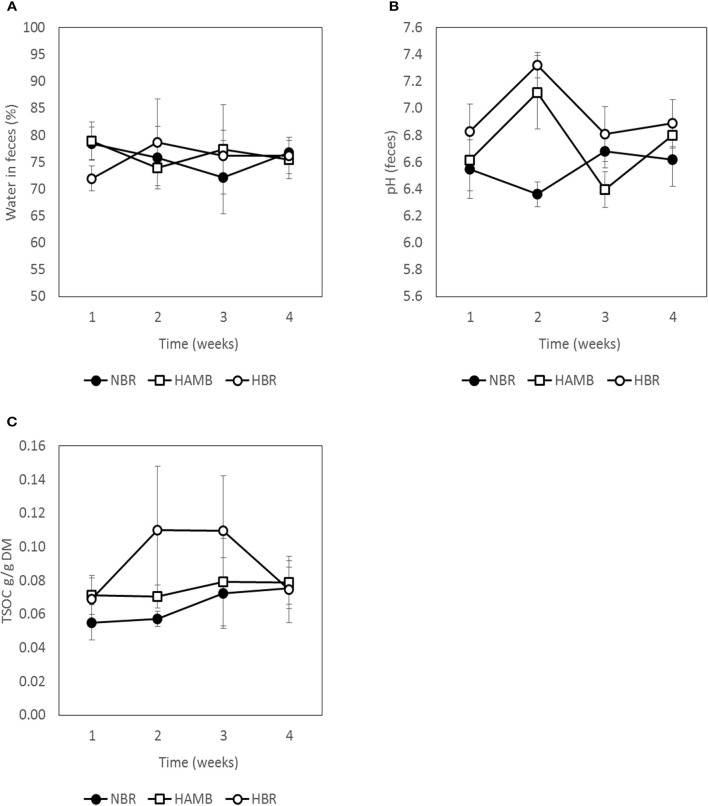
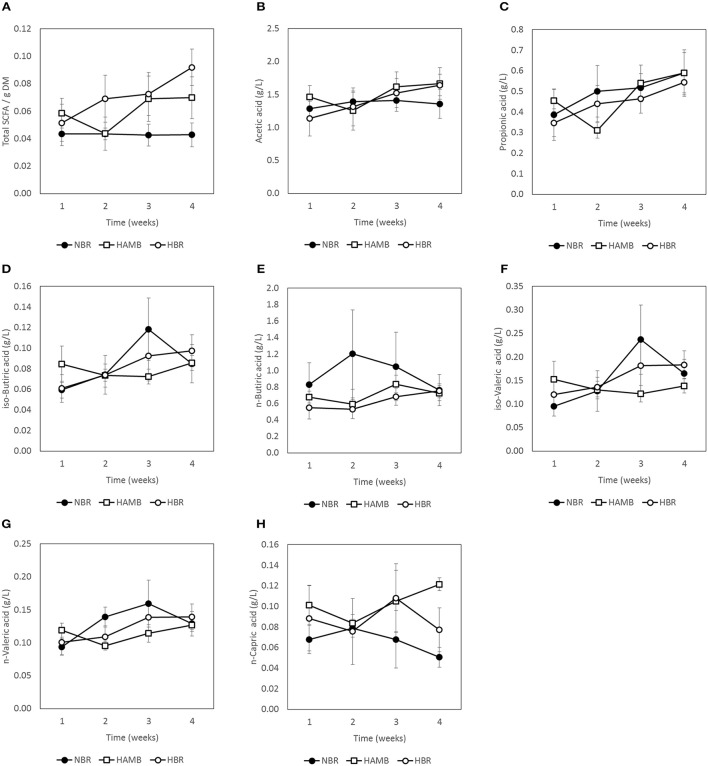
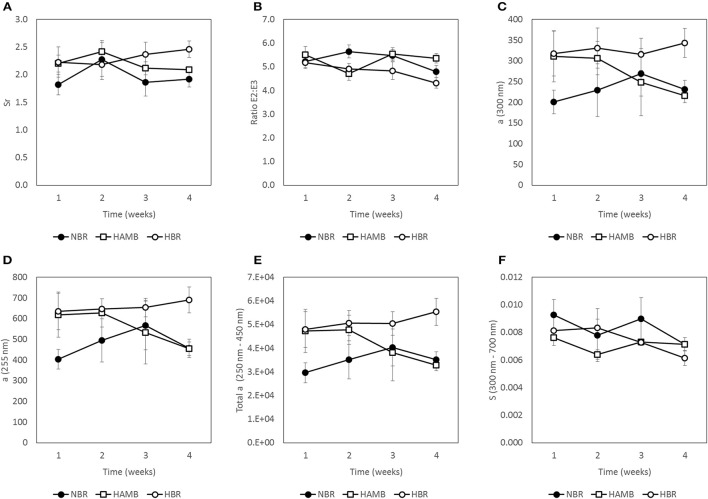
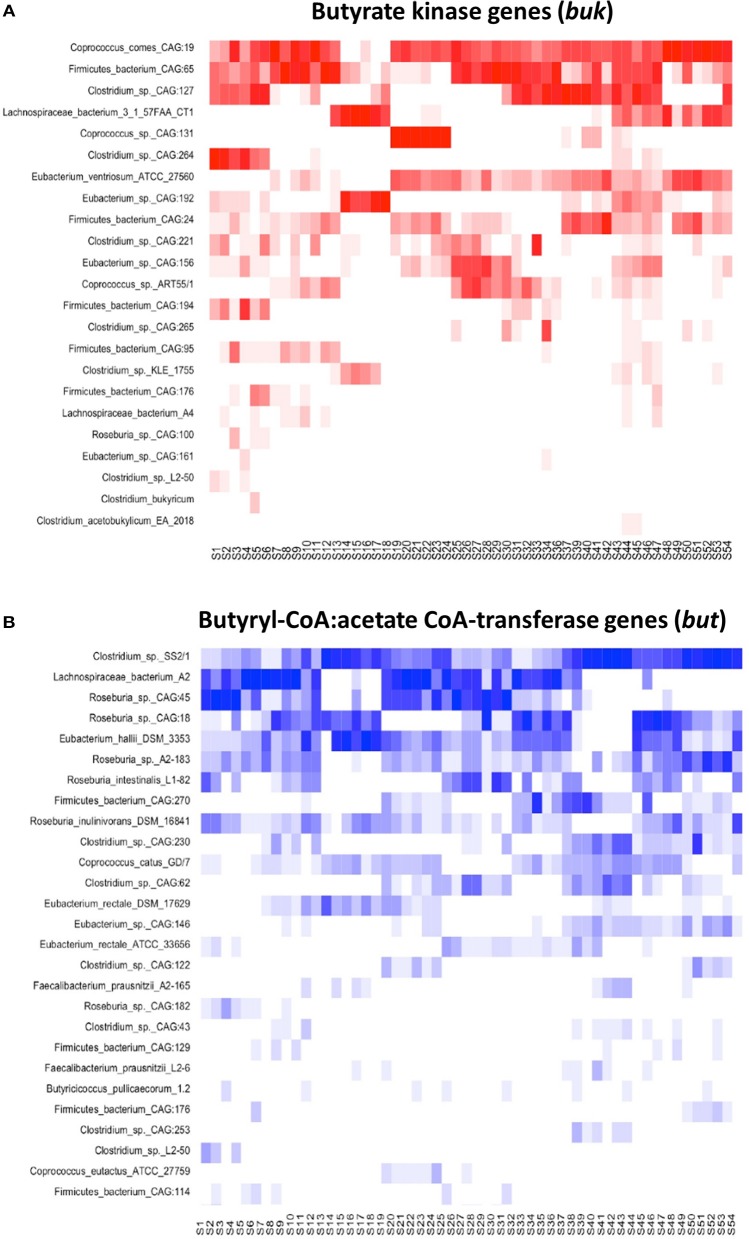
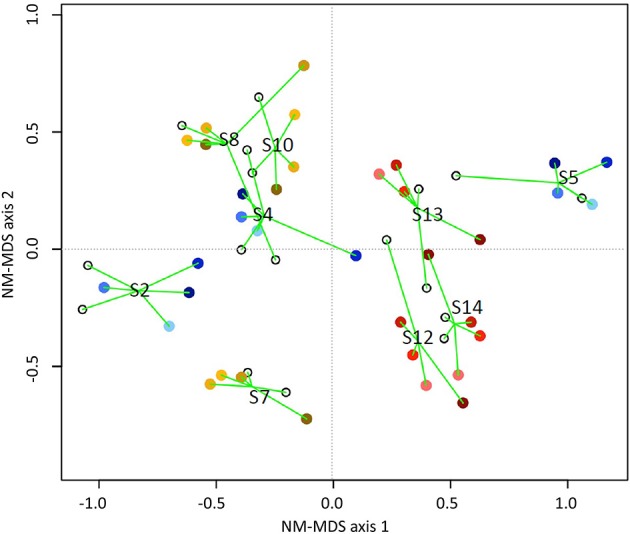
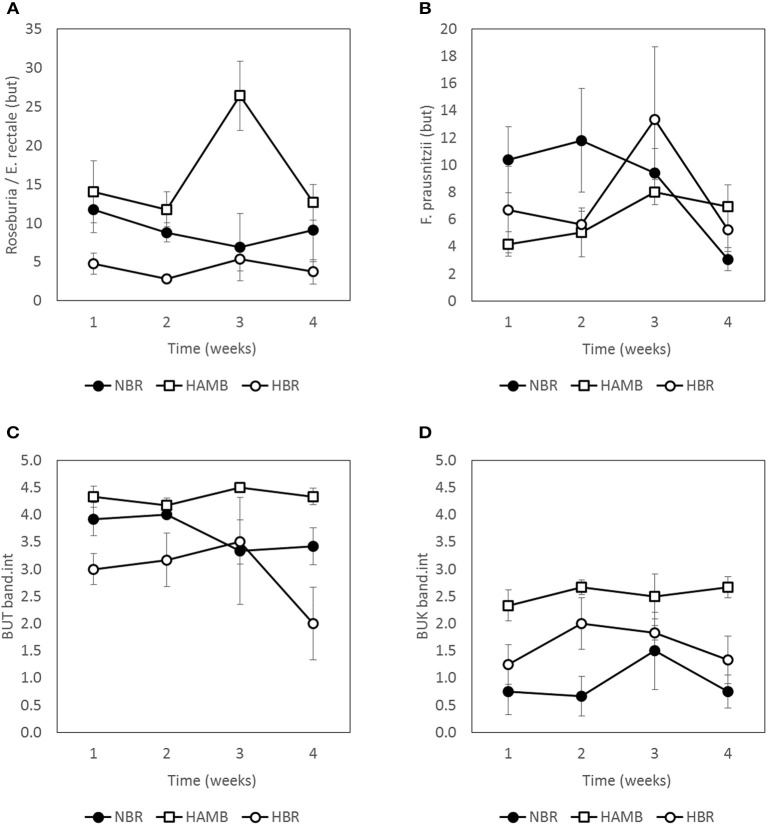
We explored the assembly of intestinal microbiota in healthy male participants during the run-in (5 day) and experimental phases [21-day normoxic bed rest (NBR), hypoxic bedrest (HBR)], and hypoxic ambulation (HAmb) in a strictly controlled laboratory environment, balanced fluid, and dietary intakes, controlled circadian rhythm, microbial ambiental burden, and 24/7 medical surveillance. The fraction of inspired O2 (FiO2) and partial pressure of inspired O2 (PiO2) were 0.209 and 133.1 ± 0.3 mmHg for NBR and 0.141 ± 0.004 and 90.0 ± 0.4 mmHg for both hypoxic variants (HBR and HAmb; ~4,000 m simulated altitude), respectively. A number of parameters linked to intestinal transit spanning Bristol Stool Scale, defecation rates, zonulin, α1-antitrypsin, eosinophil derived neurotoxin, bile acids, reducing sugars, short chain fatty acids, total soluble organic carbon, water content, diet composition, and food intake were measured (167 variables). The abundance, structure, and diversity of butyrate producing microbial community were assessed using the two primary bacterial butyrate synthesis pathways, butyryl-CoA: acetate CoA-transferase (but) and butyrate kinase (buk) genes. Inactivity negatively affected fecal consistency and in combination with hypoxia aggravated the state of gut inflammation (p < 0.05). In contrast, gut permeability, various metabolic markers, the structure, diversity, and abundance of butyrate producing microbial community were not significantly affected. Rearrangements in the butyrate producing microbial community structure were explained by experimental setup (13.4%), experimentally structured metabolites (12.8%), and gut metabolite-immunological markers (11.9%), with 61.9% remaining unexplained. Many of the measured parameters were found to be correlated and were hence omitted from further analyses. The observed progressive increase in two immunological intestinal markers suggested that the transition from healthy physiological state toward the developed symptoms of low magnitude obesity-related syndromes was primarily driven by the onset of inactivity (lack of exercise in NBR) that were exacerbated by systemic hypoxia (HBR) and significantly alleviated by exercise, despite hypoxia (HAmb). Butyrate producing community in colon exhibited apparent resilience toward short-term modifications in host exercise or hypoxia. Progressive constipation (decreased intestinal motility) and increased local inflammation marker suggest that changes in microbial colonization and metabolism were taking place at the location of small intestine.
Keywords: butyrate producing community; constipation; gut metabolites; human intestinal microbiome; hypoxia; inactivity; inflammation; noncommunicable diseases.
Figures
Similar articles
-
Hypoxia and inactivity related physiological changes precede or take place in absence of significant rearrangements in bacterial community structure: The PlanHab randomized trial pilot study.PLoS One. 2017 Dec 6;12(12):e0188556. doi: 10.1371/journal.pone.0188556. eCollection 2017. PLoS One. 2017. PMID: 29211803 Free PMC article. Clinical Trial.
-
Intestinal Metagenomes and Metabolomes in Healthy Young Males: Inactivity and Hypoxia Generated Negative Physiological Symptoms Precede Microbial Dysbiosis.Front Physiol. 2018 Mar 13;9:198. doi: 10.3389/fphys.2018.00198. eCollection 2018. Front Physiol. 2018. PMID: 29593560 Free PMC article.
-
Systems View of Deconditioning During Spaceflight Simulation in the PlanHab Project: The Departure of Urine 1 H-NMR Metabolomes From Healthy State in Young Males Subjected to Bedrest Inactivity and Hypoxia.Front Physiol. 2020 Dec 7;11:532271. doi: 10.3389/fphys.2020.532271. eCollection 2020. Front Physiol. 2020. PMID: 33364971 Free PMC article.
-
Butyrate producers, "The Sentinel of Gut": Their intestinal significance with and beyond butyrate, and prospective use as microbial therapeutics.Front Microbiol. 2023 Jan 12;13:1103836. doi: 10.3389/fmicb.2022.1103836. eCollection 2022. Front Microbiol. 2023. PMID: 36713166 Free PMC article. Review.
-
Impact of Diet-Modulated Butyrate Production on Intestinal Barrier Function and Inflammation.Nutrients. 2018 Oct 13;10(10):1499. doi: 10.3390/nu10101499. Nutrients. 2018. PMID: 30322146 Free PMC article. Review.
Cited by
-
The Gut Microbiota in Women Suffering from Gestational Diabetes Mellitus with the Failure of Glycemic Control by Lifestyle Modification.J Diabetes Res. 2019 Oct 23;2019:6081248. doi: 10.1155/2019/6081248. eCollection 2019. J Diabetes Res. 2019. PMID: 31772944 Free PMC article.
-
The Importance of Objective Stool Classification in Fecal 1H-NMR Metabolomics: Exponential Increase in Stool Crosslinking Is Mirrored in Systemic Inflammation and Associated to Fecal Acetate and Methionine.Metabolites. 2021 Mar 16;11(3):172. doi: 10.3390/metabo11030172. Metabolites. 2021. PMID: 33809780 Free PMC article.
-
Biogenic Selenium Nanoparticles Synthesized by Lactobacillus casei ATCC 393 Alleviate Acute Hypobaric Hypoxia-Induced Intestinal Barrier Dysfunction in C57BL/6 Mice.Biol Trace Elem Res. 2023 Sep;201(9):4484-4496. doi: 10.1007/s12011-022-03513-y. Epub 2022 Dec 5. Biol Trace Elem Res. 2023. PMID: 36469280
-
Changes in the Gut Bacteria Composition of Healthy Men with the Same Nutritional Profile Undergoing 10-Week Aerobic Exercise Training: A Randomized Controlled Trial.Nutrients. 2021 Aug 18;13(8):2839. doi: 10.3390/nu13082839. Nutrients. 2021. PMID: 34444999 Free PMC article. Clinical Trial.
-
Case specific: Addressing co-digestion of wastewater sludge, cheese whey and cow manure: Kinetic modeling.Heliyon. 2024 Oct 1;10(19):e38773. doi: 10.1016/j.heliyon.2024.e38773. eCollection 2024 Oct 15. Heliyon. 2024. PMID: 39421358 Free PMC article.
References
-
- Benjamini Y., Hochberg Y. (1995). Controlling the false discovery rate: a practical and powerful approach to multiple testing. J. R. Stat. Soc. Ser. B 57, 289–300.
-
- Benjamini Y., Yekutieli D. (2001). The control of the false discovery rate in multiple testing under dependency. Ann. Stat. 29, 1165–1188. 10.1214/aos/1013699998 - DOI
-
- Bermon S., Petriz B., Kajeniene A., Prestes J., Castell L., Franco O. L. (2015). The microbiota: an exercise immunology perspective. Exerc. Immunol. Rev. 21, 70–79. - PubMed
LinkOut - more resources
Full Text Sources
Other Literature Sources