. 2017 May 4:8:709.
doi: 10.3389/fpls.2017.00709. eCollection 2017.

Genome Analysis of Conserved Dehydrin Motifs in Vascular Plants

Affiliations

Genome Analysis of Conserved Dehydrin Motifs in Vascular Plants

Ahmad A Malik et al. Front Plant Sci. .

Abstract

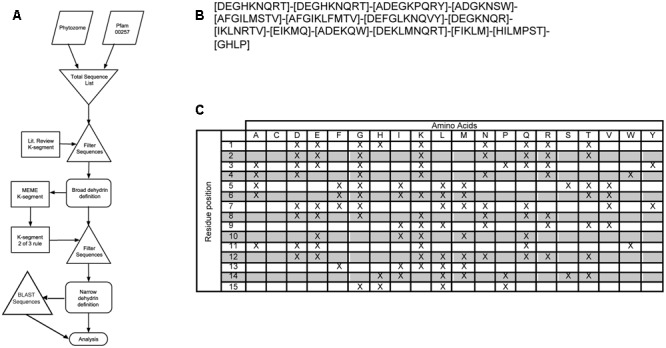
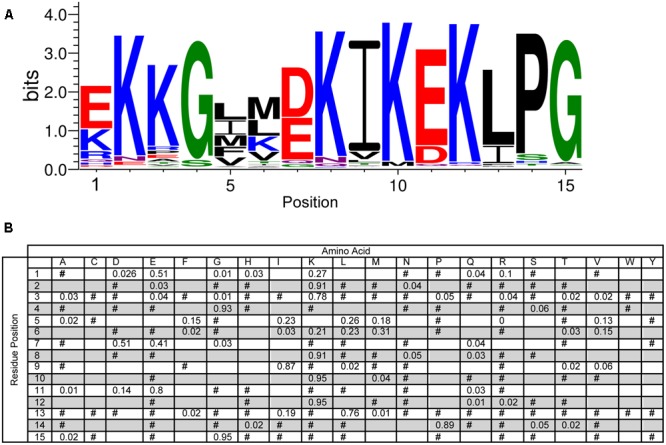
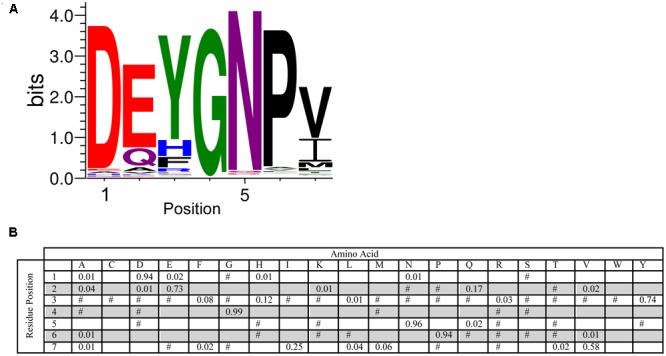
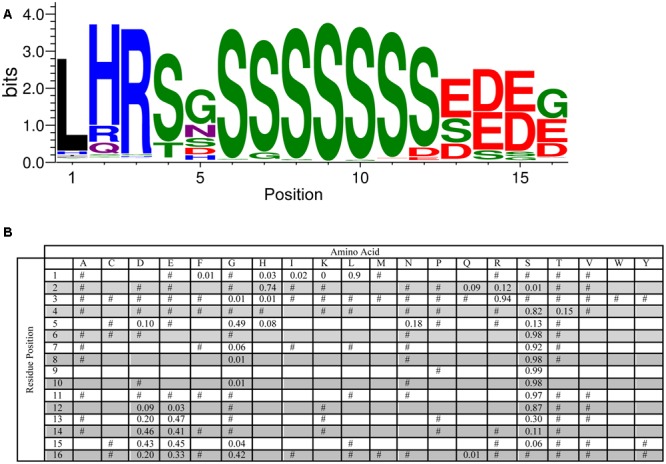
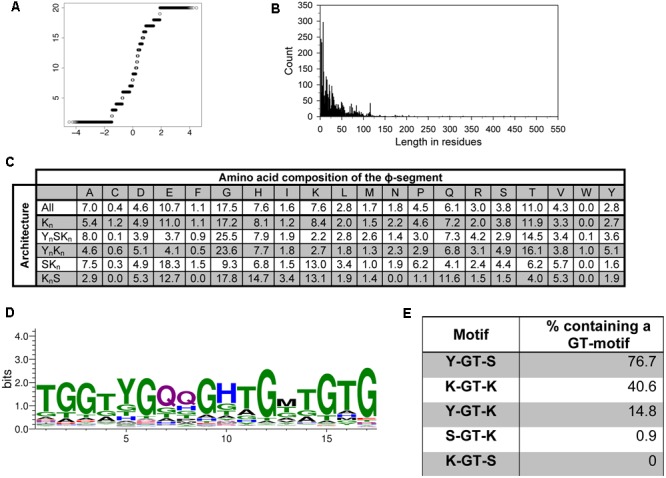
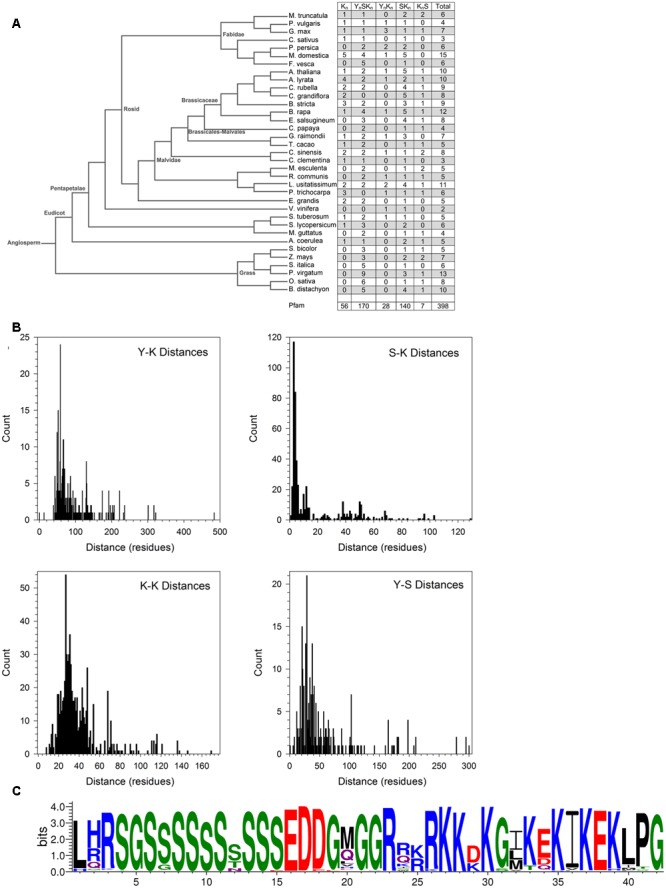
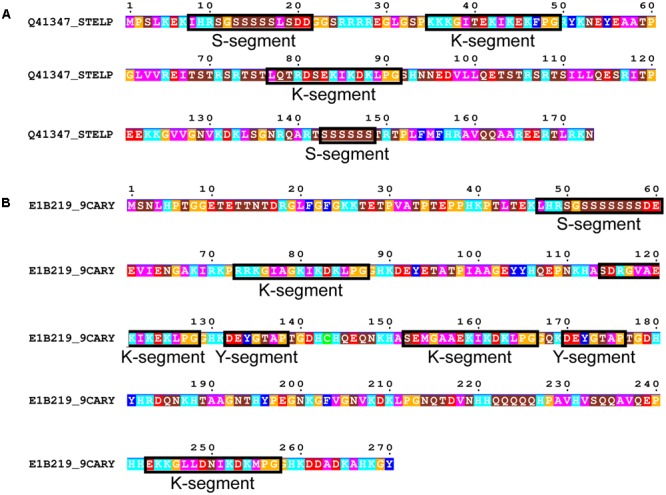
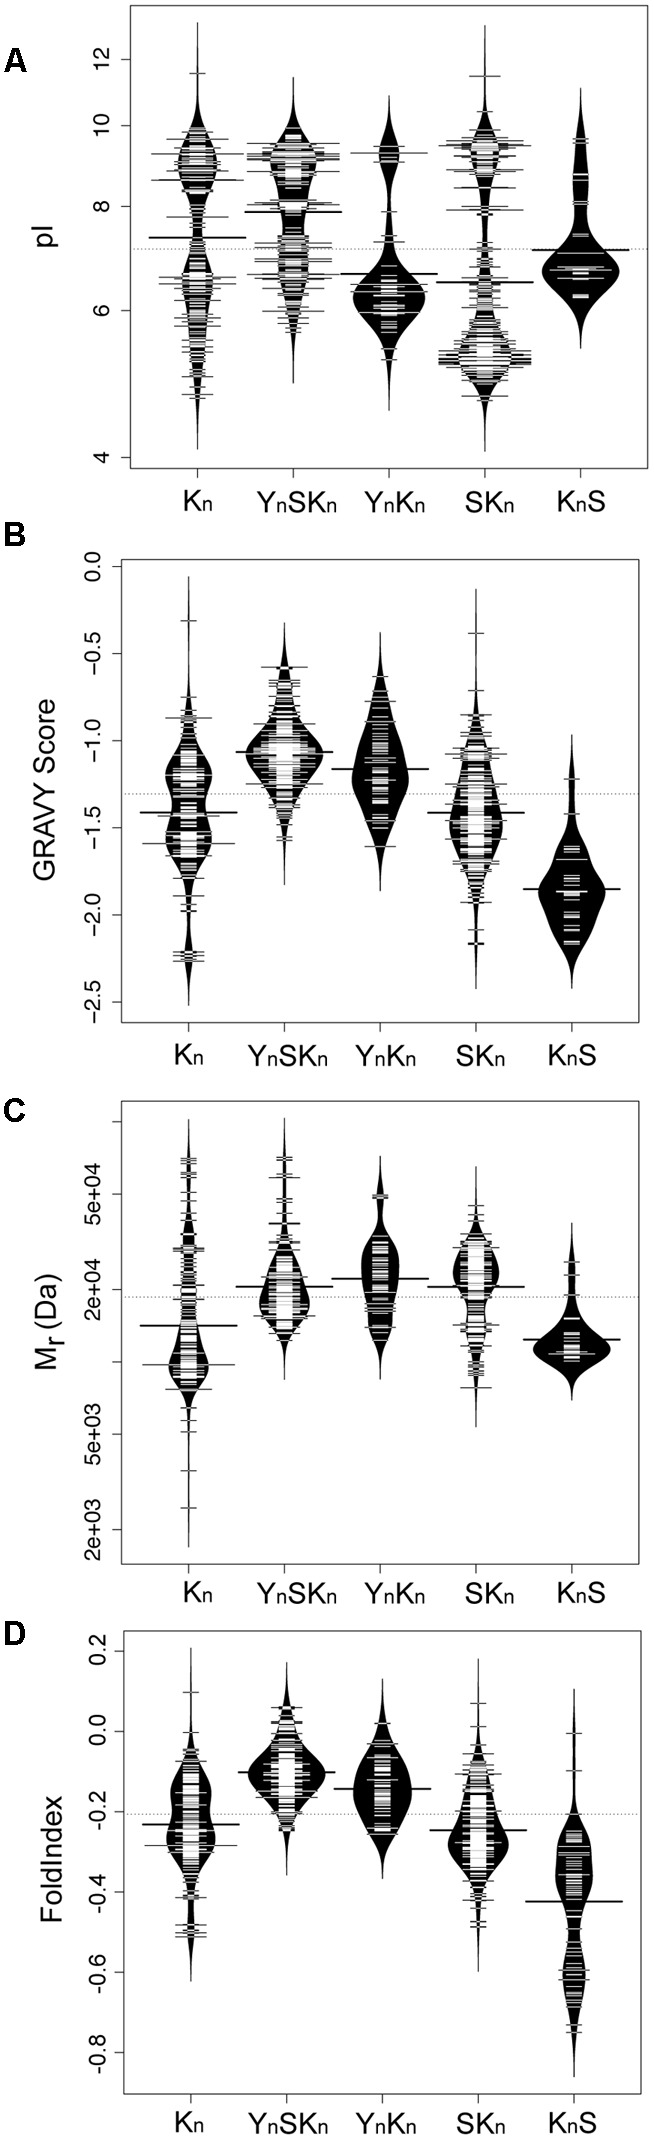
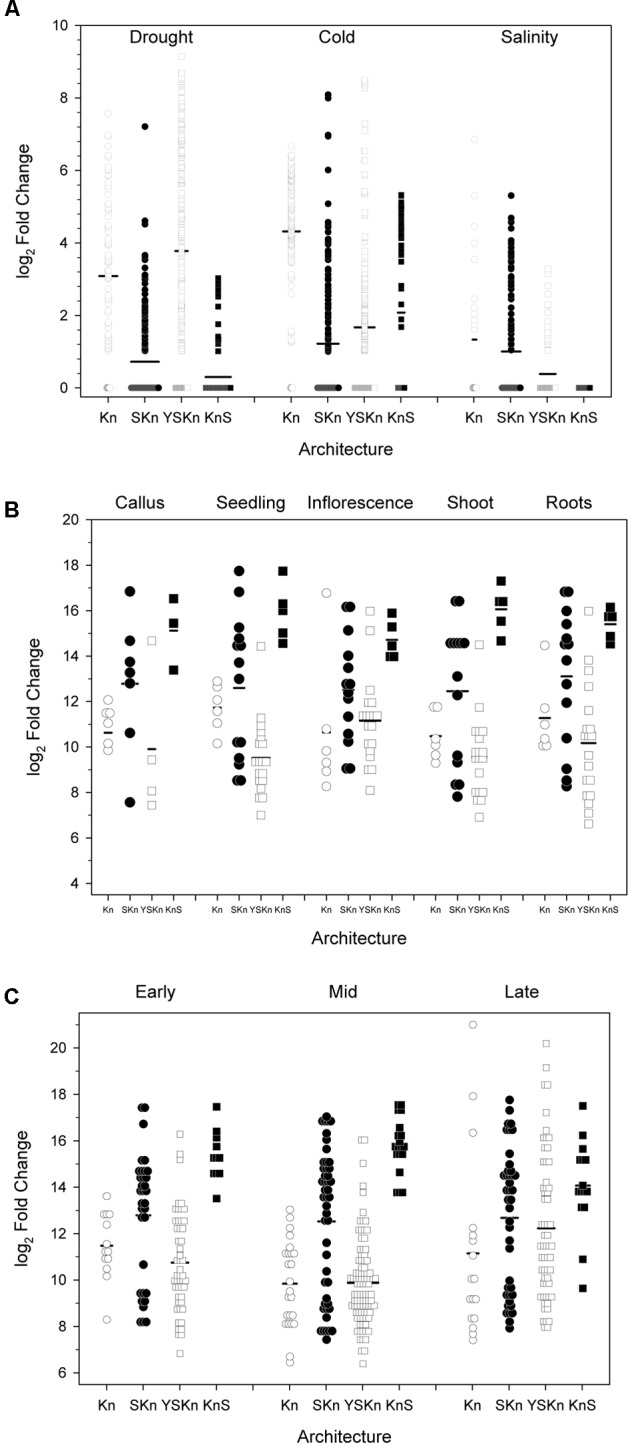
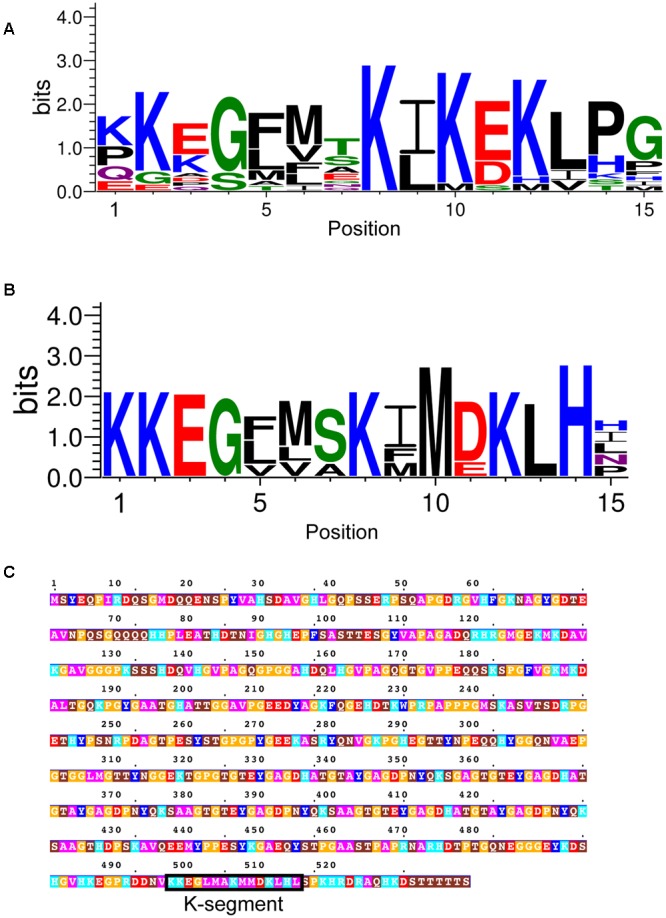
Dehydrins, a large family of abiotic stress proteins, are defined by the presence of a mostly conserved motif known as the K-segment, and may also contain two other conserved motifs known as the Y-segment and S-segment. Using the dehydrin literature, we developed a sequence motif definition of the K-segment, which we used to create a large dataset of dehydrin sequences by searching the Pfam00257 dehydrin dataset and the Phytozome 10 sequences of vascular plants. A comprehensive analysis of these sequences reveals that lysine residues are highly conserved in the K-segment, while the amino acid type is often conserved at other positions. Despite the Y-segment name, the central tyrosine is somewhat conserved, but can be substituted with two other small aromatic amino acids (phenylalanine or histidine). The S-segment contains a series of serine residues, but in some proteins is also preceded by a conserved LHR sequence. In many dehydrins containing all three of these motifs the S-segment is linked to the K-segment by a GXGGRRKK motif (where X can be any amino acid), suggesting a functional linkage between these two motifs. An analysis of the sequences shows that the dehydrin architecture and several biochemical properties (isoelectric point, molecular mass, and hydrophobicity score) are dependent on each other, and that some dehydrin architectures are overexpressed during certain abiotic stress, suggesting that they may be optimized for a specific abiotic stress while others are involved in all forms of dehydration stress (drought, cold, and salinity).

Keywords: abiotic stress; cold stress; dehydrin; drought stress; intrinsically disordered protein; motif search; phytozome; salinity.


Figures

FIGURE 1
FIGURE 1
Two-step filtering of dehydrin sequences. (A) Flowchart of the selection process. Trapezoids represent sequence input from Phytozome 10 and Pfam00257 databases. Triangles represent the filtering of the sequences with the broad literature K-segment definition or the two-of-three rule as outlined in Section “Results,” while rectangles represent the filter search expression. Rounded rectangles represent data output. (B) Broad literature K-segment definition search expression. Square brackets show which residues may be present at that position while dashes show the separation of the residue positions. (C) Broad literature K-segment definition in table format. This contains the same information as in (B), where ‘X’ indicates the possible presence of that amino acid at that residue position.
FIGURE 2
FIGURE 2
Conservation of the K-segment sequence. (A) LOGO representation of the MEME output of the K-segment. Amino acids are color-coded by their group type. Blue – positively charged (Lys, Arg, His); red – negatively charged (Asp, Glu); black – hydrophobic (Ala, Val, Leu, Ile, Pro, Phe, Met), green – polar (Gly, Ser, Thr, Tyr, Cys), purple – neutral (Asn, Gln). The heights of the amino acids correspond to their conservation at that position. Low probability amino acids may be too short to be seen. (B) Probability-weighted matrix (PWM) of the K-segment sequence. The probability of finding a particular amino acid at a particular position according to the search result. Empty space, p = 0; #, 0 < p < 0.01.
FIGURE 3
FIGURE 3
Conservation of the Y-segment sequence. (A) LOGO representation of the MEME output of the Y-segment. Amino acids are color-coded by their group type. Blue – positively charged (Lys, Arg, His); red – negatively charged (Asp, Glu); black – hydrophobic (Ala, Val, Leu, Ile, Pro, Phe, Met), green – polar (Gly, Ser, Thr, Tyr, Cys), purple – neutral (Asn, Gln). The heights of the amino acids correspond to their conservation at that position. Low probability amino acids may be too short to be seen. (B) PWM of the Y-segment sequence. The probability of finding a particular amino acid at a particular position according to the search result. Empty space, p = 0; #, 0 < p < 0.01.
FIGURE 4
FIGURE 4
Conservation of the S-segment sequence. (A) LOGO representation of the MEME output of the S-segment. Amino acids are color-coded by their group type. Blue – positively charged (Lys, Arg, His); red – negatively charged (Asp, Glu); black – hydrophobic (Ala, Val, Leu, Ile, Pro, Phe, Met), green – polar (Gly, Ser, Thr, Tyr, Cys), purple – neutral (Asn, Gln). The heights of the amino acids correspond to their conservation at that position. Low probability amino acids may be too short to be seen. (B) PWM of the S-segment sequence. The probability of finding a particular amino acid at a particular position according to the search result. Empty space, p = 0; #, 0 < p < 0.01.
FIGURE 5
FIGURE 5
The ϕ-segment sequence is not random. (A) Q–Q plot of the ϕ-segment sequences. (B) Length in residues of the ϕ-segment as a histogram plot. (C) Overall amino acid composition of the ϕ-segment by architecture. The values indicate the percent of all residues that are that particular amino acid in the ϕ-segment. The composition is shown for all dehydrins and for each individual architecture. (D) LOGO representation of the GT-motif. Blue – positively charged (Lys, Arg, His); red – negatively charged (Asp, Glu); black – hydrophobic (Ala, Val, Leu, Ile, Pro, Phe, Met), green – polar (Gly, Ser, Thr, Tyr, Cys), purple – neutral (Asn, Gln). (E) Location of the GT-motifs between the other three segments expressed as percent occurrence for that segment pair.
FIGURE 6
FIGURE 6
Dehydrin architecture and discovery of the SK-segment. (A) A phylogenetic tree of from Phytozome 10 of the species used in this study. The right column indicates the count of the architectures found in each species. (B) Distances in residues between the Y-, S-, and K-segments. The segment pairs are indicated inside each plot. (C) The SK-segment represented in LOGO form. Blue – positively charged (Lys, Arg, His); red – negatively charged (Asp, Glu); black – hydrophobic (Ala, Val, Leu, Ile, Pro, Phe, Met), green – polar (Gly, Ser, Thr, Tyr, Cys), purple – neutral (Asn, Gln).
FIGURE 7
FIGURE 7
Rare dehydrin architectures. (A) SKKS dehydrin from Stellaria longipes. (B) SKKYKYK dehydrin from Cerastium arcticum. In both panels residues are colored according to: acidic residues, red; basic residues, light blue; aromatic residues, dark blue; hydrophobic residues, magenta; polar residues, brown; Pro or Gly, orange; Cys, green. Conserved motifs are boxed and labeled.
FIGURE 8
FIGURE 8
Biochemical properties of dehydrins have unimodal and bimodal distributions. Bean plots of (A) isoelectric point (pI), (B) GRAVY score, (C) molecular mass (Mr), and (D) FoldIndex score of dehydrins categorized by the five architectures (Kn, YnSKn, SKn, YnKn, and KnS). The thin bars represent an individual protein while the wide black bar represents the mean of each group. The violin shapes represent the density of values. The dotted line represents the mean value of all dehydrins over all of the architectures. The y-axes of the GRAVY and FoldIndex scores are linear scales while the Mr and pI are logarithmic scales.
FIGURE 9
FIGURE 9
Changes in dehydrin gene expression under various conditions. The changes in gene expression are plotted as log2 changes based on the various dehydrin architectures. Symbols represent the results of an individual experiment, while the thick black bars are the average-fold change. Experiments showing a log2 fold change of less than one are shown as zero, with data points shown as overlapped symbols. (A) Abiotic stress, (B) Anatomy, (C) Developmental stage. Kn, open circles; SKn, closed circles; YSKn, open squares; KnS, closed squares. Insufficient data were available to plot the YKn architecture data.
FIGURE 10
FIGURE 10
Dehydrins in non-vascular plants and a lycophyte. (A) LOGO representation of the K-segment of non-vascular dehydrin sequences. (B) LOGO representation of a subset of non-vascular dehydrin sequences. Blue – positively charged (Lys, Arg, His); red – negatively charged (Asp, Glu); black – hydrophobic (Ala, Val, Leu, Ile, Pro, Phe, Met), green – polar (Gly, Ser, Thr, Tyr, Cys), purple – neutral (Asn, Gln). (C) Dehydrin sequence from the lycophyte Selaginella moellendorffii. Residues are colored according to: acidic residues, red; basic residues, light blue; aromatic residues, dark blue; hydrophobic residues, magenta; polar residues, brown; Pro or Gly, orange; Cys, green. The K-segment is boxed and labeled.

References

    1. Ahmad P., Prasad M. N. V. (eds) (2012). Abiotic Stress Responses in Plants. New York, NY: Springer; 10.1007/978-1-4614-0634-1 - DOI
    1. Alsheikh M. K., Heyen B. J., Randall S. K. (2003). Ion binding properties of the dehydrin ERD14 are dependent upon phosphorylation. J. Biol. Chem. 278 40882–40889. 10.1074/jbc.M307151200 - DOI - PubMed
    1. Alsheikh M. K., Svensson J. T., Randall S. K. (2005). Phosphorylation regulated ion-binding is a property shared by the acidic subclass dehydrins. Plant Cell Environ. 28 1114–1122. 10.1111/j.1365-3040.2005.01348.x - DOI
    1. Altschul S. F., Madden T. L., Schäffer A. A., Zhang J., Zhang Z., Miller W., et al. (1997). Gapped BLAST and PSI-BLAST: a new generation of protein database search programs. Nucleic Acids Res. 25 3389–3402. 10.1093/nar/25.17.3389 - DOI - PMC - PubMed
    1. Atkinson J., Clarke M. W., Warnica J. M., Boddington K. F., Graether S. P. (2016). Structure of an intrinsically disordered stress protein alone and bound to a membrane surface. Biophys. J. 111 480–491. 10.1016/j.bpj.2016.07.001 - DOI - PMC - PubMed

LinkOut - more resources