Review
. 2017 May;5(3):10.1128/microbiolspec.funk-0033-2017.
doi: 10.1128/microbiolspec.FUNK-0033-2017.

The Mycelium as a Network

Affiliations
Review

The Mycelium as a Network

Mark D Fricker et al. Microbiol Spectr. 2017 May.

Abstract

The characteristic growth pattern of fungal mycelia as an interconnected network has a major impact on how cellular events operating on a micron scale affect colony behavior at an ecological scale. Network structure is intimately linked to flows of resources across the network that in turn modify the network architecture itself. This complex interplay shapes the incredibly plastic behavior of fungi and allows them to cope with patchy, ephemeral resources, competition, damage, and predation in a manner completely different from multicellular plants or animals. Here, we try to link network structure with impact on resource movement at different scales of organization to understand the benefits and challenges of organisms that grow as connected networks. This inevitably involves an interdisciplinary approach whereby mathematical modeling helps to provide a bridge between information gleaned by traditional cell and molecular techniques or biophysical approaches at a hyphal level, with observations of colony dynamics and behavior at an ecological level.


Figures
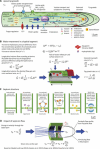
FIGURE 1
FIGURE 1
Mycelial network formation: tip growth and fluid flows. (A) Hyphae grow by extension at the tip through polarized secretion of wall materials from macrovesicles and chitosomes at the apex, choreographed by the Spitzenkörper. Membrane is recycled distal to the tip into early endosomes by endocytosis. Endosomes may also form multivesicular bodies (MVBs) that may be involved in unconventional secretion of exosomes. Transport of secretory vesicles, endosomes, and other organelles along microtubule and microfilament networks also generates cytoplasmic streaming within the apical compartment. Although wall plasticity controls hyphal extension, the driving force involves maintenance of sufficient turgor pressure by water uptake through osmosis in response to accumulation of solutes. Turgor pressure may be sensed and regulated by a mitogen-activated protein kinase (MAPK) cascade or stretch-activated channels, such as mid1. If the site of water uptake required for the volume increase during growth is distal to the tip, growth-induced mass flows will also help to move organelles and solutes toward the tip. Based on references , , , and . (B) Water uptake into the hypha occurs to allow tip expansion and is driven by the transverse hydrostatic pressure in response to the difference in concentration of osmotically active solutes between the medium and the hypha. The transverse hydraulic conductivity depends on the permeability of the plasma membrane and aquaporins (AQPs) in parallel, and the wall and other surface layers, such as hydrophobins, in series. Longitudinal flow in the lumen of the hypha is lamina and follows Poiseuille flow. Based on references , , , and . (C) Variation in septal pore structure in different fungal taxa. Redrawn from reference with permission. (D) Impact of the septa and septal pores on fluid flows. The change in cross-sectional area causes an increase in velocity by several orders of magnitude and also increases the wall shear stress within the pore. Flow may deviate from parabolic profile expected from the Hagen-Poiseuille equation because of the density of organelles in the cytoplasm. In addition, there may be eddy currents near the pore opening that trap nuclei, vacuoles, and other organelles. Based on references , , , and .
FIGURE 2
FIGURE 2
Mycelial network formation: branching, fusion, and multihyphal aggregate formation. (A) Hyphae may branch subapically or by tip splitting to explore the substrate or to form aerial hyphae that are often insulated by hydrophobins. At the colony margin, tips avoid each other, while secondary branch hyphae in the colony interior can show positive autotropism and fuse by anastomosis. (B) The velocity of mass flow within the network depends critically on the site of water uptake for growth. If all water uptake is distal from the tips, the velocity scales in proportion to the number of downstream tips. If uptake is equal everywhere, the flow rate is constant at the speed of hyphal extension, while if uptake is solely at the tips, there is no long-distance movement. Based on references and . (C) Schematic representation of the formation of strands, cords, and rhizomorphs, showing progressive differentiation of vessel hyphae as potential conduits for long-distance transport. Scale bars are approximate. Based on references , , , , and . (D) Schematic representation of how circulating fluid flows might operate within a hyphal cord. Acropetal mass flows would take place in the vessel hyphae in response to growth, evaporation, or exudation at the tips, while basipetal flows take place simultaneously through cytoplasmic hyphae by cytoplasmic streaming. Redrawn from reference with permission.
FIGURE 3
FIGURE 3
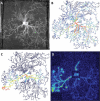
Growth-induced mass flows explain long-distance nutrient movement in Phanerochaete velutina. (A) Structure of the mycelial network after 21 days growing from a wood resource across compressed black sand. (B) The network architecture is extracted using intensity-independent, phase-congruency tensors and watershed segmentation from experimental time series. The output is a set of weighted adjacency matrices of the length, width, and volume of each cord. In this image, the cord width is pseudo-color coded from 50 μm (blue) to 500 μm (red). (C) The network structure and growth are input into a biophysical advection/diffusion/delivery (ADD) model, using growth-induced mass flow to predict the pattern of resource translocation. The predicted amount of radiolabel is color coded on a rainbow scale from blue (zero) to red (maximum). (D) The actual pattern of nutrient movement is then determined experimentally by using the nonmetabolized amino acid analogue 14C-amino isobutyrate (14C-AIB) and photon-counting scintillation imaging (PCSI). The amount of 14C-AIB is color coded on a rainbow scale from blue (low) to red (high). The ADD model of growth-induced mass flow predicts the distribution of radiotracer in a complex network of fungal cords with a Pearson correlation coefficient 0.56. From Heaton et al. (32) with permission.
FIGURE 4
FIGURE 4
Mycelial networks in woodland. (A) Map of a mycelial cord network of Phanerochaete velutina revealed by carefully removing surface litter layer, recovering, and then re-revealing 13 months later. From Thompson and Rayner (155) with permission. (B) Network of Megacollybia platyphylla on the floor of a mixed deciduous woodland, following removal of surface litter.
FIGURE 5
FIGURE 5
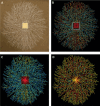
Effects of resource addition and grazing on mycelial networks. Mycelial cord systems (99 days old) of Phanerochaete velutina growing from centrally positioned beech wood inocula across the surface of compressed nonsterile soil in 50 × 50 cm trays. (A) With four additional beech wood blocks added behind the mycelial margin 36 days after central inoculation. (B) With no additional resources added. (C) As in A, but with 250 laboratory-reared collembola, Folsomia candida, added 49 days after the central inoculums. (D) As in C, but with no additional resources. From Wood et al. (170), with permission.
FIGURE 7
FIGURE 7
Macroscopic network analysis of Phallus impudicus growing on compressed soil. (A) Original image of the mycelial network after 21 days. (B) Network architecture automatically extracted using phase-congruency edge enhancement, watershed segmentation, and link pruning to give a single-pixel-wide skeleton pseudo-color coded by the cord width. (C) Conversion to a graph representation whereby each node (junction or tip) is connected by edges that are pseudo-color coded by the average width of the cord segment from 50 μm (blue) to 500 μm (red). The structure of the network within the wood resource cannot be defined so any cord incident on the boundary is connected to a central node with a link set to the maximum width. (D) Characterization of the cord betweenness centrality as a measure of how important each cord is to transport through the network from the resource to every other node, with the color code ranging from blue (low importance) to red (high importance).
FIGURE 6
FIGURE 6
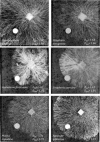
Species variation in fractal dimensions. Mycelia of six wood decay fungi extending, for 28 days, from centrally positioned beech wood inocula across the surface of compressed nonsterile soil in 24 x 24 cm trays. White circles are inert plastic discs. Note the different surface (DBS) and mass (DBM) fractal dimensions of the mycelia of different species. Photographs courtesy of Damian P. Donnelly. From reference with permission.
FIGURE 8
FIGURE 8
Network taxonomy. Taxonomies of 270 fungal (and slime mold) networks based on community structure using modularity optimization with path score (PS) values as the edge weights (205). The dendrogram was produced from the mesoscopic structure of each network as an indication of how similar different networks are to each other. The species abbreviations are coded as follows: Pp, Physarum polycephalum; Pv, Phanerochaete velutina; Ag, Agrocybe gibberosa; Pi, Phallus impudicus; Rb, Resinicium bicolor; and Sc, Strophularia caerulea. The levels of resources and amount of grazing are color coded from low (blue) to high (red). Substrate is coded as blue for agar, white for sand, and red for compressed, nonsterile soil. Interactions are coded as blue for no interaction, or red grown in competition with Hypholoma fasciculare. At the bottom of the figure, the logarithms of number of nodes N, number of edges M, and the edge density ρ = 2M/N(N − 1) are also shown. From reference with permission.
FIGURE 9
FIGURE 9
In silico evaluation of network robustness. Networks of Phanerochaete velutina (red) and Phallus impudicus (green) were attacked in silico by progressively removing links in the network at random, and calculating the number of paths in the network that still remain. In each case, five examples are shown. Note that the P. velutina network breaks down more rapidly than the P. impudicus. From D. A’Bear, L. Boddy, and M. D. Fricker, unpublished data.
FIGURE 10
FIGURE 10
Network analysis of the ectomycorrhizal fungus Paxillus on pine. (A) Pinus seedling infected with Paxillus. The dotted white circle marks the loading site for radioactive 14C-AIB. The dotted red lines indicate the routes for preferential transport of isotope to the roots from C. (B) Automated extraction of both the plant root and extra-radical mycorrhizal network using phase-congruency enhancement, watershed segmentation, and cord width measurement. (C) Scintillation image of nutrient movement along selected pathways from the fungus to the plant root. From R. Tajuddin, D. Johnson, and M.D. Fricker, unpublished data.

References

    1. Buller AHR. 1924. Researches on Fungi, vol 3. Longmans Green, London, United Kingdom.
    1. Buller AHR. 1931. Researches on Fungi, vol 4. Longmans Green, London, United Kingdom.
    1. Buller AHR. 1933. Researches on Fungi, vol 5. Longmans Green, London, United Kingdom.
    1. Riquelme M. 2013. Tip Growth in Filamentous Fungi: A Road Trip to the Apex. Annu Rev Microbiol 67:587–609. [PubMed] - PubMed
    1. Mouriño-Pérez RR, Riquelme M. 2013. Recent advances in septum biogenesis in Neurospora crassa. Adv Genet 83:99–134. [PubMed] - PubMed

Publication types

MeSH terms

LinkOut - more resources