. 2017 May 19:8:15322.
doi: 10.1038/ncomms15322.

Surface chemistry governs cellular tropism of nanoparticles in the brain

Affiliations

Surface chemistry governs cellular tropism of nanoparticles in the brain

Eric Song et al. Nat Commun. .

Abstract

Nanoparticles are of long-standing interest for the treatment of neurological diseases such as glioblastoma. Most past work focused on methods to introduce nanoparticles into the brain, suggesting that reaching the brain interstitium will be sufficient to ensure therapeutic efficacy. However, optimized nanoparticle design for drug delivery to the central nervous system is limited by our understanding of their cellular deposition in the brain. Here, we investigated the cellular fate of poly(lactic acid) nanoparticles presenting different surface chemistries, after administration by convection-enhanced delivery. We demonstrate that nanoparticles with 'stealth' properties mostly avoid internalization by all cell types, but internalization can be enhanced by functionalization with bio-adhesive end-groups. We also show that association rates measured in cultured cells predict the extent of internalization of nanoparticles in cell populations. Finally, evaluating therapeutic efficacy in an orthotopic model of glioblastoma highlights the need to balance significant uptake without inducing adverse toxicity.


Conflict of interest statement

The authors declare no competing financial interests.

Figures

Figure 1
Figure 1. NP physico-chemical characterization using electron microscopy and dynamic light scattering.
(a) Schematic of PLA-based NPs with different surface coatings. (b) Particle morphology and population was imaged using TEM after staining with uranyl acetate, with each image corresponding to the image above in Fig. 1a (representative image of N=3 biological replicates, scale bar=100 nm). Particle characterization with dynamic light scattering (c) and laser doppler anemometery (d) displayed similar hydrodynamic diameters and zeta potential respectively for all particle types. Size analysis was conducted in water (c) and zeta potential was measured in water and in artificial cerebrospinal fluid (aCSF), showing the neutralization of all particle surface charge in aCSF (results are presented as mean±s.d. of N=3 biological replicates) (d). (e) Particle size was shown to be stable in 37 °C aCSF without measurable aggregation for up to 24 h (representative graph of N=3 biological replicates).
Figure 2
Figure 2. Volume of distribution after administration by CED.
(a) When fluorescently labelled particles were infused in healthy Fischer 344 rats via CED, they displayed similar volumes of distribution (Vd; results are presented as mean±s.d. of N=3 biological replicates). (b) i–iv, for all particle types, distribution in the healthy brain was homogeneous through the whole caudate (representative image of N=3 biological replicates, scale bar, 4 mm). (c) When infused in Fischer 344 rats bearing RG2 tumours grown for 7 days, the different formulations displayed similar volumes of distribution (Vd), except for the PLA NPs that appeared to distribute more widely (results are presented as mean±s.d. of N=3 biological replicates). (d) i–iv, for all particle types, distribution pattern was more heterogeneous in the tumour-bearing brain compared to the healthy brain because of the presence of the tumour mass (representative image of N=3 biological replicates, scale bar, 4 mm).
Figure 3
Figure 3. Cellular tropism of NPs 4 and 24 h after introduction into the interstitium of the healthy brain.
(a) Schematic of cell population shift and calculated MFI value, more detailed methods are outlined in the Method section and Supplementary Fig. 2. (b) Mean fluorescence intensity of each cell population in the DiA channel measured by flow cytometry (results are presented as mean±s.d. of N=5 biological replicates, experiments of same particle type were done on different days to ensure reproducibility of processing, two control brains were harvested each day, statistical analysis was performed using a two-sided Student's t-test, *P<0.05, #P<0.005). The particles were delivered at a concentration of 50 mg ml−1 and the MFI was normalized by the relative loading of the dye (Supplementary Fig. 1). (c) Absolute amount of fluorescence at 4 and 24 h for all particle types was derived by multiplying the MFI by the relative number of cells in each population, also measured by flow cytometry (refer to methods, statistical analysis was performed using a two-sided Student's t-test, *P<0.05). Total area of the pie charts denotes the sum of the absolute fluorescence within the three cell populations, representing the total NP uptake by these cells, and each slice gives the relative particle uptake for each cell population (Supplementary Table 1).
Figure 4
Figure 4. Confocal images illustrating cellular tropism of NPs 4 and 24 h in the healthy brain.
(ad) Brain slices stained for astrocytes (GFAP in white), showing that PLA–HPG–CHO NPs (red) produced an up-regulation of GFAP protein, characteristic of reactive astrocytes (d), while PLA, PLA–PEG (red) and PLA–HPG NPs (red) did not (a,b,c) at 4 h. (eh; GFAP in white) After 24 h, all particles except PLA–HPG NPs (red) (g) induced an up-regulation of GFAP proteins. (il) Brain slices stained for microglia (Iba-1 in white), showing that PLA (red) and PLA–HPG–CHO NPs (red) activated microglia (i,l, microglia present mostly in amoeboid shape), while PLA–PEG (red) and PLA–HPG NPs (red) did not (j and k, microglia retain their ramified state) at 4 h. (mp; iba-1 in white) After 24 h, all particles except PLA–HPG NPs (red) (o) activated microglia, with PLA–HPG–CHO NPs (red) showing the largest amount of particles in the perinuclear space (p, Supplementary Fig. 8). For each particle type and staining, the image is representative of three slides from one animal. All images were stained with DAPI (blue) for nuclear visualization. (Scale bar, 20 μm for zoomed in images and 50 μm for larger images).
Figure 5
Figure 5. Cellular composition of rat brains with and without orthotopic tumours.
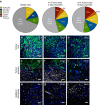
Cell populations were determined using flow cytometry in the healthy brain and the tumour-bearing brain, after 7 and 8 days of tumour growth following the implantation of 250,000 RG2-GFP cells (N=6 biological replicates). (a) Pie charts of cellular content from fluorescence-activated cell sorting analysis of healthy and tumour-bearing brains. The other counts include cells, but also debris that could not be gated out successfully. The amount of neurons appeared constant between the different brains. The amount of microglia cells was slightly increased in the presence of the tumour, likely due to the recruitment of TAM. In the tumour-bearing brain, a small amount of tumour cells was positive for GFAP labelling, in accordance with the astrocytic origin of RG2 tumours (green). Representative confocal images of microglia (white) (bd), astrocytes (white) (eg) and neurons (white) (hj) in the tumour bulk, around the periphery of the tumour and on the edge of the ipsilateral hemisphere. (c,f) High density of microglia and astrocytes border the tumour periphery and recruitment of activated microglia/tumour-associated macrophages is notable in the tumour bulk (b). For each cell type and area the image is representative of three slides from one animal. All images were stained with DAPI (blue) for nuclear visualization. (Scale bar, 50 μm).
Figure 6
Figure 6. Cellular tropism of NPs 4 and 24 h after CED in the tumour-bearing brain.
(a) i–iv, representative histograms of population shift of tumour cells, after internalization of NPs loaded with DiA at 4 and 24 h (red and blue respectively). The per cent shift is an average of N=5 biological replicates (experiments of same particle type were done on different days to ensure reproducibility of processing, two control brains were harvested each day) and the MFI of the shifted population is displayed in Supplementary Fig. 12. (bi) Absolute amount of fluorescence was derived by multiplying the MFI by the relative number of cells in each population, also measured by flow cytometry. Total area of the pie charts denotes the sum of the absolute fluorescence within the four cell populations, representing the total NP uptake by these cells and each slice gives the relative particle uptake for each cell population. Change in uptake between 4 h (be) and 24 h time points (fi) show markedly increased selective uptake by tumour cells compared to other cell populations. A statistical analysis was performed using a two-sided Student's t-test to compare the tumour fractions of each particle type to the reference formulation, PLA NPs (*P<0.05). (j,l) Confocal image of microglia staining (white) 4 h after CED. Orange arrow indicates microglia/tumour-associated macrophage with perinuclear uptake of NPs. Yellow arrow indicates perinuclear uptake of NPs (red) by RG2-GFP cells (green). (k,m) Confocal image of astrocyte staining (white) 4 h after CED. Orange arrow indicates GFAP-positive RG2-GFP processes and yellow arrow indicates GFAP-positive RG2-GFP cell body with perinuclear NP uptake. For each particle type, the image is representative of three slides from one animal. (Scale bar, 20 μm for zoomed in images and 50 μm for larger images).
Figure 7
Figure 7. In vitro rates of uptake correlate with uptake of NPs in specific cell types in vivo.
(a) Fitting of kinetic of association equation to NP in vitro uptake data. Similar fits were achieved for all NP/cell combinations with the parameters described (refer to Supplementary Fig 10, results are presented as mean±s.d. of N=3 biological replicates, experiment was reproduced twice). (b) An association rate, or rate of uptake, was then derived from the data and normalized to the lowest rate (PLA NPs in neurons). Each point is the mean±s.d. of N=3 biological replicates. (c,d) In vivo MFI values for 4 and 24 h in healthy (c) and tumour-bearing (d) brains (in both cases, results are presented as mean±s.d. of N=5 biological replicates). (eh) Linear regression fit of normalized rate of uptake in vitro to MFI values of specific cell populations in vivo (results are presented as mean±s.d. of N=3 biological replicates for the x axis and N=5 biological replicates for the y axis). Linear regression analysis showed statistically significant slopes (P<0.001) in all cases and a R2 value ranging from 0.5387 to 0.8397. Each graph is followed by a corresponding schematic of different rate processes present in each condition, with rate of NP association with cells (kon), rate of NP loss to capillaries (ksys), rate of NP loss to CSF (kCSF) and rate of cellular mitotic rate (kmit) depicted with size of arrows.
Figure 8
Figure 8. In vivo therapeutic efficacy and toxicity after administration by CED.
The four particle formulations were engineered to encapsulate the same amount of EB while retaining similar physico-chemical properties (Supplementary Table 2). (a) The four formulations presented the same release pattern, with a burst release during the first hours of incubation, followed by a slow release over the following days of incubation. This suggests that the overall drug release pattern is mainly governed by the nature of the NPs core (which is PLA for all the NPs formulation), and not dramatically influenced by surface modifications. (b) The four formulations were administered by CED to rats bearing RG2 tumours grown for 7 days to assess therapeutic efficacy. Administration of free EB did not significantly increased the mean survival time of the animals compared to the control treatment (PBS). In accordance with their internalization profiles, PLA and PLA–HPG–CHO NPs significantly extended the mean survival time, while the benefit observed after the administration PLA–PEG NPs was limited. Unexpectedly, PLA–HPG NPs provided the same survival benefit as the two most internalized formulations, despite limited uptake. (c) i–iv, haematoxylin and eosin (H&E) staining of brains, 3 days (short-term) after administration of the different formulation by CED. Microhemorrhages along the needle track from disturbance of microvasculture was noted in all groups, and in the PLA–HPG–CHO NP infused brains, large density of cells, identified as neutrophils, seemed to be recruited. (Scale bar, 200 μm) (d) i–iv, H&E staining of brains, 3 weeks (long-term) after administration of the different formulation by CED. No signs of neurotoxicity was observed in any group, but hemosiderin laden macrophages were still present at this time point in the PLA and PLA–HPG–CHO NP infused brains. (Scale bar, 50 μm).

Similar articles

Cited by

References

    1. Ferrari M. Cancer nanotechnology: opportunities and challenges. Nat. Rev. Cancer 5, 161–171 (2005). - PubMed
    1. Wen P. Y. & Kesari S. Malignant gliomas in adults. N. Engl. J. Med. 359, 492–507 (2008). - PubMed
    1. Pardridge W. M. The blood-brain barrier: bottleneck in brain drug development. NeuroRx 2, 3–14 (2005). - PMC - PubMed
    1. Cheng C. J., Tietjen G. T., Saucier-Sawyer J. K. & Saltzman W. M. A holistic approach to targeting disease with polymeric nanoparticles. Nat. Rev. Drug Discov. 14, 239–247 (2015). - PMC - PubMed
    1. Gao H., Pang Z. & Jiang X. Targeted delivery of nano-therapeutics for major disorders of the central nervous system. Pharm. Res. 30, 2485–2498 (2013). - PubMed

Publication types

MeSH terms