. 2017 Jul;24(7):1239-1252.
doi: 10.1038/cdd.2017.52. Epub 2017 May 19.

A defined metabolic state in pre B cells governs B-cell development and is counterbalanced by Swiprosin-2/EFhd1

Affiliations

A defined metabolic state in pre B cells governs B-cell development and is counterbalanced by Swiprosin-2/EFhd1

Merle Stein et al. Cell Death Differ. 2017 Jul.

Abstract

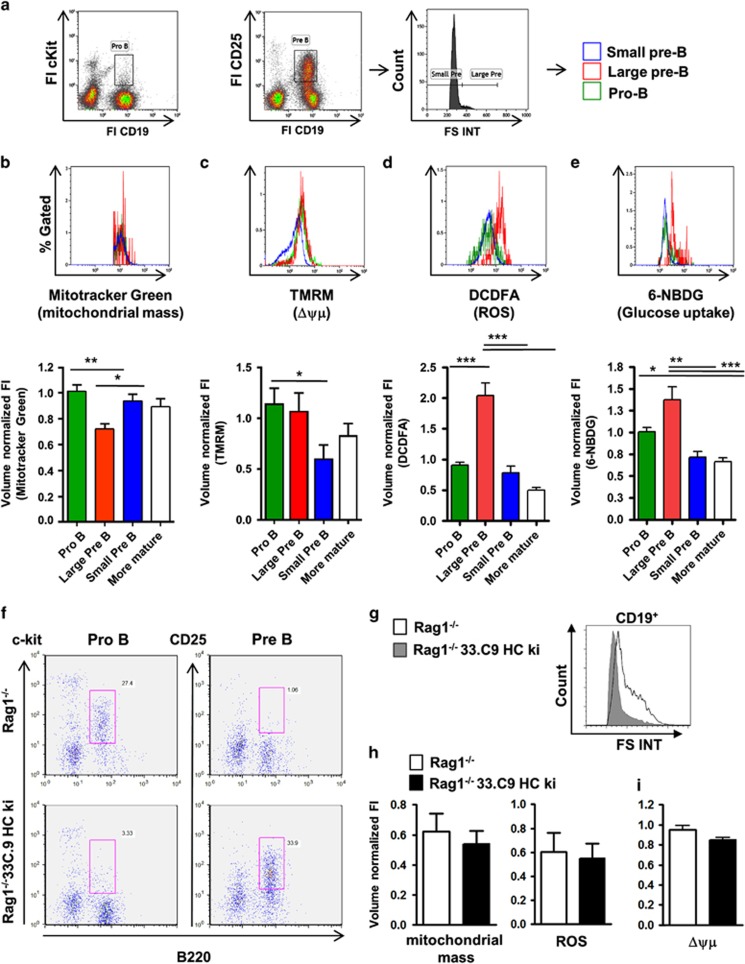
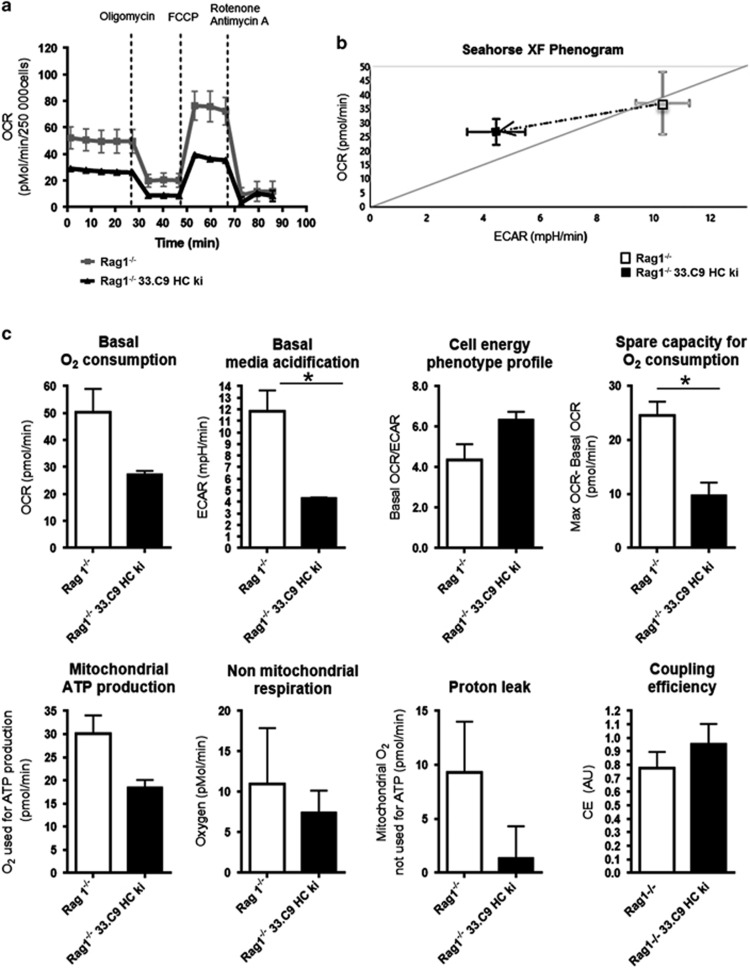
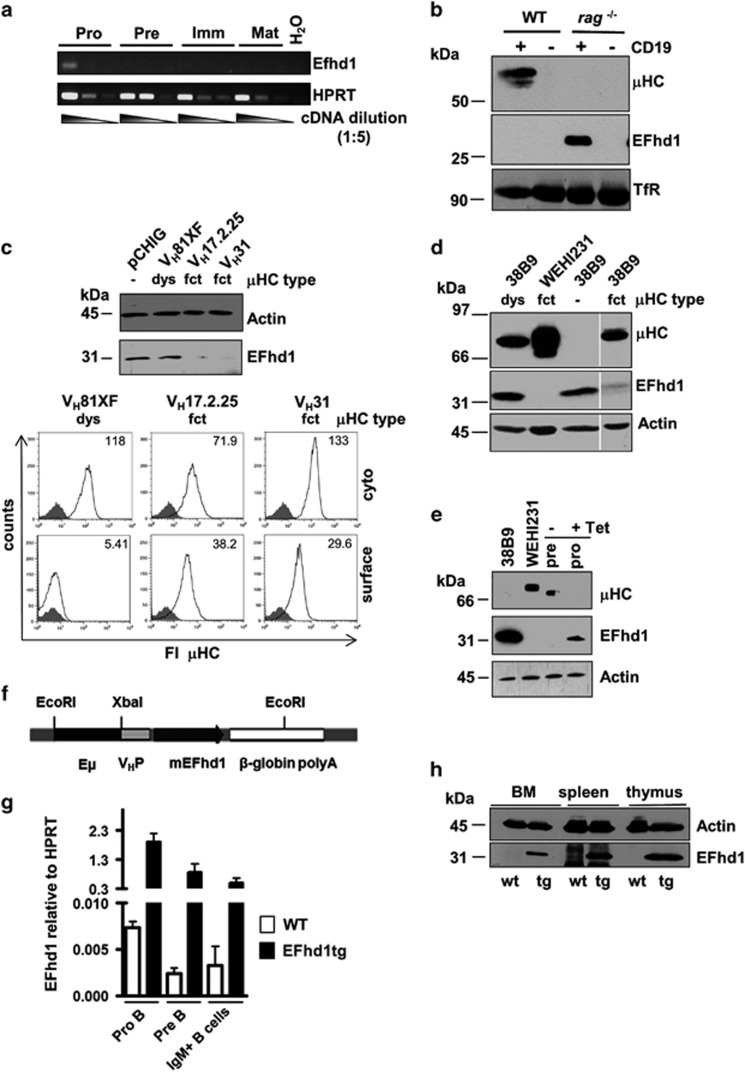
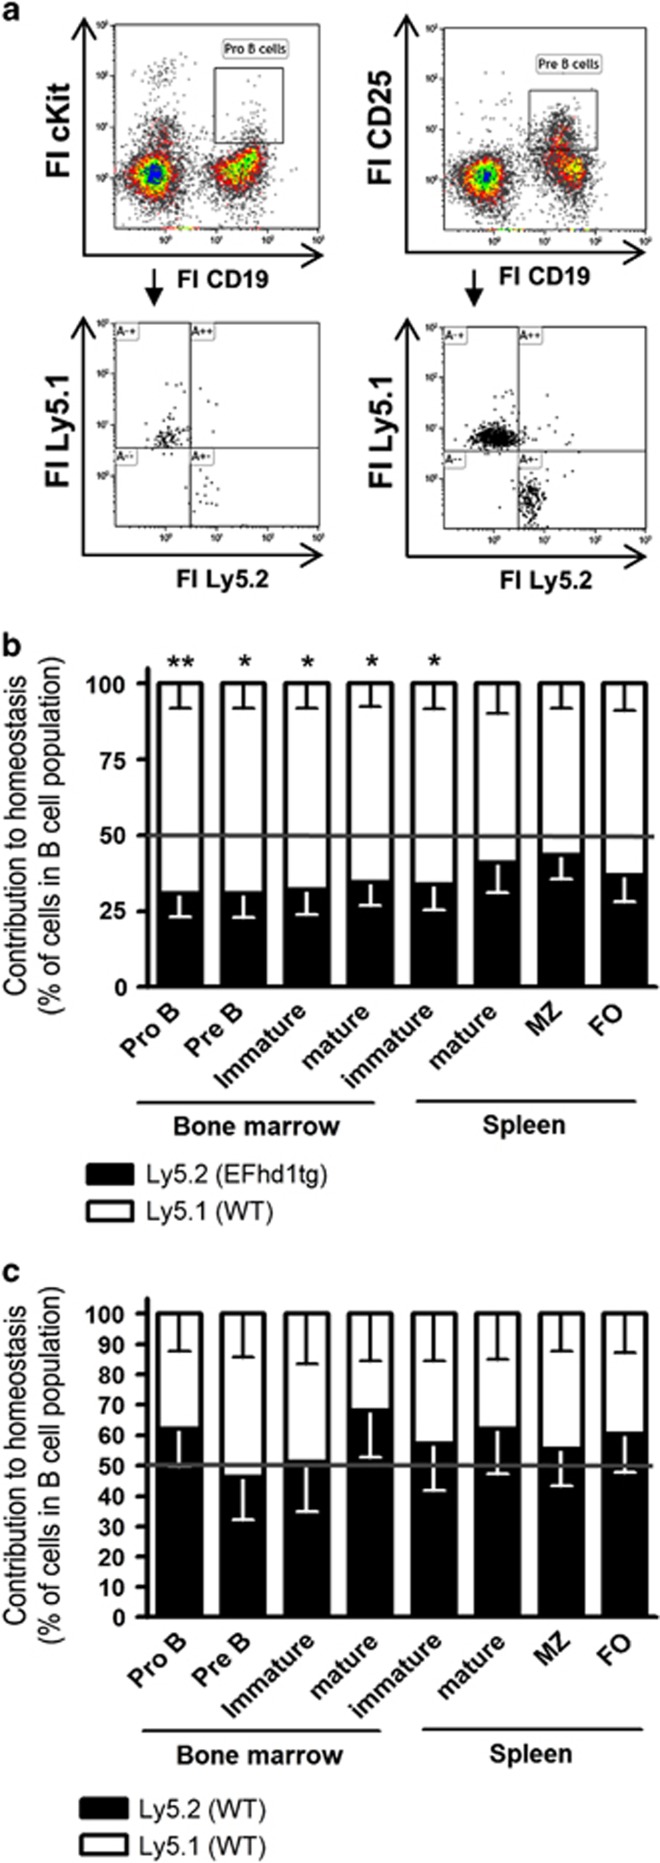
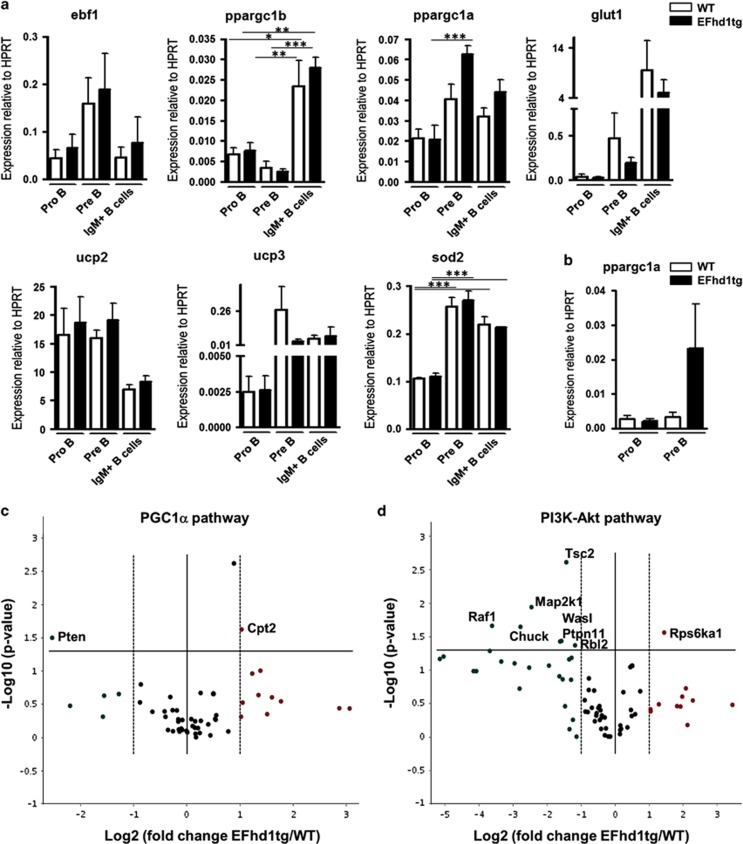
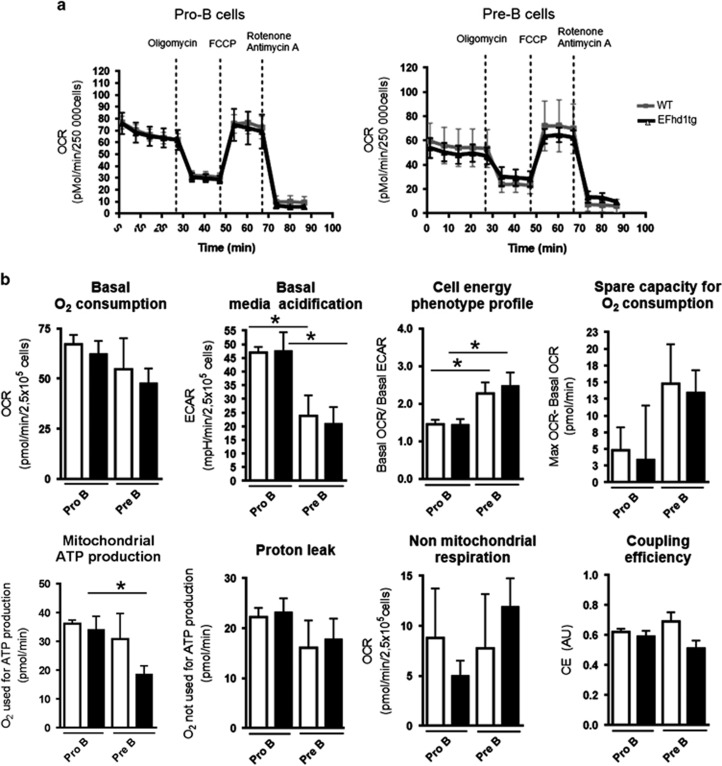
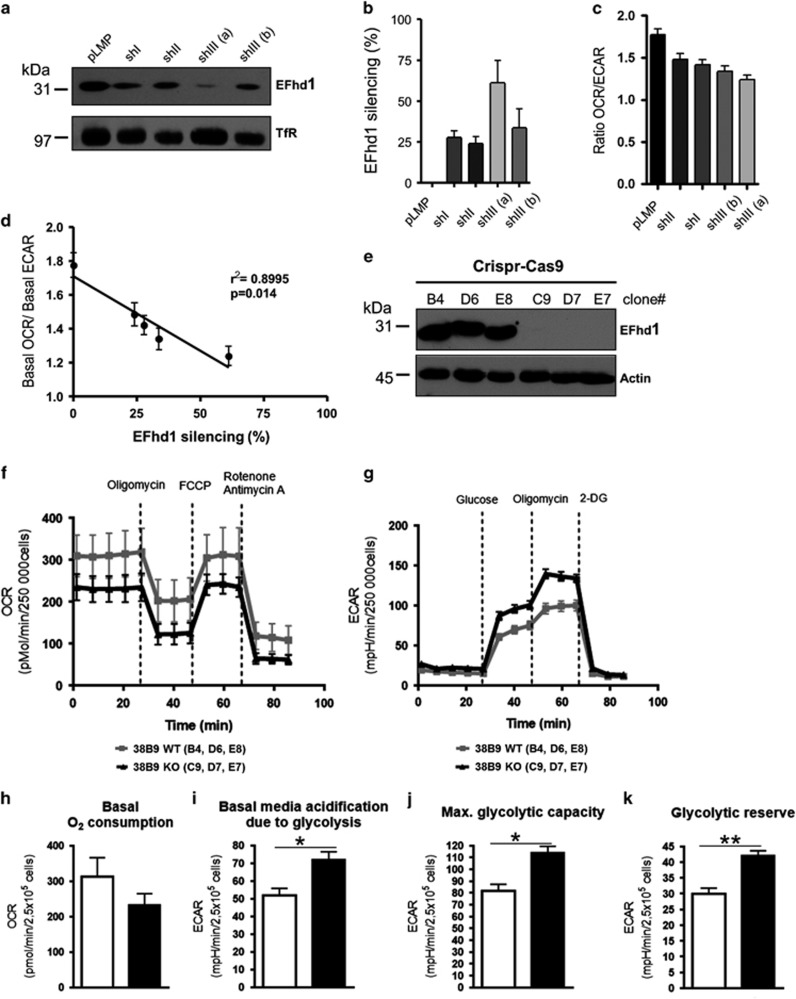
B-cell development in the bone marrow comprises proliferative and resting phases in different niches. We asked whether B-cell metabolism relates to these changes. Compared to pro B and small pre B cells, large pre B cells revealed the highest glucose uptake and ROS but not mitochondrial mass, whereas small pre B cells exhibited the lowest mitochondrial membrane potential. Small pre B cells from Rag1-/-;33.C9 μ heavy chain knock-in mice revealed decreased glycolysis (ECAR) and mitochondrial spare capacity compared to pro B cells from Rag1-/- mice. We were interested in the step regulating this metabolic switch from pro to pre B cells and uncovered that Swiprosin-2/EFhd1, a Ca2+-binding protein of the inner mitochondrial membrane involved in Ca2+-induced mitoflashes, is expressed in pro B cells, but downregulated by surface pre B-cell receptor expression. Knockdown and knockout of EFhd1 in 38B9 pro B cells decreased the oxidative phosphorylation/glycolysis (OCR/ECAR) ratio by increasing glycolysis, glycolytic capacity and reserve. Prolonged expression of EFhd1 in EFhd1 transgenic mice beyond the pro B cell stage increased expression of the mitochondrial co-activator PGC-1α in primary pre B cells, but reduced mitochondrial ATP production at the pro to pre B cell transition in IL-7 cultures. Transgenic EFhd1 expression caused a B-cell intrinsic developmental disadvantage for pro and pre B cells. Hence, coordinated expression of EFhd1 in pro B cells and by the pre BCR regulates metabolic changes and pro/pre B-cell development.


Conflict of interest statement

The authors declare no conflict of interest.

Figures

Figure 1
Figure 1
Analysis of mitochondrial activity and glucose uptake of pro and pre B cells by flow cytometry. (a) BM cells from C57BL/6 mice were incubated with fluorescent probes and then simultaneously stained for surface antigens (Pro B cells: CD19+, cKit+, large pre B cells: CD19+, CD25+, FS INThi, small pre B cells: CD19+, CD25+, FS INTlow and more differentiated B-cell populations (CD19+, cKit, CD25) and analyzed by flow cytometry. Representative plots of the median fluorescence intensity for Mitotracker Green (b), TMRM (c), DCFDA (d) and 6-NBDG (e) are shown. Fluorescence was normalized to spheroid cell volume by FS TOF signal as an indicator for cell size. TMRM fluorescence was normalized with CCCP. Data were normalized to pro B cells and are represented as median±S.E.M., n=10 C57BL/6 mice from two experiments (b, d and e), n=5 mice from four experiments (c). Significance was tested by ANOVA with Bonferroni correction, except for C (two-tailed Student’s t-test; only pro and small pre B cells were compared). (f) BM of Rag1−/− and Rag1−/− 33.C9μHCki mice was analyzed by flow cytometry (Pro B cells: CD19+, cKit+, pre B cells: CD19+, CD25+), (g) Histograms representing FS Int of pro and pre B cells of Rag1−/− and Rag1−/− 33.C9μHC ki mice, (h) CD19-positive BM cells of Rag1−/− and Rag1−/−;33.C9μHCki mice were stained with Mitotracker Green and DCDFA, analyzed by flow cytometry and normalized to cell volume and pro B cells. Results are represented as mean±S.D., n=5, (i) CD19-positive BM cells of 5 Rag1−/− and Rag1−/−;33.C9μHCki mice were stained with TMRM, duplicate CCCP-calibrated samples were analyzed by flow cytometry and normalized to cell volume and pro B cells. Results are represented as mean±S.E.
Figure 2
Figure 2
Influence of μ heavy chain expression on metabolic activity of BM B lymphocytes. (a) BM cells of Rag1−/− and Rag1−/−;33.C9μHCki mice were pooled and pro and pre B lymphocytes were isolated by positive selection (anti-CD19) from Rag1−/− and Rag1−/− 33.C9 HC ki mice. Mitochondrial activity of pro and pre B cells was directly analyzed by Mito Stress Test with a Seahorse XFe96 extracellular flux analyzer. Five readings were taken for basal oxygen consumption rate (OCR) before subsequent addition of oligomycin, FCCP and antimycin+rotenone; summary of three experiments with each two to four pooled mice, (b) Representative cellular energy phenotype profiles (basal OCR/ basal extracellular acidification (ECAR) of Rag1−/− and Rag1−/−;33.C9μHCki cells from one experiment are compared in a 2D plot, (c) The basal OCR, ECAR and the cell energy phenotype profile (OCR/ECAR) are shown as bar diagrams. Also shown are the mitochondrial spare capacity (the increase from basal to maximum OCR when uncoupling mitochondrial proton flow by FCCP), the mitochondrial ATP production rate (OCR, which can be blocked by adding the mitochondrial ATPase inhibitor oligomycin), the non-mitochondrial respiration (O2 consumption after inhibition of mitochondria by oligomycin, (FCCP), antimycin and rotenone), proton leak (difference in O2 consumption after oligomycin and full mitochondrial inhibition by additional antimycin A and rotenone) and coupling efficiency (ratio of mitochondrial ATP production and proton leak). Summary of n=3 with each two to four pooled mice
Figure 3
Figure 3
Downregulation of EFhd1 by the pre BCR and establishment of EFhd1tg mice. (a) Pro, pre and immature B cells of the BM were isolated through FACS and mature B cells of the spleen by MACS. Total RNA from the indicated cells was isolated, reversely transcribed to cDNA and amplified with efhd1 or hprt-specific primers in fivefold serial dilutions, (b) BM cells of WT and Rag1−/− mice positively purified via anti-CD19 and protein lysates of CD19+ and CD19 cells were subjected to western blot analysis using anti transferrin receptor (TfR), anti μHC and anti EFhd1 antibodies, (c) IL-7-dependent μHC-negative R5B pro B cells were infected with retroviral particles derived from pCHIG or various functional (fct) and dysfunctional (dys) μHC idiotypes cloned into pCHIG, selected and analyzed by western blot using anti Actin and anti EFhd1 antibodies (upper panel). Cells were either analyzed for surface μHC or cytoplasmic μHC expression by flow cytometry (lower panel). MFI is indicated, (d) Lysates of WEHI231 cells, 38B9 cells expressing no μHC, a dysfunctional or a functional μHC were subjected to western blot analysis using anti μHC, anti Actin and anti EFhd1 antibodies. Alle lanes are from the same western blot and exposure, (e) Lysates of 38B9, WEHI231 and pro and pre B cells obtained from a double transgenic tetracycline (tet)-off controlled SP6 μHC expression system were subjected to western blot analysis using anti μHC, anti Actin and anti EFhd1 antibodies. In this experiment, 73.6% of induced cells (- tet) expressed the SP6 μHC, (f) Schematic of the transgenic expression cassette, Eμ: μ enhancer, VHP: VH promoter, (g) Pro, pre and immature B cells isolated through FACS from wild-type or EFhd1tg mice were analyzed by qPCR for EFhd1 expression, (h) Protein lysates of total BM, spleen and thymus were analyzed by western blot using anti Actin and anti EFhd1 antibodies. Molecular mass standards are indicated on the left (kDa)
Figure 4
Figure 4
Contribution of EFhd1tg precursors to B-cell development in mixed bone marrow chimeras. CD45.1 BL6 (Ly5.1) recipient mice were lethally irradiated with 11 Gy and reconstituted with 1 × 10⁶ WT CD45.1 (Ly5.1) and 1 × 10⁶ CD45.2 (Ly5.2) EFhd1tg or wild-type liitermate BM cells. After 6 weeks repopulation, the contribution of CD45.1 and CD45.2 to B-cell populations in the BM and spleen was analyzed by flow cytometry for pro B (CD19+, cKit+), pre B (CD19+, CD25+), immature (CD19+, IgM+, IgD), mature (CD19+, IgM+, IgD+), marginal zone (CD19+, CD21high, CD23) and follicular (CD19+, CD21low, CD23+) B cells. (a) Representative analysis of WT/EFhd1tg chimeras. (b) Summary of WT/EFhd1tg chimeras. (c) Summary of WT/WT chimeras. Data are represented as mean+S.E.M. of 7–11 mice from four experiments. Statistics was done by Mann–Whitney-U test
Figure 5
Figure 5
Expression of metabolic and mitochondrial genes in BM B lymphocyte subsets. (a) BM was isolated from EFhd1tg and WT mice and pro B (CD19+, cKit+, CD25, sIgM), pre B cells (CD19+, cKit, CD25+, sIgM) and BCR+ B cells (CD19+, CD25, cKit, sIgM+) were sorted by FACS. RNA was isolated, and converted into cDNA. Expression of ebf1, ppargc1a, ppargc1b, glut1, ucp2, ucp3 and sod2 was evaluated by SYBR Green qPCR, analyzed with the ΔΔCT method and normalized to hprt. mRNA expression of is represented as mean±S.E.M. of three independent experiments and was tested for statistical significance by ANOVA with Bonferroni correction for multiple testing, (b) RNA was isolated from sorted pro (CD19+, cKit+, sIgM) and pre B (CD19+, cKit, sIgM) of EFhd1tg and WT mice after 7 days culture with 5 ng/ml IL-7. RNA was converted to cDNA and ppargc1a (PGC-1α) expression was analyzed as described in (a). Data is represented as mean+S.E.M. of four independent cultures and sorts per genotype and statistical analysis was carried out by Mann–Whitney-U test. (c and d) RNA was isolated from pre B cells (CD19+, cKit, CD25+, sIgM+) sorted from EFhd1tg and WT BM. cDNA conversion and expression profile analysis were carried out by Qiagen Mouse PPAR Targets (a) or (b) PI3K-Akt pathway RT2 Profiler PCR Array. Data was analyzed with the available online software (www.SABiosciences.com/pcrarraydataanalysis.php). Normalization was carried out by an automatic algorithm against suitable genes of the whole plate. The data are represented as heat map and volcano plot of Log2 fold change in gene expression of EFhd1tg to WT pre B cells against −Log10 of the P-value. Values represent the mean of three EFhd1tg against three WT mice
Figure 6
Figure 6
Metabolic profile of EFhd1tg and WT IL-7 pro B cell cultures. (a) Sorted pro B cells were cultured with 5 ng/ml IL-7. After 7 days, pro (CD19+, cKit+, sIgM) and pre B (CD19+, cKit, sIgM) cells were sorted and metabolic activity of pro and pre B cells from the IL-7 culture was directly determined by Mito Stress Test with a Seahorse XFe96 analyzer. Five basal readings were taken for oxygen consumption rate (OCR) and basal extracellular acidification rate (ECAR). The results are represented as mean±S.E.M. Three readings were taken after complex V (ATPase) inhibition by oligomycin and three readings for maximum OCR were taken after addition of the mitochondrial uncoupler FCCP. (b) An energy phenotype of the cells is calculated by dividing OCR by ECAR. Spare capacity (the increase from basal to maximum OCR) and the mitochondrial ATP production rate (the OCR which can be blocked by adding ATPase inhibitor oligomycin) are shown as bar diagrams. Mitochondrial proton leakage, (OCR which can be further blocked by antimycin A and rotenone after oligomycin administration) and non-mitochondrial respiration (OCR remaining after fully blocking the mitochondria with oligomycin, antimycin A and rotenone) were calculated. The coupling efficiency represents the ratio of mitochondrial ATP production and proton leak. Data are represented as mean±S.E.M. of four independent sorts and seahorse experiments of each time three pooled EFhd1tg and WT mice. Statistical analysis was done by ANOVA with Bonferroni correction for multiple testing
Figure 7
Figure 7
Metabolic profile of 38B9 pro B-cell lines with shRNA-mediated EFhd1 knockdown. (a) 38B9 cells stably transfected with pLMP and four stable knockdown cell lines were analyzed for EFhd1 protein expression by western blot, Molecular mass standards are indicated on the left (kDa). (b) EFhd1 expression was normalized to TfR protein expression and represented as mean percentage±S.E.M. in comparison to pLMP, n=3, (c) The metabolic activity of the 38B9 cell lines was analyzed by Mito Stress Test with a Seahorse XF analyzer. Basal OCR, as well as the basal ECAR and the cell energy phenotype profiles (OCR/ECAR) are represented as mean±S.D. of three to five measurements, (d) Correlation of the percentage of EFhd1 silencing with the cells’ energy phenotype profile (OCR/ECAR), (e) Western blot analysis of Crispr-Cas9 engineered 38B9 EFhd1 knockout and control clones, (f) Mitochondrial activity of of randomly chosen 38B9 WT and EFhd1 knockout clones was analyzed by Mito Stress Test with a Seahorse XFe96 extracellular flux analyzer. Five readings were taken for basal oxygen consumption rate (OCR) before subsequent addition of oligomycin, FCCP and antimycin+rotenone, (g) Glycolytic activity of randomly chosen 38B9 WT and EFhd1 knockout clones was analyzed by Glyco Stress Test with a Seahorse XFe96 extracellular flux analyzer. Five readings were taken for basal ECAR in glucose-free medium before subsequent addition of glucose, oligomycin and 2-deoxyglucose (2-DG), (h) Basal O2 consumption from Mito stress test, (i) Basal media acidification (glycolysis stress test), (j) Maximal glycoloytic capacity after addition of glucose (glycolysis stress test), (k) Maximal glycoloytic capacity after addition of oligomycin (glycolysis stress test). Statistical analysis was done with Student’s t-test

References

    1. Melchers F. The pre-B-cell receptor: selector of fitting immunoglobulin heavy chains for the B-cell repertoire. Nat Rev Immunol 2005; 5: 578–584. - PubMed
    1. Vettermann C, Jäck HM. The pre-B cell receptor: turning autoreactivity into self-defense. Trends Immunol 2010; 31: 176–183. - PubMed
    1. Young F, Ardman B, Shinkai Y, Lansford R, Blackwell TK, Mendelsohn M et al. Influence of immunoglobulin heavy- and light-chain expression on B-cell differentiation. Genes Dev 1994; 8: 1043–1057. - PubMed
    1. Mombaerts P, Johnson RS, Herrup K, Tonegawa S, Papaioannouo VE. RAG-1-deficient mice have no mature B and T lymphocytes. Cell 1992; 68: 869–877. - PubMed
    1. Guo B, Kato RM, Garcia-Lloret M, Wahl MI, Rawlings DJ. Engagement of the human pre-B cell receptor generates a lipid raft-dependent calcium signaling complex. Immunity 2000; 13: 243–253. - PubMed

Substances