. 2018 Jan;24(1-2):94-105.
doi: 10.1089/ten.tea.2017.0091. Epub 2017 May 18.

A Tunable, Three-Dimensional In Vitro Culture Model of Growth Plate Cartilage Using Alginate Hydrogel Scaffolds

Affiliations

A Tunable, Three-Dimensional In Vitro Culture Model of Growth Plate Cartilage Using Alginate Hydrogel Scaffolds

Alek G Erickson et al. Tissue Eng Part A. 2018 Jan.

Abstract

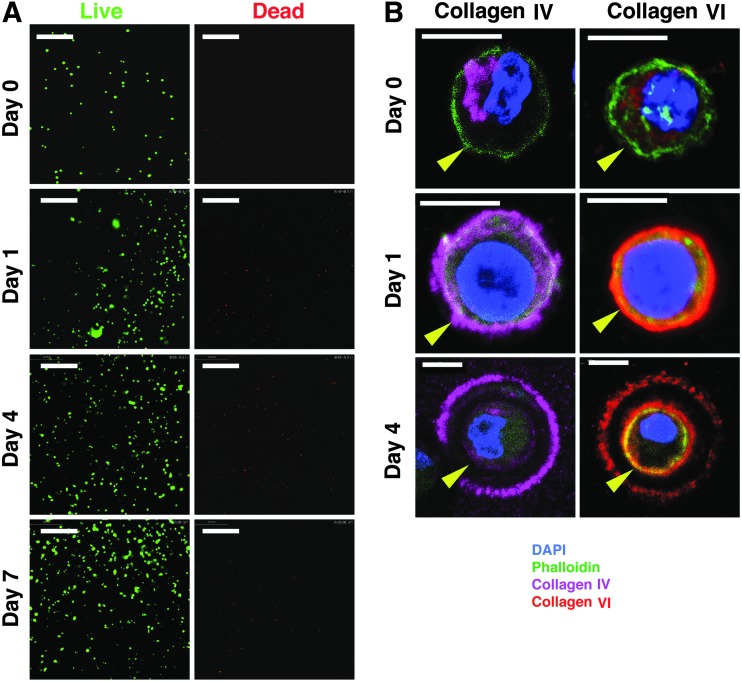
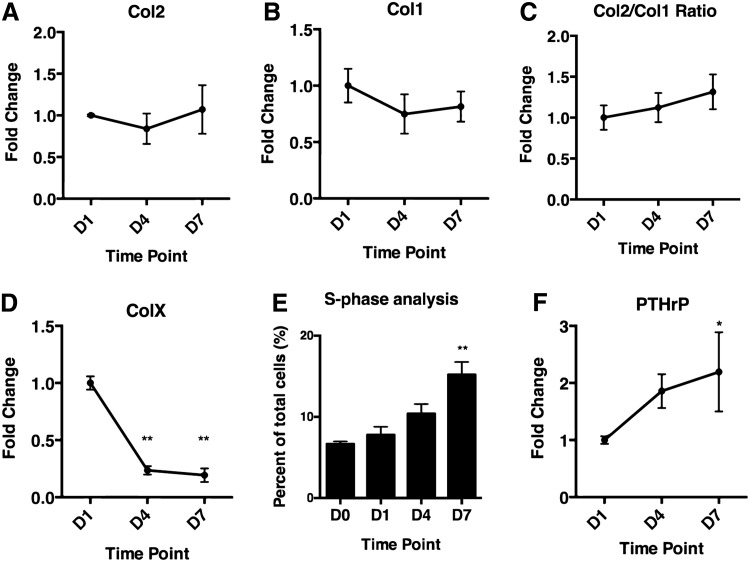
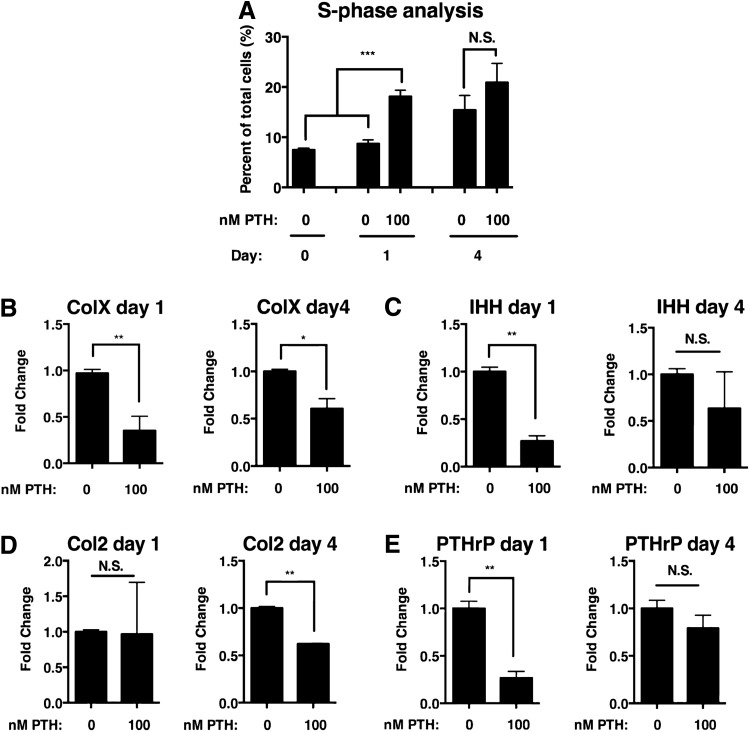
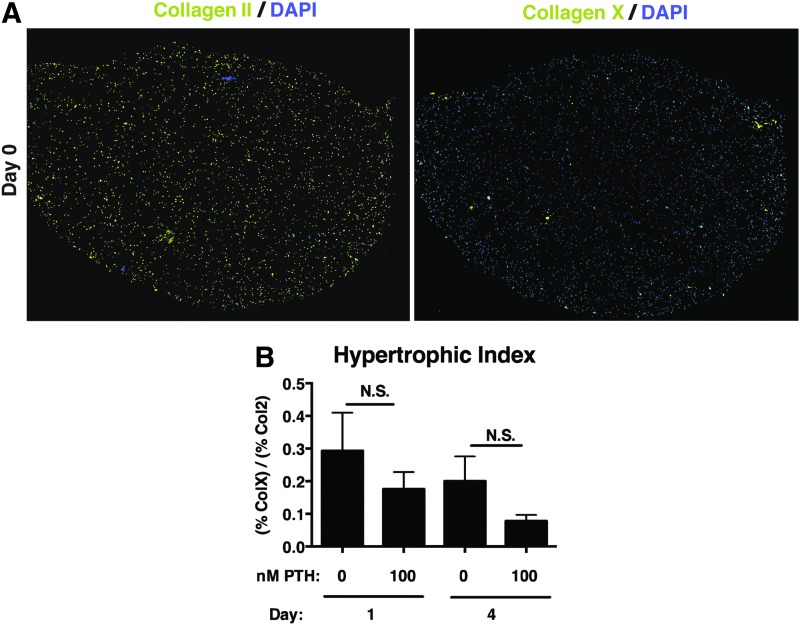
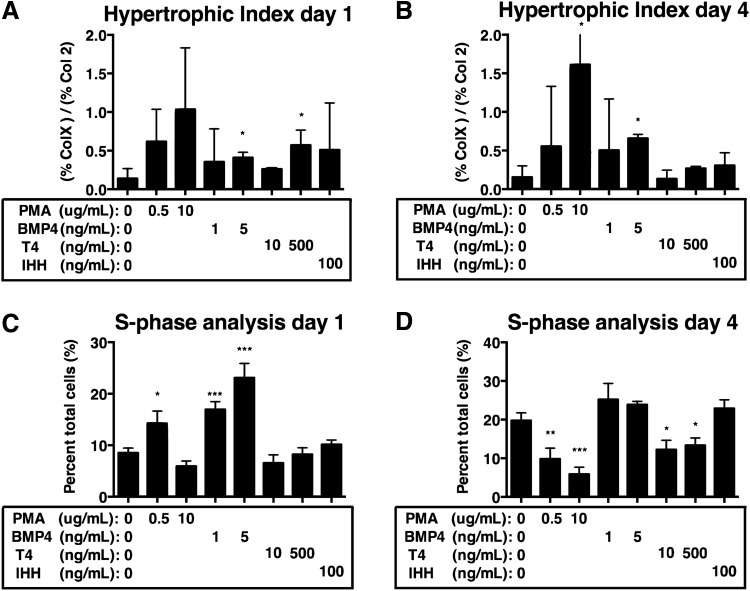
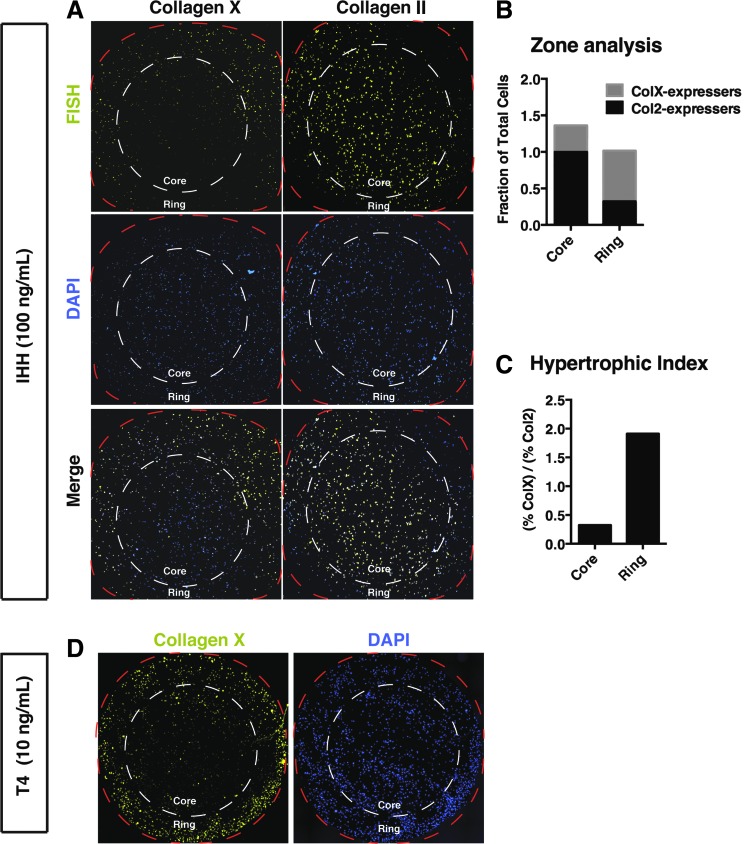
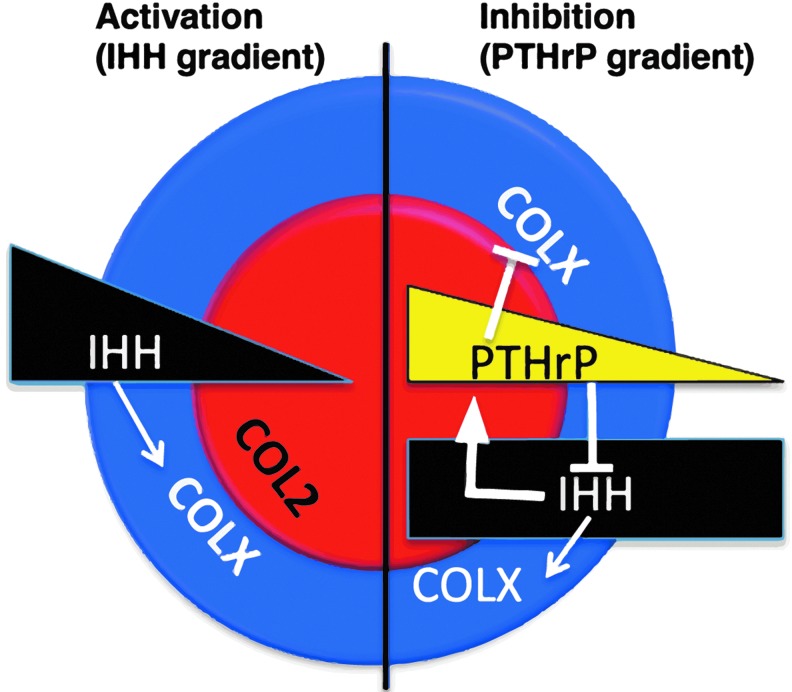
Defining the final size and geometry of engineered tissues through precise control of the scalar and vector components of tissue growth is a necessary benchmark for regenerative medicine, but it has proved to be a significant challenge for tissue engineers. The growth plate cartilage that promotes elongation of the long bones is a good model system for studying morphogenetic mechanisms because cartilage is composed of a single cell type, the chondrocyte; chondrocytes are readily maintained in culture; and growth trajectory is predominately in a single vector. In this cartilage, growth is generated via a differentiation program that is spatially and temporally regulated by an interconnected network composed of long- and short-range signaling mechanisms that together result in the formation of functionally distinct cellular zones. To facilitate investigation of the mechanisms underlying anisotropic growth, we developed an in vitro model of the growth plate cartilage by using neonatal mouse growth plate chondrocytes encapsulated in alginate hydrogel beads. In bead cultures, encapsulated chondrocytes showed high viability, cartilage matrix deposition, low levels of chondrocyte hypertrophy, and a progressive increase in cell proliferation over 7 days in culture. Exogenous factors were used to test functionality of the parathyroid-related protein-Indian hedgehog (PTHrP-IHH) signaling interaction, which is a crucial feedback loop for regulation of growth. Consistent with in vivo observations, exogenous PTHrP stimulated cell proliferation and inhibited hypertrophy, whereas IHH signaling stimulated chondrocyte hypertrophy. Importantly, the treatment of alginate bead cultures with IHH or thyroxine resulted in formation of a discrete domain of hypertrophic cells that mimics tissue architecture of native growth plate cartilage. Together, these studies are the first demonstration of a tunable in vitro system to model the signaling network interactions that are required to induce zonal architecture in growth plate chondrocytes, which could also potentially be used to grow cartilage cultures of specific geometries to meet personalized patient needs.

Keywords: 3D culture model; IHH/PTHrP signaling; alginate hydrogel; growth plate cartilage; tissue architecture.


Conflict of interest statement

No competing financial interests exist.

Figures

<b>FIG. 1.</b>
FIG. 1.
Culture in alginate hydrogel promotes chondrocyte growth. (A) Invitrogen Live/Dead assay to determine chondrocyte viability for at least a week of alginate culture. Evident cell proliferation is noticed over time, but low amounts of dead cells are seen at all time points (n = 3). (B) Immunofluorescence assay demonstrating the formation of pericellular matrix in alginate culture using antibodies against Collagen IV (left) and Collagen VI (right). Freshly isolated chondrocytes lack ECM staining, but they produce de novo ECM after 1 day in alginate culture. On day 4 (right), a secondary ECM structure is observed resembling territorial matrices (n = 4). Arrowheads in (B) indicate the position of the cell membrane. Scale bar is 150 μm in (A) and 10 μm in (B).
<b>FIG. 2.</b>
FIG. 2.
Culture in alginate hydrogel restrains cartilage differentiation. Gene expression analysis of alginate cultures using ddPCR (n = 4) to count mRNA transcripts of Collagen 2 (A), Collagen 1 (B), Collagen X (D), and PTHrP (F). Values are reported as fold change in gene expression relative to day 1. (C) Ratio of mRNA transcript counts of Collagen 2 and Collagen 1. (E) Propidium iodide cell cycle analysis by FACS to quantify percentage of cells in S phase (DNA synthesis for cell proliferation/growth). Alginate cultures tend to increase the number of proliferating cells over time, compared with D0 and D1 (n = 3). *p < 0.05, **p < 0.01. ddPCR, digital droplet polymerase chain reaction; FACS, fluorescence-activated cell sorting; PTHrP, parathyroid-related protein.
<b>FIG. 3.</b>
FIG. 3.
Treatment with PTH1–34 accelerates the chondrocyte response to alginate bead culture. (A) Propidium iodide cell cycle analysis by FACS to quantify percentage of cells in S phase (DNA synthesis for cell proliferation/growth). PTH treatment on day 1 stimulates proliferation similar to levels that are typically seen in day 4 cultures. However, 4 days of PTH treatment has little effect (n = 4). (B–E) Gene expression analysis was performed on PTH-treated alginate cultures with ddPCR to count mRNA transcripts. On day 1 (left), PTHrP signaling inhibits expression of Collagen X (B), IHH (C), and PTHrP (E), but not Collagen 2 (D). After 4 days of culture (right), the effects of PTHrP on gene expression are greatly attenuated (n = 3). *p < 0.05, **p < 0.01, and ***p < 0.001. IHH, Indian hedgehog; N.S., not significant.
<b>FIG. 4.</b>
FIG. 4.
Visualizing chondrocyte gene expression in alginate bead culture. (A) Fluorescent images generated by using our improved protocol exploiting acrylamide embedding of fixed beads in conjunction with fluorescent in situ hybridization (FISH) to visualize cells that highly express Collagen II (left) and Collagen X (right) as a cell-by-cell measure of hypertrophic differentiation. Images are analyzed via a fully automated macro in ImageJ to quantify the percentage of cells expressing each gene relative to a nuclear DAPI stain. Ratio of these percentages was calculated (ColX/Col2) to yield a hypertrophic index (refer to Methods for more details). (B) Quantification of hypertrophic index in PTH1–34 treated and untreated cultures (n = 3). PTH1–34, parathyroid hormone 1–34.
<b>FIG. 5.</b>
FIG. 5.
Induction of hypertrophy after exogenous activation of IHH signaling. (A, B) Analysis of FISH-derived images to calculate the extent of hypertrophy in alginate cultures treated with thyroxine (10, 500 ng/mL), BMP4 (1, 5 ng/mL), PMA (0.5, 5 μg/mL), and IHH (100 ng/mL) for a single day (A) and for 4 days in culture (B) (n = 3). In panel B, PMA 20 day 4, the error bar is much larger than the rest of the data points and, therefore, is clipped by the axis. (C, D) Propidium iodide analysis of stimulated bead cultures was performed to quantify the percentage of cells in S phase (n = 3) on days 1 (C) and 4 (D). *p < 0.05, **p < 0.01, and ***p < 0.001. BMP4, bone morphogenetic protein-4; PMA, purmorphamine.
<b>FIG. 6.</b>
FIG. 6.
IHH treatment in alginate bead culture is sufficient to establish chondrocyte zonal arrangement. (A) FISH (top) was used to visualize ColX-expressing (left) and ColII-expressing (right) cells in 100 ng/mL IHH-treated cultures. White dotted lines delineate the observed zones of predominant expression. Red dotted lines delineate the outer boundary of the bead. Beads form a ColX-enriched ring (outer portion) surrounding a ColII-enriched core (inner portion). DAPI (middle) is shown on the right to demonstrate that cells are still evenly dispersed in hydrogel culture after 4 days, aside from isogenic groups, (n = 3). (B) Counts of ColII-expressing and ColX-expressing cells (divided by the count of DAPI-positive nuclei in each FISH image), stacked in a bar graph to illustrate the relative predominance of hypertrophic versus nonhypertrophic chondrocytes in different domains of the IHH-treated alginate beads. (C) Hypertrophic indexes of different domains of the IHH-treated alginate beads. (D) FISH was used to visualize ColX-expressing (left) and total (right) chondrocytes in alginate cultures treated with 10 ng/mL thyroxine.
<b>FIG. 7.</b>
FIG. 7.
Model exploring the potential mechanisms of IHH-driven zonal demarcation. Possibilities include an outside-in IHH-diffusion gradient (left) where cells that are exposed to high levels of IHH are induced to hypertrophy, but at the center of the bead, cells are seeing less IHH and maintain a static differentiation state. Alternatively, IHH diffuses into the bead rapidly, creating a uniform IHH concentration in media (right). Under this model, IHH induction of hypertrophy is balanced by endogenous PTHrP expression (differentiation block). Since PTHrP rapidly diffuses out of alginate but is constantly produced, this forms a radial gradient of PTHrP from the inside out where cells on the outer ring are exposed to a higher IHH/PTHrP ratio, causing induction of hypertrophy.

References

    1. van der Eerden B.C.J., Karperien M., and Wit J.M. Systemic and local regulation of the growth plate. Endocr Rev 24, 782, 2003 - PubMed
    1. Kozhemyakina E., Lassar A.B., and Zelzer E. A pathway to bone: signaling molecules and transcription factors involved in chondrocyte development and maturation. Development 142, 817, 2015 - PMC - PubMed
    1. Romereim S.M., Conoan N.H., Chen B., and Dudley A.T. A dynamic cell adhesion surface regulates tissue architecture in growth plate cartilage. Development 141, 2085, 2014 - PMC - PubMed
    1. Tsang K.Y., Chan D., and Cheah K.S. Fate of growth plate hypertrophic chondrocytes: death or lineage extension? Dev Growth Differ 57, 179, 2015 - PubMed
    1. Kronenberg H.M. Developmental regulation of the growth plate. Nature 423, 332, 2003 - PubMed

Publication types